ES Monday 10-31-11
Here's my 20 days worth of 30min chart action displaying All Trading Hours as a MAP of what I'm looking at coming into Monday. The Red lines are potential significant PASR levels with Magenta lines being semi-significant. The White dashed lines are the Wkly Pivots. The right vertical axis shows 20 days of Volume Profile in Light Blue. The background displays RTH in Blue with "after hours" in Gray. Hope this is helpful for some folks.
Click image for original size
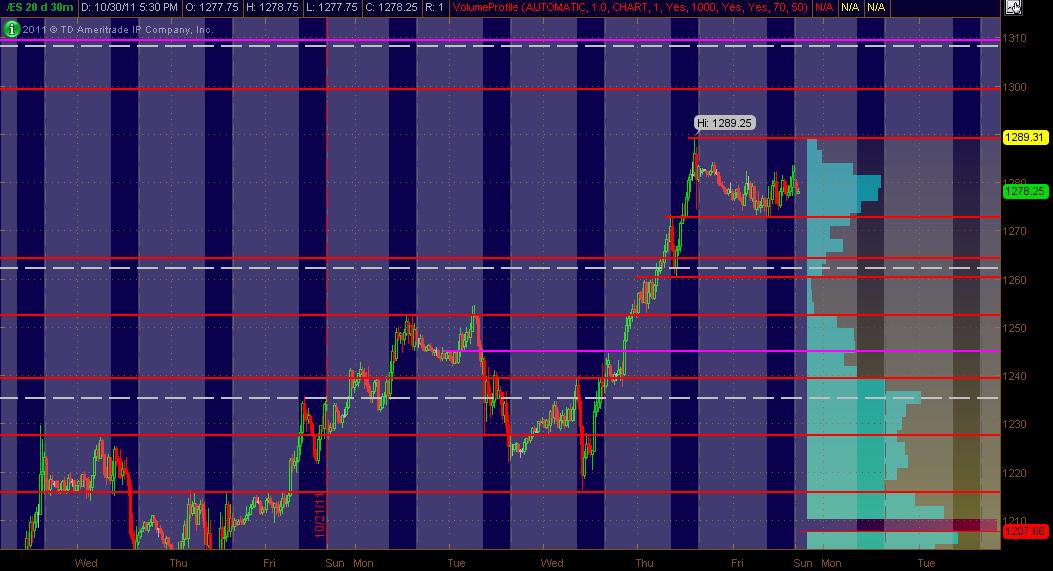
1314 PASR
1310-08 semi-PASR, Wkly Pvt, and Fib
1301-1299 PASR, Daily Pvt
1290 PASR, Daily Pvt
1275-73 PASR, Daily Pvt, Fib
1262-60 PASR, Wkly Pvt, Fib
next level down would be 1254-52
All are ZONES
1310-08 semi-PASR, Wkly Pvt, and Fib
1301-1299 PASR, Daily Pvt
1290 PASR, Daily Pvt
1275-73 PASR, Daily Pvt, Fib
1262-60 PASR, Wkly Pvt, Fib
next level down would be 1254-52
All are ZONES
Watching for the first break of Friday's RTH extremes as it was an IDNR4.
Other levels are:
1313-17
1305-08
1297-99
1292-94
1286-88
1275-76
1259-62
1250-51
NPOC 1248.25
NPOC 1235.25
Good luck to all especially NE USA with their storm issues!
Other levels are:
1313-17
1305-08
1297-99
1292-94
1286-88
1275-76
1259-62
1250-51
NPOC 1248.25
NPOC 1235.25
Good luck to all especially NE USA with their storm issues!
Here is how the last two days look from an MP perspective. I took some liberties by splitting out the breakout point from Thursday in the "E" period and combining the later part of Thursdays trade with all of Fridays trade. This excludes the overnight session. The rally point began in "E" period on Thursday. So that 65 - 66 price will need to be watched too.
You can also see how we have created one nice big bell curve with Fridays trade being inside Thursdays trade. Key transition points ( fade points) start at the 71.50 - 72.50 area on the downside and above 84 on the upside. We have all that beautiful volume at the 78 -78.50 number to hopefully work with. The red line is actually the peak volume price.
You can also see how we have created one nice big bell curve with Fridays trade being inside Thursdays trade. Key transition points ( fade points) start at the 71.50 - 72.50 area on the downside and above 84 on the upside. We have all that beautiful volume at the 78 -78.50 number to hopefully work with. The red line is actually the peak volume price.
Click image for original size
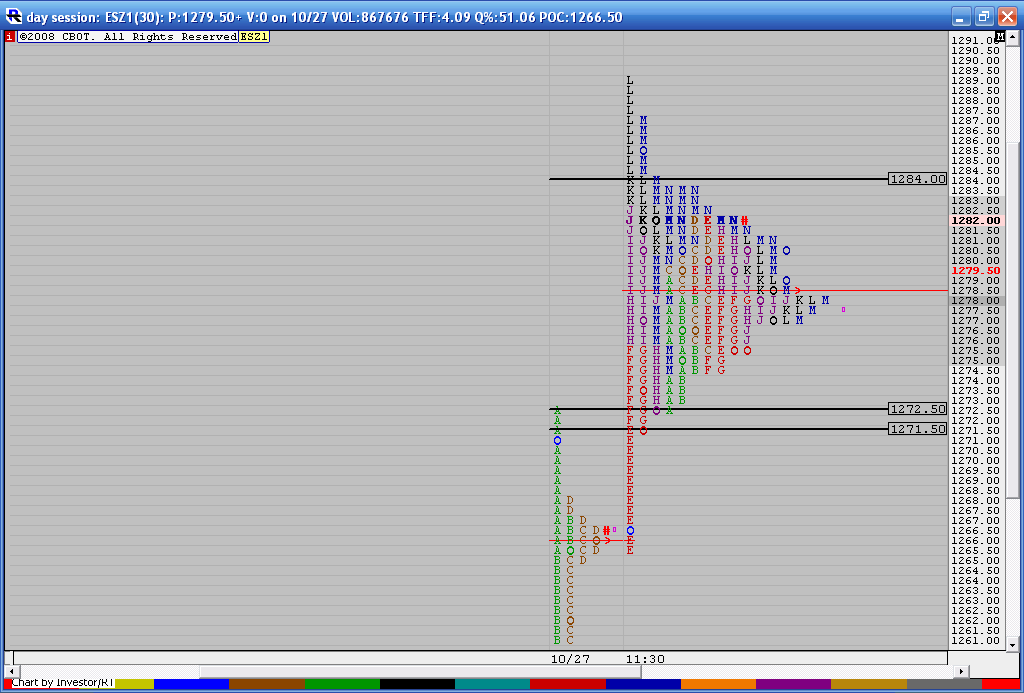
I mentioned on Friday how I thought we might be forming a bigger bell curve inside of last Thursdays large move up. Well they filled in the upper half on Friday and they seem to want to fill in the lower half today. The point is that they will need to spend time filling in above 1269.....at some point in order for that profile to round out.
My plan is to be agressive on buys near that 65 -66 area and also down near the 59 - 60 area with the major assumption that they will want to bring it back above 1269 at LEAST during the day session.
The market is at 1265 as I type in the overnight so will look to get long and small down here.....good luck...we may need it. Better trades with better support happen at 1259 - 1260 and also 1252 - 1254....not really planning on seeing that too soon but w'll see.
so my plan is still long up into 71 - 72.50 ultimately but initial target is 68.50 as that is peak O/N volume....
up at 71 - 72.50 I will look for shorts and use 68.50 as a target....
If I see 71- 72.50 start to look like it will turn into support then I will get long for 78.50...
below the O/N lows I will look for longs again at 59 - 61 area....then use 66 as a key target on that long
we have some nice frameworks to work from today
trying day session longs at 63.75...I missed a key area...sloppy on my part....
Chicago PMI in minutes
agressive taking all longs as air forms to downside...63.50 was low volume from last thursday....so was buying below there too...chart later
I was so caught up in providing those fancy tpo charts that I missed the fundamental area of volume...hopefully most saw the low volume area at 63.- 63.50 from Thursdays trade...let me know if u didn't and I'll post a shot of it
that was added reason I was buying below it with air creating....
I was too caught up in the classic support area at 59 - 60 too.....
that was added reason I was buying below it with air creating....
I was too caught up in the classic support area at 59 - 60 too.....
seems a bit odd that they will leave the 71 - 72.50 untouched today....my bias is still long .....runners getting stopped ..long again at 62.25
Careful with shorts here
Click image for original size
Emini Day Trading /
Daily Notes /
Forecast /
Economic Events /
Search /
Terms and Conditions /
Disclaimer /
Books /
Online Books /
Site Map /
Contact /
Privacy Policy /
Links /
About /
Day Trading Forum /
Investment Calculators /
Pivot Point Calculator /
Market Profile Generator /
Fibonacci Calculator /
Mailing List /
Advertise Here /
Articles /
Financial Terms /
Brokers /
Software /
Holidays /
Stock Split Calendar /
Mortgage Calculator /
Donate
Copyright © 2004-2023, MyPivots. All rights reserved.
Copyright © 2004-2023, MyPivots. All rights reserved.