ES Thursday 2-6-14
well I spent at least 1/2 hour trying to put together 3 videos for Wednesdays trade and it seems few are interested....that's ok as I don't want to waste my time or anyone else's so if nobody is getting anything out of them then there is no reason to make them...I'm cool with that...It's actually faster and easier to just post a chart or nothing at all....
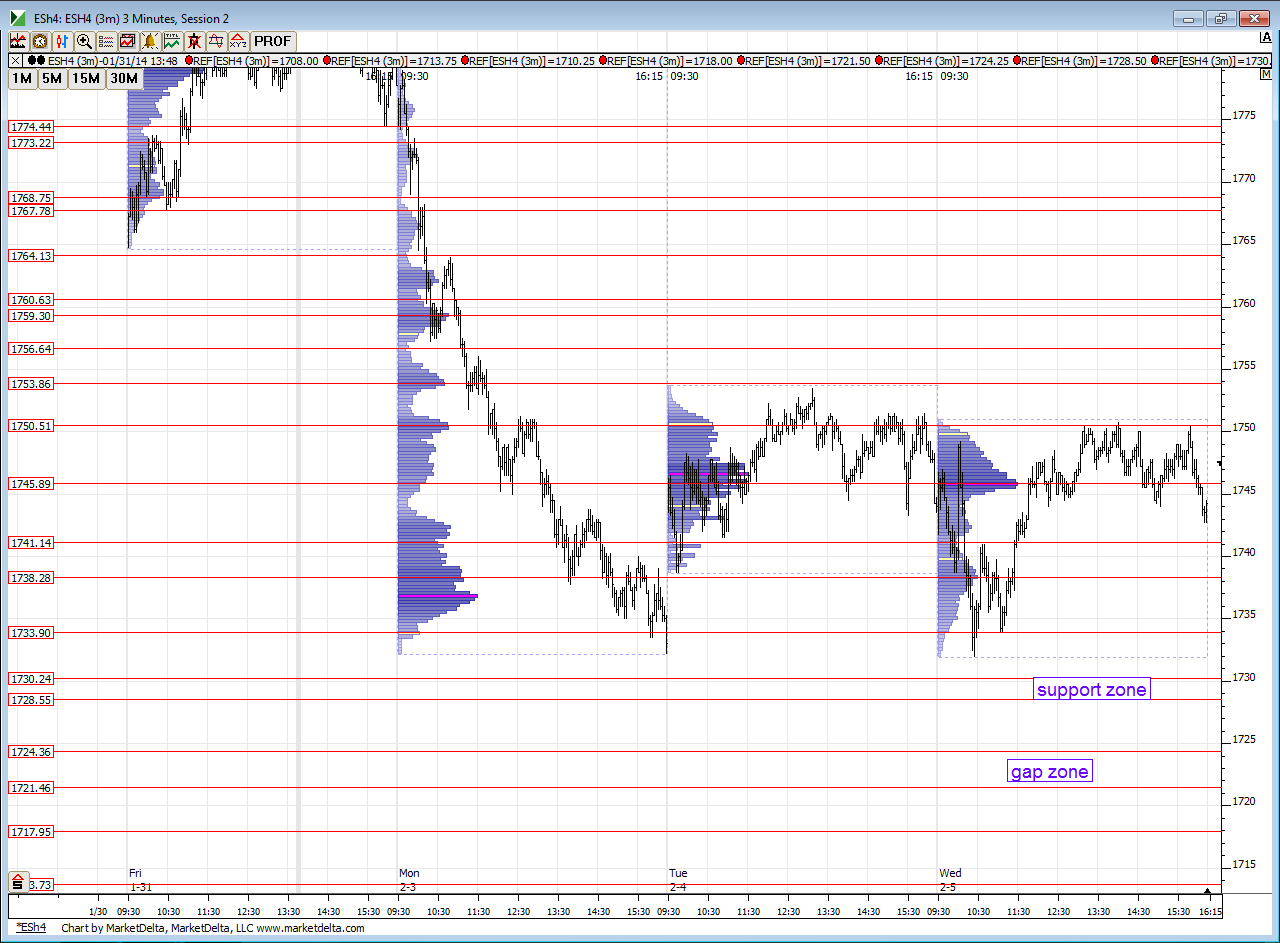
this isn't about votes or any of that...I just don't want to put in the time if nobody has feedback ( good or bad) or can contribute to the ideas....so we'll keep it to just a chart for Thursdays trade.....well compare these levels in the morning..two days have created some volume at 45.50 so we need to be aware of that.
this isn't about votes or any of that...I just don't want to put in the time if nobody has feedback ( good or bad) or can contribute to the ideas....so we'll keep it to just a chart for Thursdays trade.....well compare these levels in the morning..two days have created some volume at 45.50 so we need to be aware of that.
Click image for original size
flat at 65.25...no need to be in this
I use what I call the pace of the tape and wait to what I think is some form of slowing down...I also make sure I have context and usually my trades are at spots were we expect some S/R...often it will take me three tries at one of my area although I cannot and donot always post how many times I have tried...it happens too fast to actually trade and post here...so I am watching the pace from time and sales which works ok...I've tried footprints and someone is suppose to teach more more about tape reading so I am ALWAYS in search of ways to define my entries better.......
the past few months I have been taking more one minute range break trade which moves me into the market but I like those more when we open out of value....the other thing I I like to watch is one minute volume spikes on my lower histogram and many times you will need to take a break of the range of the highest bar after the spike...to get short...reverse for longs but it is best to have those happen at a predefined zone...a few of those happened today but didn't go far due to the trend...Look at the spikes near the 64 and also near 57.50 today...we also had spikes at the tuesday high but we hit the upper zone of the 56 - 57 before we traded below the low of any high bar....so often I combine the two ideas but lean on the pace of the tape more often
the past few months I have been taking more one minute range break trade which moves me into the market but I like those more when we open out of value....the other thing I I like to watch is one minute volume spikes on my lower histogram and many times you will need to take a break of the range of the highest bar after the spike...to get short...reverse for longs but it is best to have those happen at a predefined zone...a few of those happened today but didn't go far due to the trend...Look at the spikes near the 64 and also near 57.50 today...we also had spikes at the tuesday high but we hit the upper zone of the 56 - 57 before we traded below the low of any high bar....so often I combine the two ideas but lean on the pace of the tape more often
Originally posted by radyk
Bruce what do you use to time your entries? Do you just look for a level to hold and try for the best possible price or do you have a standard signal you use?
I like this idea Rburns and if anyone ever needs a video to explain an area or an idea I've rambled on about I would be more than happy to make one and post it !! so many of the ideas and areas are repeatable but it takes time to sink in and having a verbal expanation with a video may help at times.....
Hey - I saw your demark post yesterday.....he was calling for a top a few months ago too...I'm not busting on ya but these guys love to pound on the desk hard when they get it right but we hear nothing from them when they get it wrong.....thanks for posting that...I used his trend line qualifyers back in 1996 when I thought I was going to own the world trading a small basket of 5 commodities..they were good ideas so I'm not really bashing the guy...and I think I told ya how I had some indictaors on My Supercharts before they became Tradestation
Hey - I saw your demark post yesterday.....he was calling for a top a few months ago too...I'm not busting on ya but these guys love to pound on the desk hard when they get it right but we hear nothing from them when they get it wrong.....thanks for posting that...I used his trend line qualifyers back in 1996 when I thought I was going to own the world trading a small basket of 5 commodities..they were good ideas so I'm not really bashing the guy...and I think I told ya how I had some indictaors on My Supercharts before they became Tradestation
Originally posted by rburns
Bruce you have a lot of followers. May I suggest that you make your videos on occasion as there are many past ones people can watch. Why not just post the levels that you are looking at for the day. I think that would please all.
More important Bruce did you do the research I sent about fixing your back
I am in the process and reviewing some of those youtube videos....my wife has a bad back too so we are coming up with an overall back rebuilding plan and will incorporate those concepts too
In theory the current profile is "P" shaped and many would think that the buyers are struggling to maintain trade above those 64 lows...that is why the poc is forming where it is today.....if that is true then we should sell off after all these buyers give up....but lets suppose that all of us sellers have grown tried fading that area and we didn't get our big reward by trading back to the 61 area....what happens when nobody else is fading ? Well, then we will bust out to new highs and beyond....this is just another reason that trading when developing bell curves are forming is very difficult...we could make a bullish or bearish argument
Thanks Bruce, recently I have been trying to read the footprint charts, but to be honest a systematic entry eludes me at this point. It is too much a leap of faith at support and resistance that I wish I could refine much better.
this market is cruel but we must repect it...I would have been positive on the day if I could have held that longer.....it is the "what if's" that will drive ya nuts in trading....we imagine what would happen and how much $$$$ we would have if we held.......well, we also need to keep our sanity and stress levels in check and just ge grateful....
for me, I am grateful that it wasn't a big loser of a day.....and that is saying a lot as a fader on a trend day ...LOL!
they hit into the 61 area ....so that keeps it in check and they didn't blow through to a fourth zone before testing one before it...didn't help me though....buyers want to try and keep this above that 59 - 61 level
yeah..the footprints always look better after the fact....on the website and in recap videos.....I'm sure there are some who do well with them but I don't know anybody yet......i guess it's part of the art form...we basically want to see when buyers or sellers get trapped and then take the opposite side
Originally posted by radyk
Thanks Bruce, recently I have been trying to read the footprint charts, but to be honest a systematic entry eludes me at this point. It is too much a leap of faith at support and resistance that I wish I could refine much better.
I refer to footprints but struggle to find consistency even when there is obvious delta divergence. Trying to find trapped long and short players is the key if you can determine that....
I agree ...that's when it becomes real important to see what happened with good old fashioned price action.......it can make a big tail or any large single print area a bit more manageable...also a great question to also ask your self is " are we able to hold in or out of value from previous days ?"...the time Value area high from monday was 59.50...so blowing through there and leaving a single print behind is sending a message.....which is always easier to see in hindsight...but might help if you trade outside the first 90 minutes etc..
Originally posted by sharks57
thx for clarifying Bruce, those profile tails still baffle me somewhat.
Emini Day Trading /
Daily Notes /
Forecast /
Economic Events /
Search /
Terms and Conditions /
Disclaimer /
Books /
Online Books /
Site Map /
Contact /
Privacy Policy /
Links /
About /
Day Trading Forum /
Investment Calculators /
Pivot Point Calculator /
Market Profile Generator /
Fibonacci Calculator /
Mailing List /
Advertise Here /
Articles /
Financial Terms /
Brokers /
Software /
Holidays /
Stock Split Calendar /
Mortgage Calculator /
Donate
Copyright © 2004-2023, MyPivots. All rights reserved.
Copyright © 2004-2023, MyPivots. All rights reserved.