ES Thursday 8-14-14
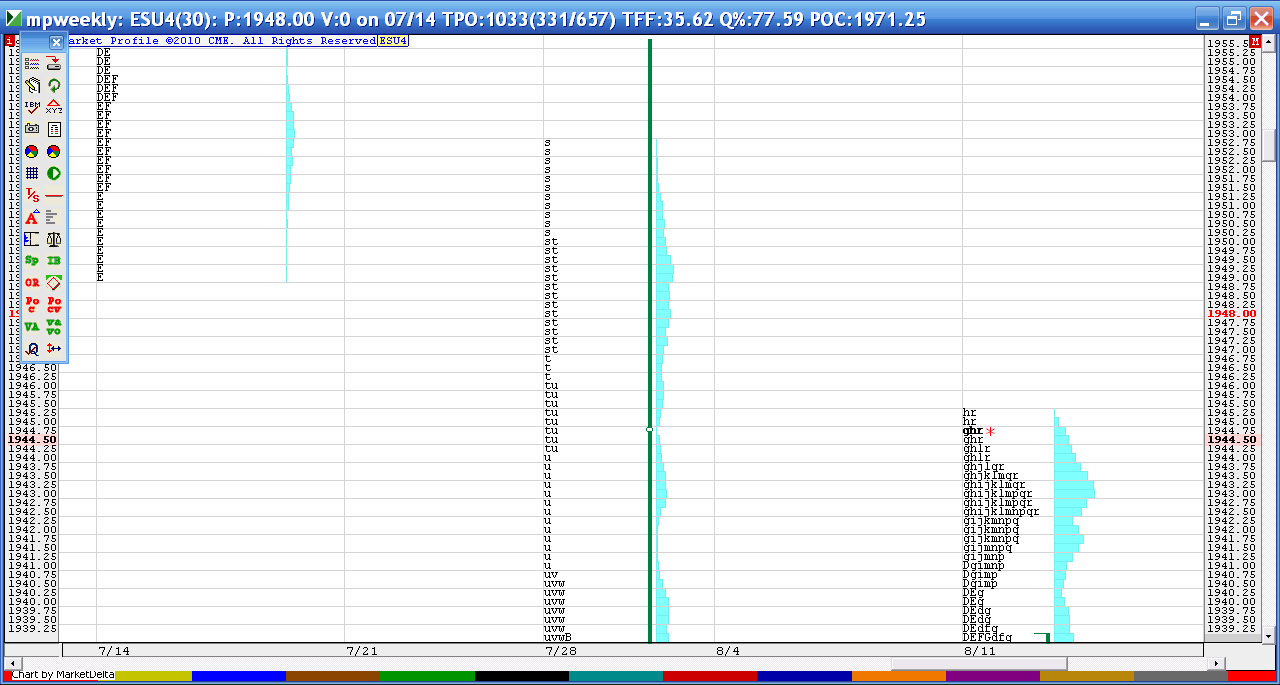
how I see it and how the weekly charts are shaping up...note the low volume/time areas on part of weekly chart shown below...key areas today will be 46.25 and 49.25 on upside first....below is POC of yesterday and 38.50 - 40 as a zone
Click image for original size
thanks for this and your explanation about yesterday
I'm long at 44 and trying to get above YD highs....for some reason I have a feeling they may drop it again before RTH opens////hope not
O/N value is within and above yesterday's upper distribution.
Looks like the market is (slowly) working the 7/31 multi-distribution.
Could 1952.75 be today's destination?
Welcome back, Bruce.
Looks like the market is (slowly) working the 7/31 multi-distribution.
Could 1952.75 be today's destination?
Welcome back, Bruce.
hard to see on my weekly chart but notice how that bulk of volume at 49.25 comes right at a previous weeks low....I like confluence like that....so look at the low on label of "7/14".....
thanks Aladdin..glad to be back in full force today
Nice pre market assessment Bruce
No open drive today.
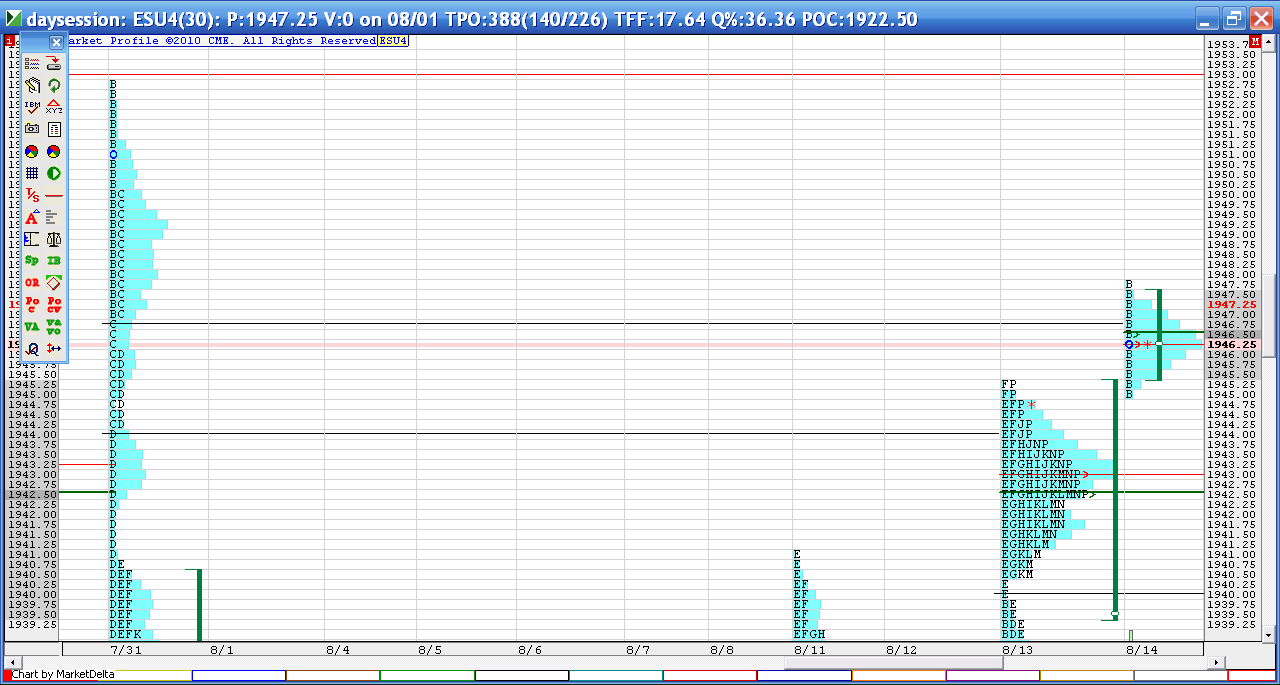
coming out at 47.25..single prints are here ..46.75...and I think the plan is to roll over and go back down to test the vpoc/poc of yesterday so hunting shorts in between 46 and 49.25..
I'd like to see the 10 am to close back inside the range and value area of yesterday to help us get that 42.50 - 43 area...
here's how I have it so far...we are battling at the 46.75 single print and if us sellers fail they will push towards that volume up at 49.25..see the bell there on volume....if we win then we will get our 43 price
Click image for original size
I realize that my chart isn't Markey Profile per say but more of buying and selling change as a measure of Delta. On the bottom is Volume imbalance as measured by upticks and downticks. At around 10:06 am I saw -3235 Delta to the downside or selling and at 10:13 am there was -3209. My take is that is excessive and we saw prices reverse around that time. Similar to footprint charts just different terminology. Hope that helps.
Sharks
Sharks
Emini Day Trading /
Daily Notes /
Forecast /
Economic Events /
Search /
Terms and Conditions /
Disclaimer /
Books /
Online Books /
Site Map /
Contact /
Privacy Policy /
Links /
About /
Day Trading Forum /
Investment Calculators /
Pivot Point Calculator /
Market Profile Generator /
Fibonacci Calculator /
Mailing List /
Advertise Here /
Articles /
Financial Terms /
Brokers /
Software /
Holidays /
Stock Split Calendar /
Mortgage Calculator /
Donate
Copyright © 2004-2023, MyPivots. All rights reserved.
Copyright © 2004-2023, MyPivots. All rights reserved.