ES Thursday 8-14-14
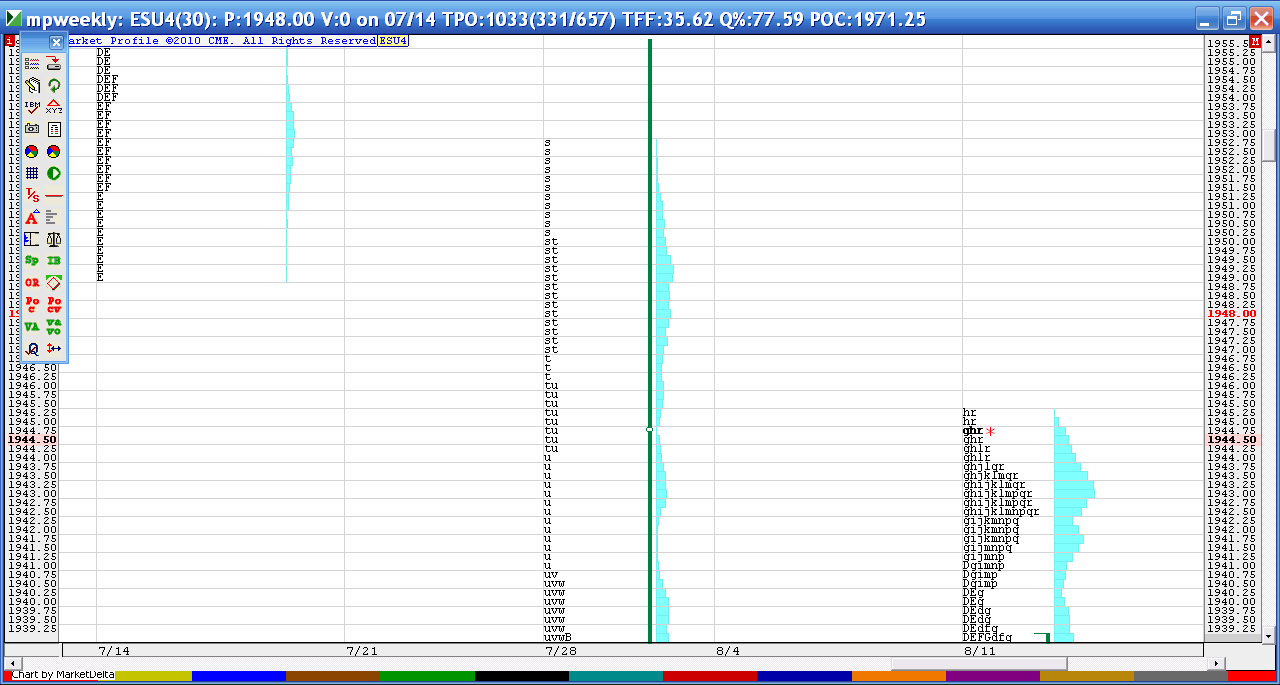
how I see it and how the weekly charts are shaping up...note the low volume/time areas on part of weekly chart shown below...key areas today will be 46.25 and 49.25 on upside first....below is POC of yesterday and 38.50 - 40 as a zone
Click image for original size
Great to see you back, Bruce.
and Thanks for the charts and explanations
and Thanks for the charts and explanations
coming out heavy at 44.25...they know where that POC/ vpoc is and I don't trust them..I also have a 30 minute naked vpoc at 44.50 !...will try to hold two runners for 43 and this will be it for me today
how my 30 minute vpoc chart looks...last two bars on the right are today.....all the rest is yesterday ....note that 44.50...!
Click image for original size
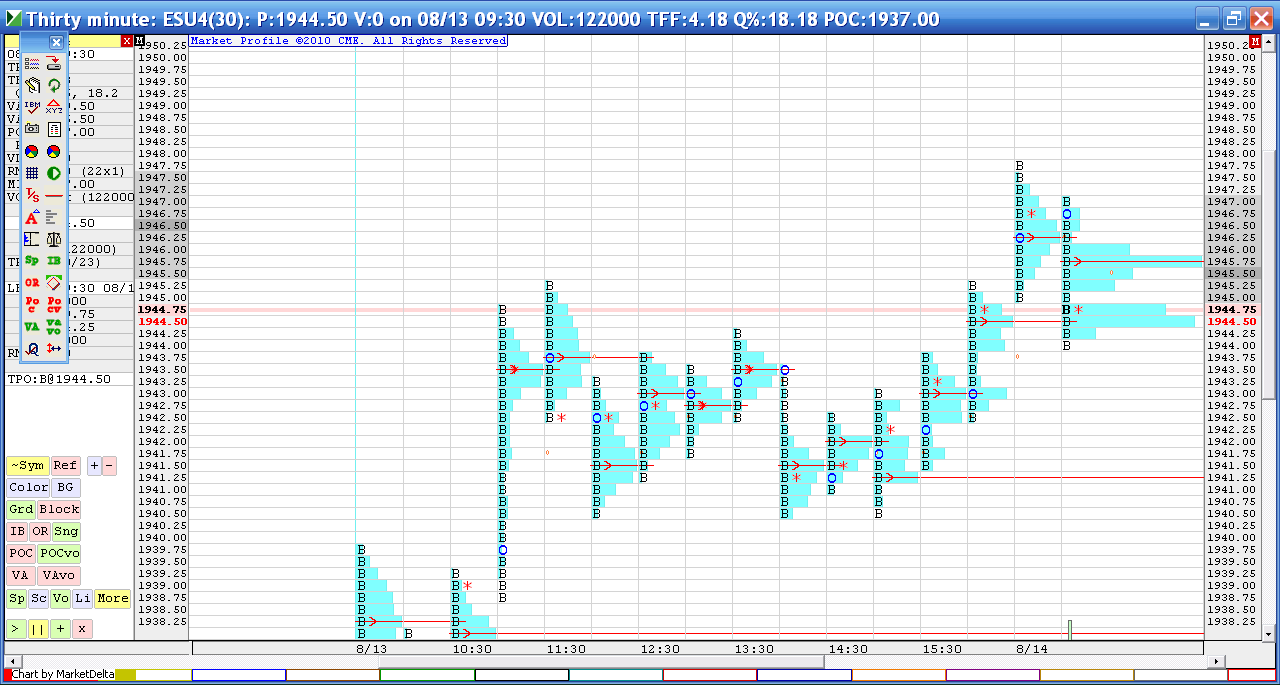
the real test comes now as we want to see if this is just the gap fillers buying back to cause a brief pop back up ( as they buy back shorts) or is it really buyers....? that 30 minute vpoc from yesterday happened at 4pm close....
Bruce, what would be a clue that it was really buyers?
my runners are stopped at 46.50.....i'd need to see us get back under YD highs in order to think of shorts or hittiing 49.25....probably better to call it a day..this is a tuff call as no O/N high or low is run yet either..the fact that we are chopping around that 46.75 single print could mean they are accepting the area now which could lead to higher prices still and the O/N high.....I
some volume on the LOWER volume histogram......but nothing ever really tells us until it's too late...that is why i always scale out quick at key areas and hope I get more...
Originally posted by Aladdin
Bruce, what would be a clue that it was really buyers?
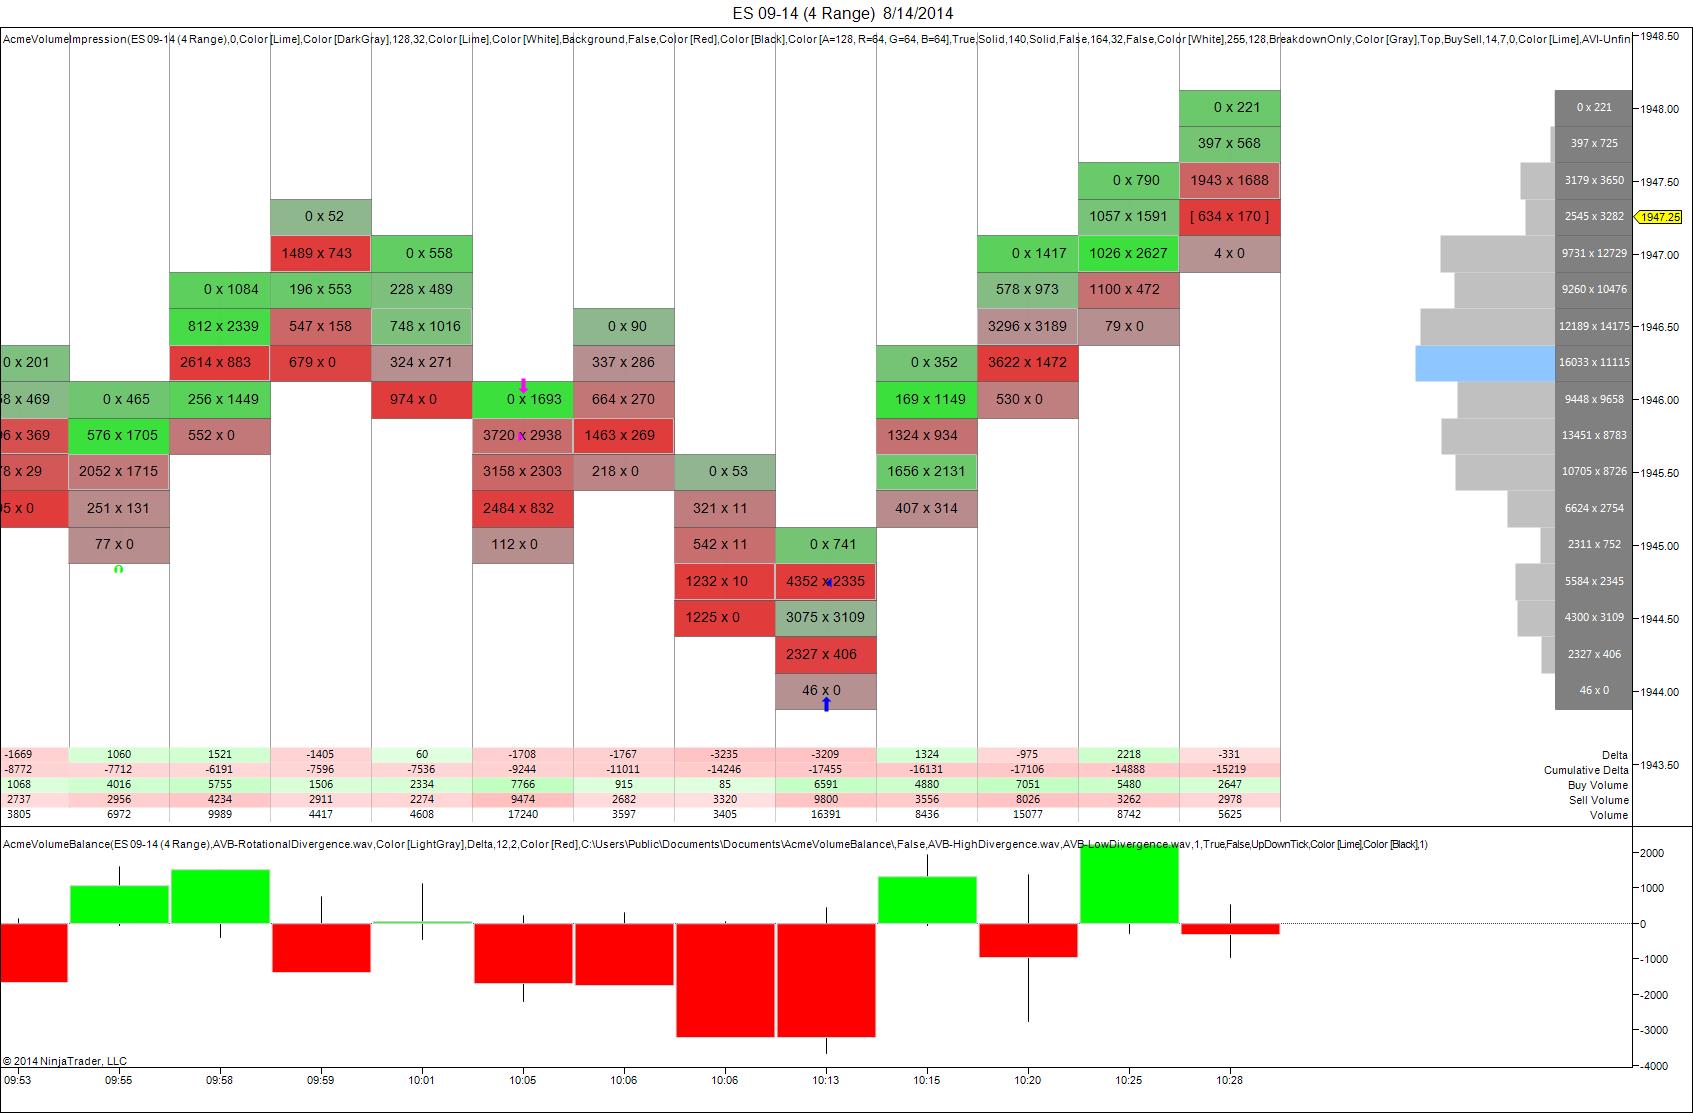
Lots of selling on the down tic around the 10:05 to 10:10 time frame. I think longs came in and are now squeezing those shorts out. See Impression chart
Click image for original size
and thanks for the good words here today too...i appreciate it
YEP Its good to have you back,, Was really quiet for a while there......
Originally posted by BruceM
and thanks for the good words here today too...i appreciate it
I realize that my chart isn't Markey Profile per say but more of buying and selling change as a measure of Delta. On the bottom is Volume imbalance as measured by upticks and downticks. At around 10:06 am I saw -3235 Delta to the downside or selling and at 10:13 am there was -3209. My take is that is excessive and we saw prices reverse around that time. Similar to footprint charts just different terminology. Hope that helps.
Sharks
Sharks
Emini Day Trading /
Daily Notes /
Forecast /
Economic Events /
Search /
Terms and Conditions /
Disclaimer /
Books /
Online Books /
Site Map /
Contact /
Privacy Policy /
Links /
About /
Day Trading Forum /
Investment Calculators /
Pivot Point Calculator /
Market Profile Generator /
Fibonacci Calculator /
Mailing List /
Advertise Here /
Articles /
Financial Terms /
Brokers /
Software /
Holidays /
Stock Split Calendar /
Mortgage Calculator /
Donate
Copyright © 2004-2023, MyPivots. All rights reserved.
Copyright © 2004-2023, MyPivots. All rights reserved.