ES Thursday 8-14-14
how I see it and how the weekly charts are shaping up...note the low volume/time areas on part of weekly chart shown below...key areas today will be 46.25 and 49.25 on upside first....below is POC of yesterday and 38.50 - 40 as a zone
Click image for original size
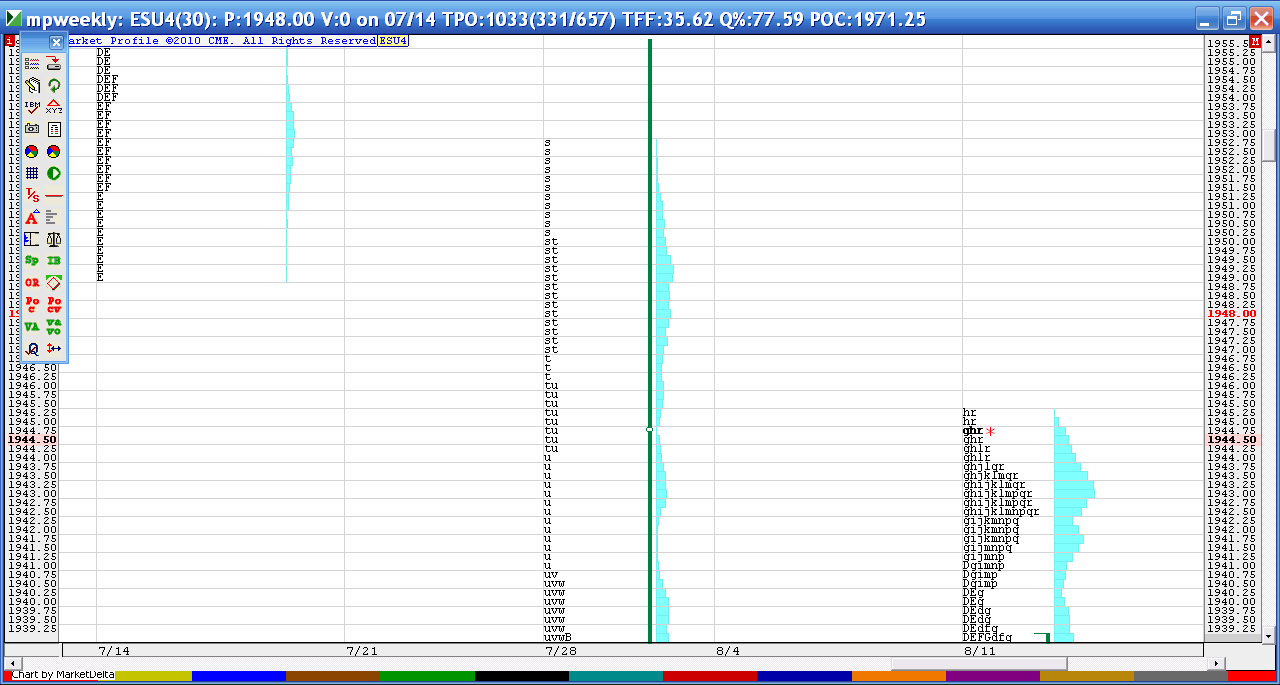
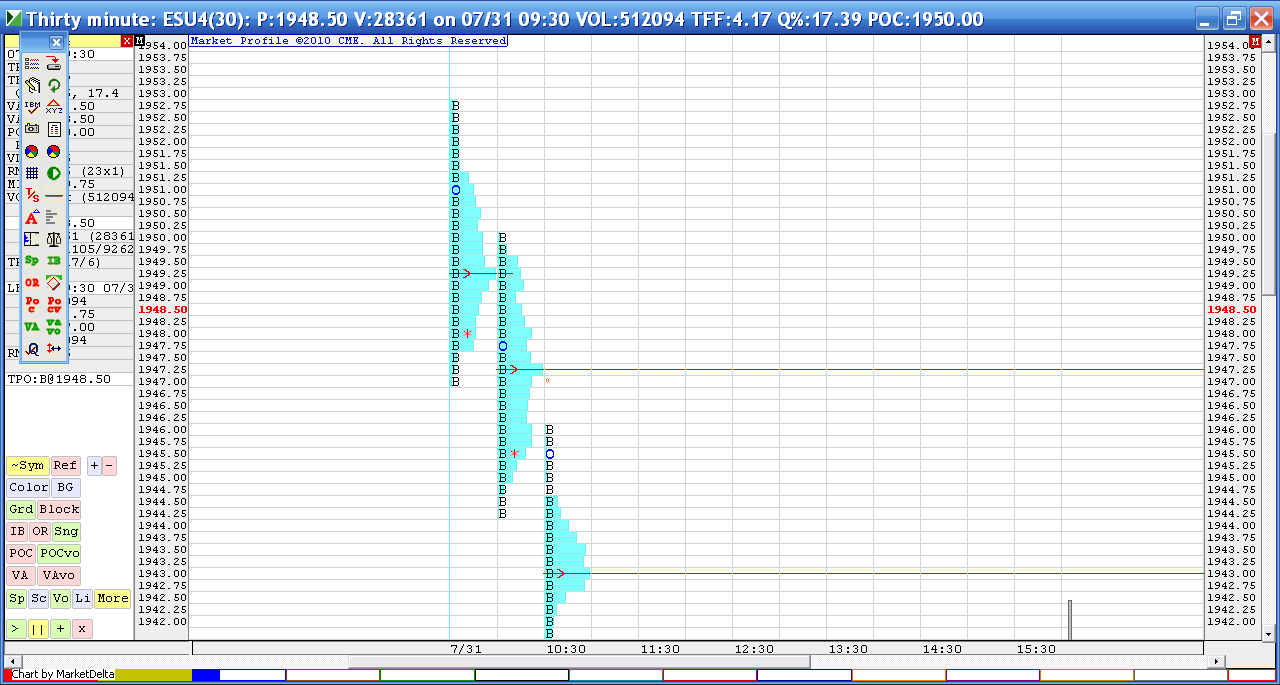
a quick look at where the volume came in to form the single prints on 7-31......look at the 47.25 vpoc and look where first push up stopped today.....next look at the volume at 49.25 and then see where selling tail begins....sellers up here now would not want price to stay long inside that selling tail from 7-31 ....if it gets that high....
Click image for original size
gonna try small sells against 49.25...very small.,.gonna watch 50.25 - 53 closely in general but will not risk 4 points on this trade idea....I'd rather take a few small stabs
first target point is only the IB breakout point...not much to work with as targets are so close
midpoint and vpoc is 46.50 now
best fill is 48 even....will try to hold one for 46.75...this was a small campaign...just trying to take little pieces
see how they hit into the center of the upper bell of 7-31 and now the trick is for them to get out back under the lower edge of the bell...that single print area from that day.....if they hold above that then should in theory push for the high of the 7-31 day !!.... I just hit final target........right on schedule.....it's almost 90 minutes of trade ....my favorite time.........ok..maybe a bit of bravado here but hope some see the ideas at play ..
Thanks Bruce.
Maybe trying to figure out if sellers/buyers enter the market is more of a hindsight game?
When you were on holiday, there was Printer posting great charts with clear comments written inside those charts.
It is always nice to read different views for the day.
Maybe trying to figure out if sellers/buyers enter the market is more of a hindsight game?
When you were on holiday, there was Printer posting great charts with clear comments written inside those charts.
It is always nice to read different views for the day.
was that here on these threads ? I'd like to view them wherever they are
Yep, just look in the ES threads I started.
I found one:
http://www.mypivots.com/board/topic/8156/-1/es-friday-7-25-2014
Pretty lonely in these threads when you are on holiday, by the way.
http://www.mypivots.com/board/topic/8156/-1/es-friday-7-25-2014
Pretty lonely in these threads when you are on holiday, by the way.
I realize that my chart isn't Markey Profile per say but more of buying and selling change as a measure of Delta. On the bottom is Volume imbalance as measured by upticks and downticks. At around 10:06 am I saw -3235 Delta to the downside or selling and at 10:13 am there was -3209. My take is that is excessive and we saw prices reverse around that time. Similar to footprint charts just different terminology. Hope that helps.
Sharks
Sharks
Emini Day Trading /
Daily Notes /
Forecast /
Economic Events /
Search /
Terms and Conditions /
Disclaimer /
Books /
Online Books /
Site Map /
Contact /
Privacy Policy /
Links /
About /
Day Trading Forum /
Investment Calculators /
Pivot Point Calculator /
Market Profile Generator /
Fibonacci Calculator /
Mailing List /
Advertise Here /
Articles /
Financial Terms /
Brokers /
Software /
Holidays /
Stock Split Calendar /
Mortgage Calculator /
Donate
Copyright © 2004-2023, MyPivots. All rights reserved.
Copyright © 2004-2023, MyPivots. All rights reserved.