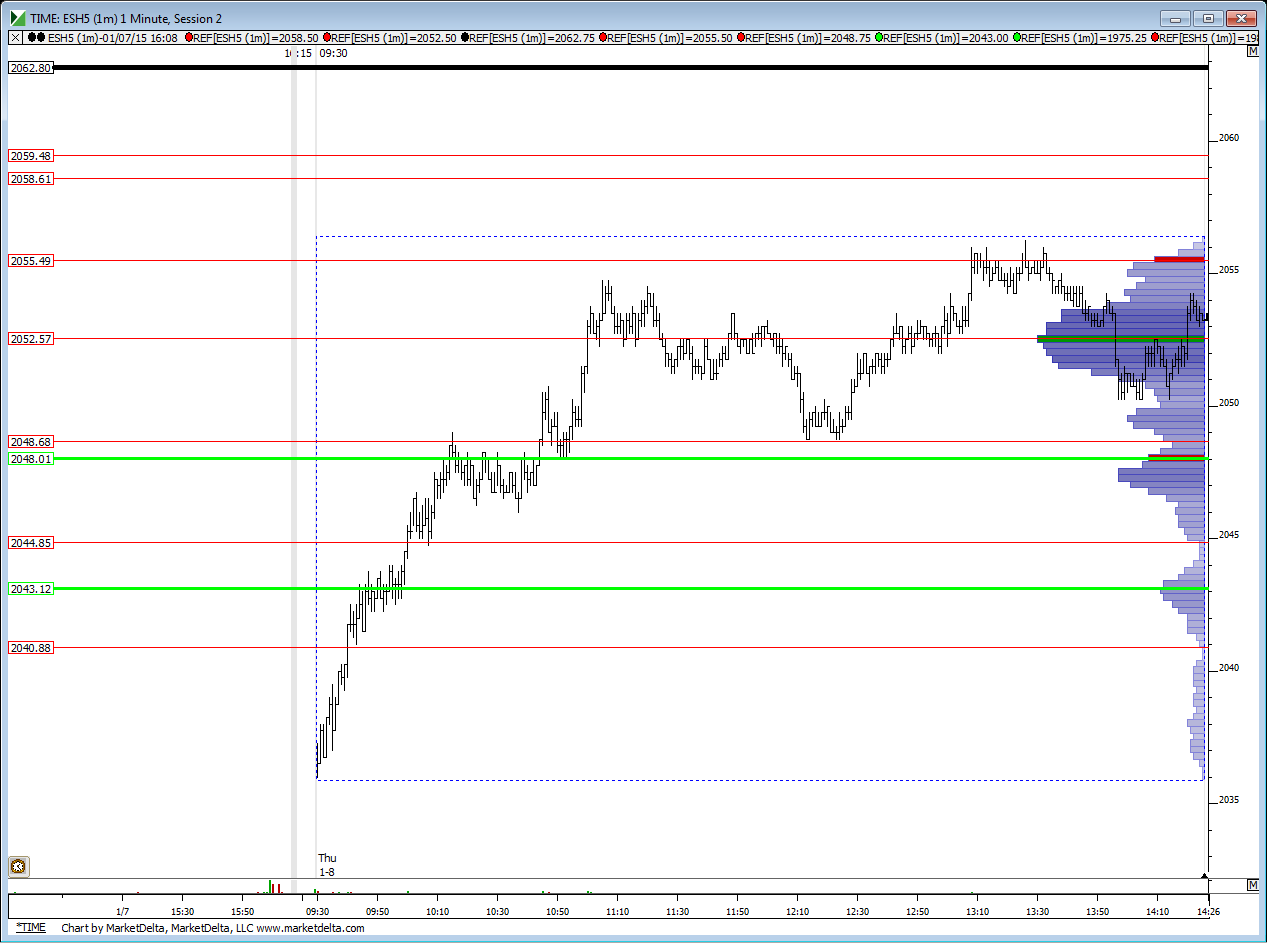
ES Thursday 1-8-15
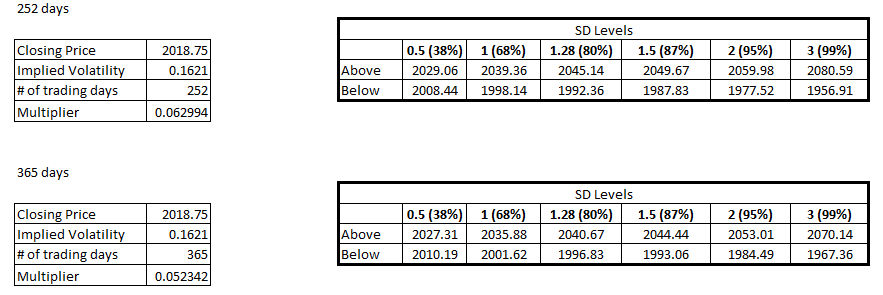
Note the change in bands. Now I am tracking only the 4pm close but both for 365 days as well as for 252 days. Use as you wish. I personally will see what lines up where and then use for confirmation.
Daily chart for tomorrow to follow soon
Daily chart for tomorrow to follow soon
Click image for original size
jing cut me off but this is how the lines did and didn't work...some front running , some greed that cost money and just poor opportunities today........# 1 think to keep in mind is just because we have some kind of probability it doesn't mean we will be given an opportunity to trade for those...I was expecting On midpoint which as I type still hasn't traded....but here is the big take away from all this.........Just trade your lines ( ok to front run as long as you have an overall risk structure in place) and only use runner contracts to try and hold for probabilities....
I forgot to mention that I took two tries at the 42.50 area....both losers.... (I didn't "hang on "as mentioned on the video...I took a loss and then tried a second time).also forgot to mention that I averaged in to the 53 - 54.25 area when R3 hit...so I averaged in on last trade
ok so here is my crude summary and i will post a chart of how today's lines currently look
here is how today is unfolding with the lines...I left the 58.50 - 59.50 on the chart...that is left over from Friday...just in case we make new highs at days end
Click image for original size
not an Mp concept but I have heard if you can't print R1 in the first 45 - 60 minutes then that can be a clue
Originally posted by daddywolf
is another concept...if price opens outside of R2...it means its seeking new value...I think that is a market profile type concept. clue as to the run up.
no but it can work great on a trend day but given that we only really trend 15 % of the time I have found it unusable for my fading style of trade
Originally posted by duck
vpoc of the 1st 30 min hasnt been tested correct? Bruce.the gen x trend indicator do you look at it? the trend indicator is the 22 and 50 ema if anybody wondering.i use it most on the 1 min chart.but the indicator works across all time frames.
thanks for the video Bruce and the notes. the greenies turned from resistance to support very quickly and i am going to have to adapt to that well enough to not lose money. i pay yet more tuition to the market. i am really hoping it pays off over time....
Emini Day Trading /
Daily Notes /
Forecast /
Economic Events /
Search /
Terms and Conditions /
Disclaimer /
Books /
Online Books /
Site Map /
Contact /
Privacy Policy /
Links /
About /
Day Trading Forum /
Investment Calculators /
Pivot Point Calculator /
Market Profile Generator /
Fibonacci Calculator /
Mailing List /
Advertise Here /
Articles /
Financial Terms /
Brokers /
Software /
Holidays /
Stock Split Calendar /
Mortgage Calculator /
Donate
Copyright © 2004-2023, MyPivots. All rights reserved.
Copyright © 2004-2023, MyPivots. All rights reserved.