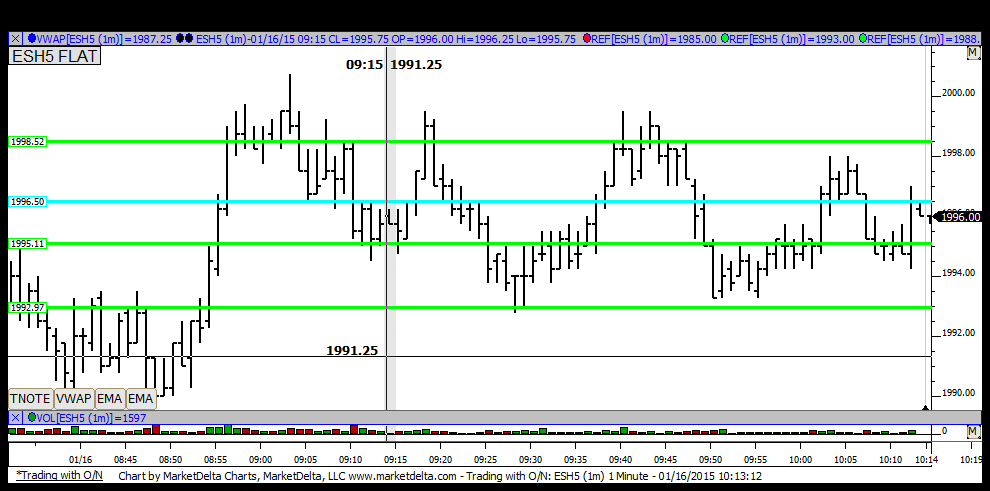
ES Friday 1-16-15
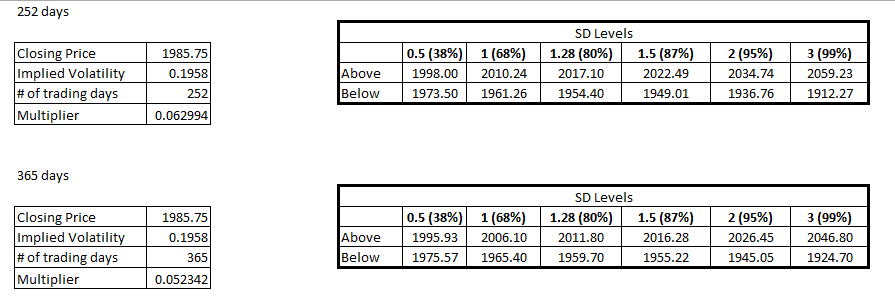
Here are the bands for today. We hit the lower 1 SD band based on 365 days YD
Click image for original size
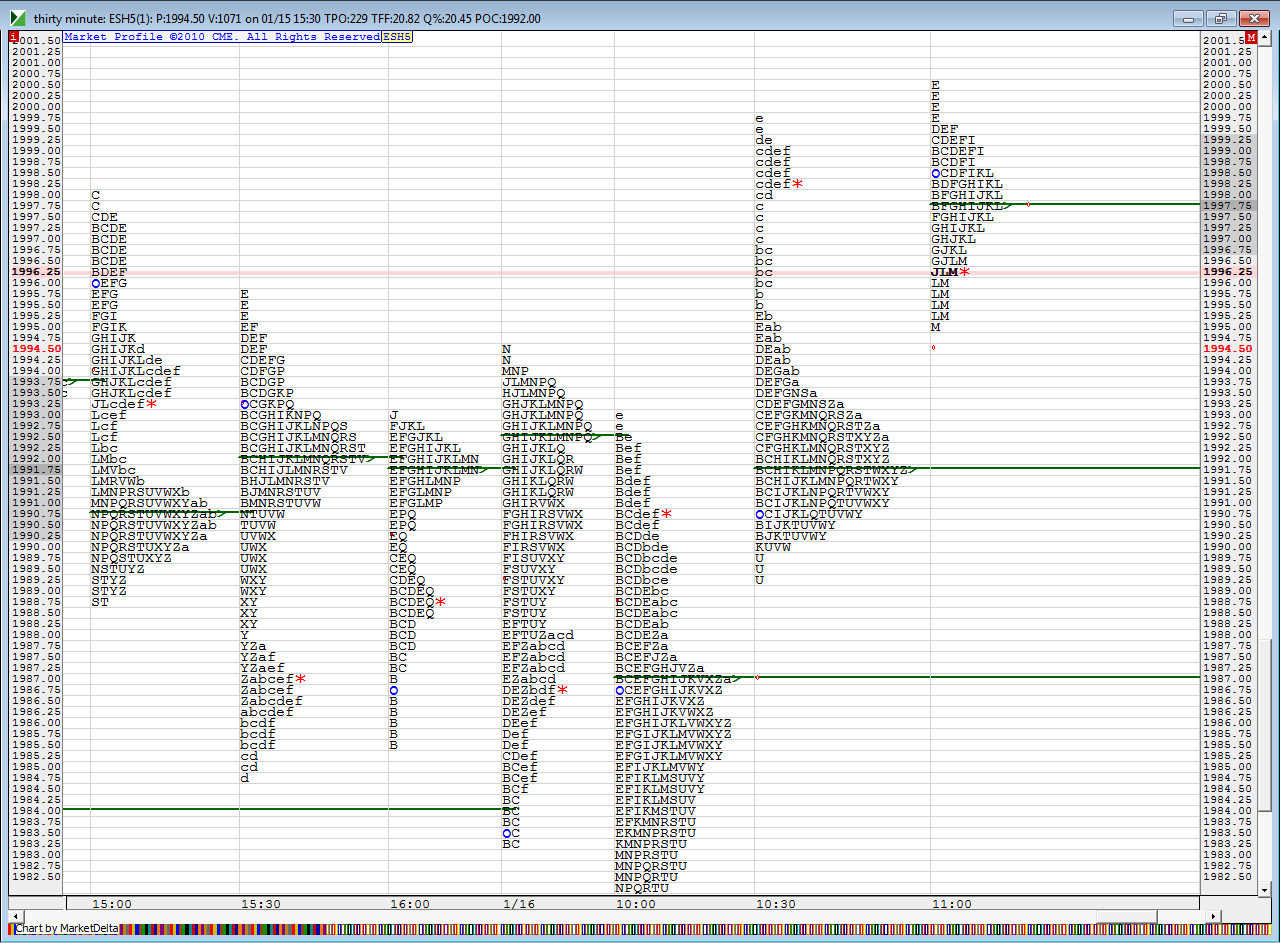
u need to decide if we are trending...here is a picture
Click image for original size
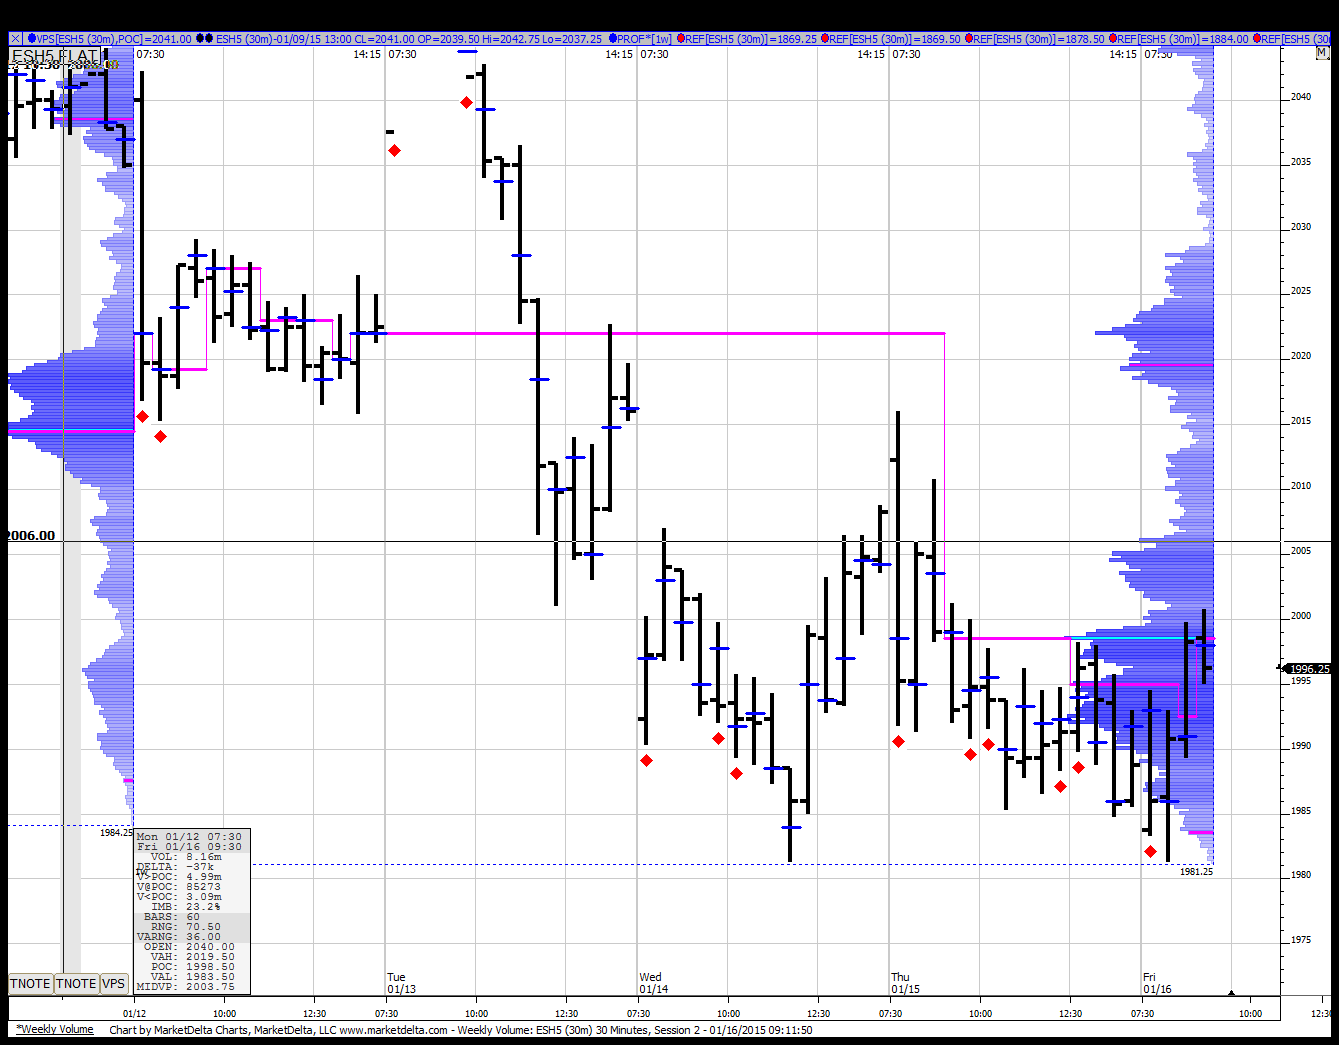
here is a weekly volume chart. we hit a LVN and that probably explains the pull back. could definitely push higher to the greenies that Bruce pointed out but looks like we are filling in some volume here now..
Click image for original size
thanks for the charts, the comments and so on Bruce...appreciate it.....and keep up the good work newkid
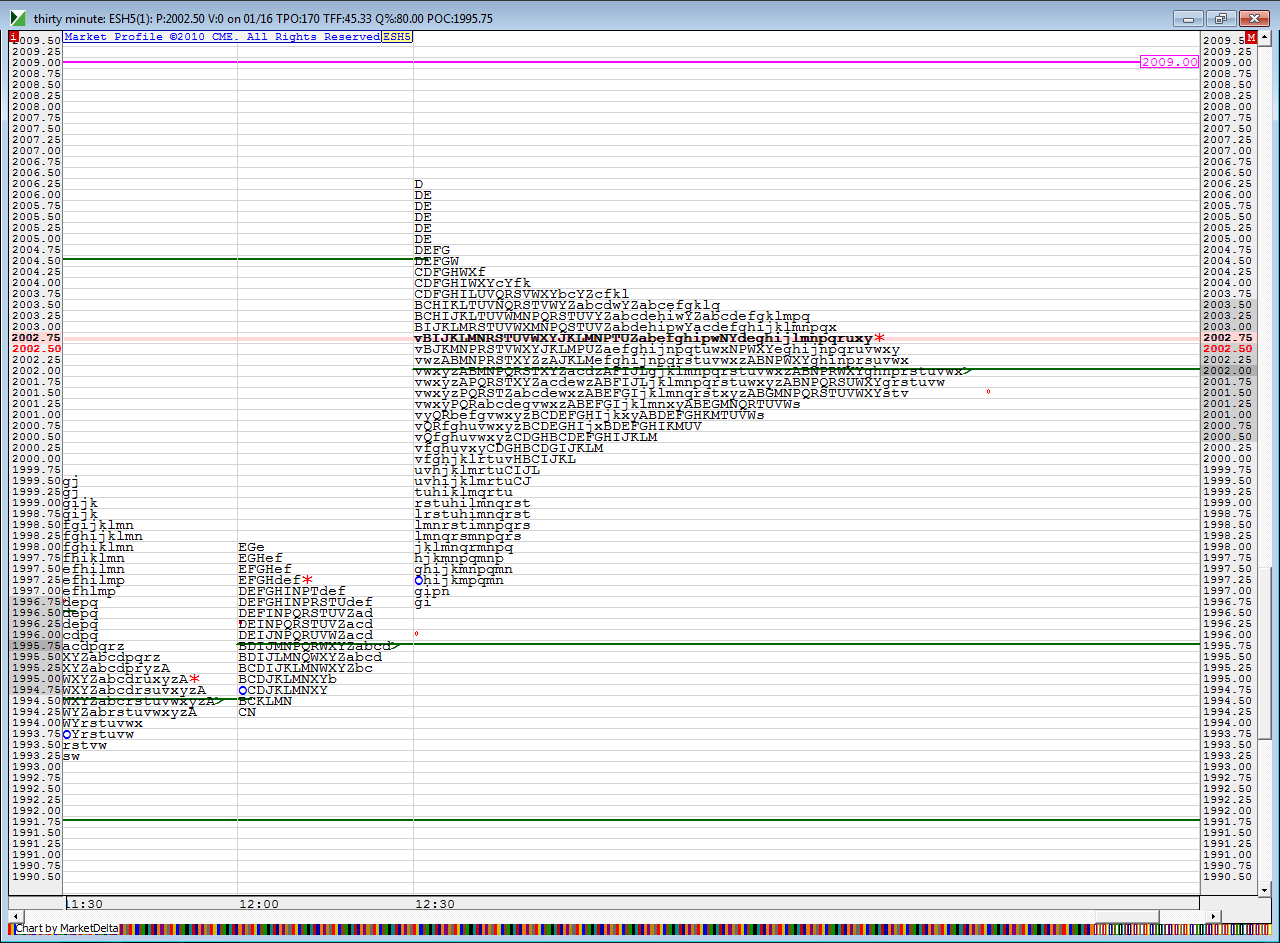
if you look at weekly time then 93.75 is the poc......it will take some volume to push away from there ...perhaps at days end but I keep expecting that area and that POc at 91.75 to be retested
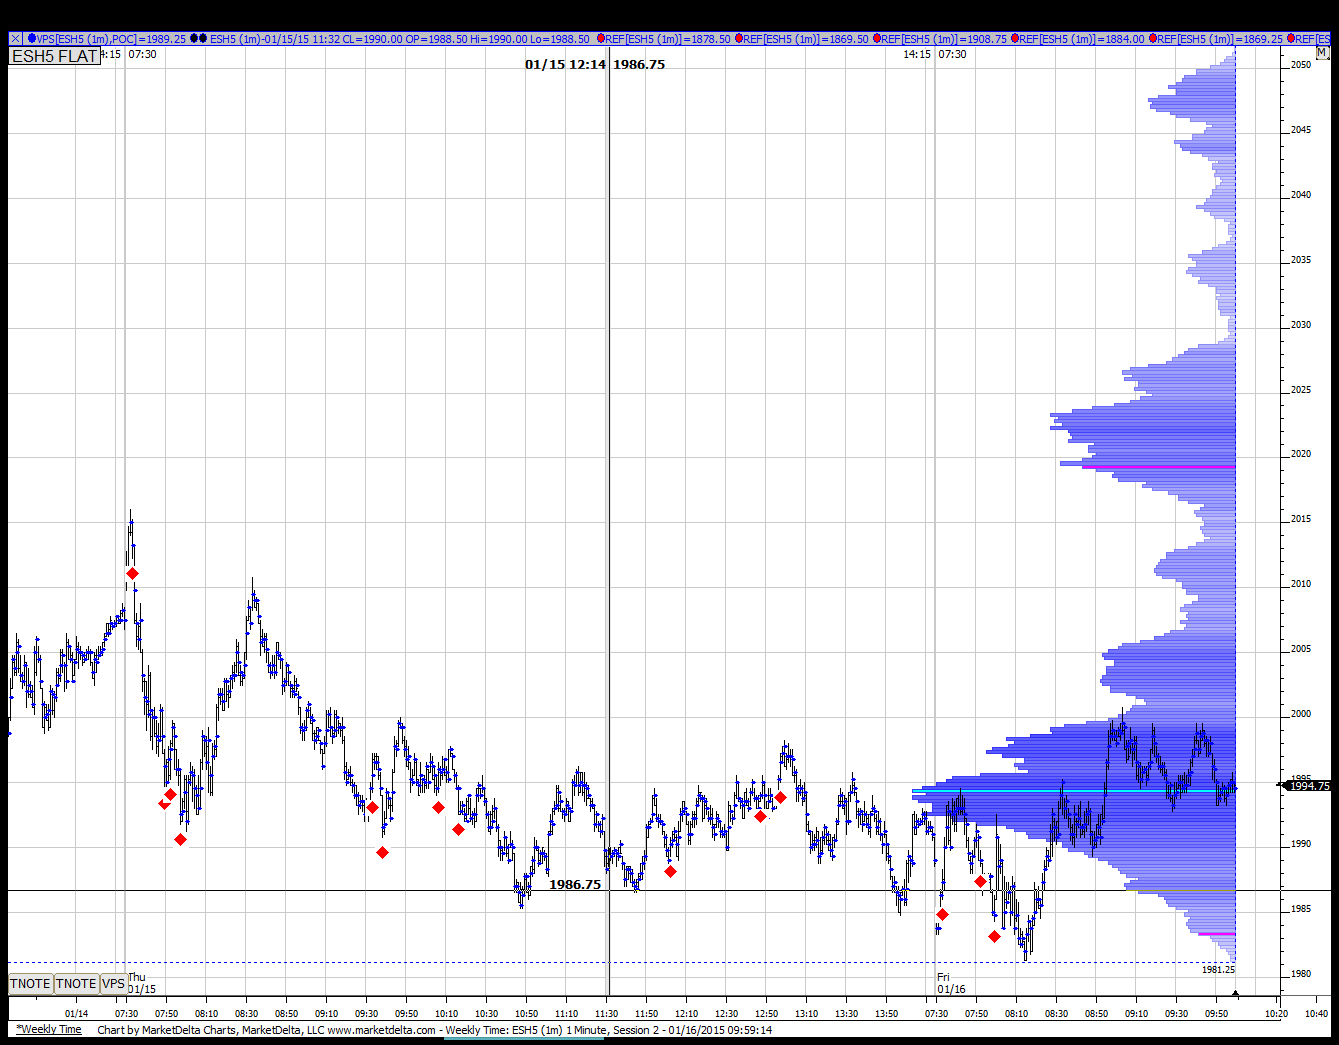
Picture of the weekly time...
Click image for original size
look at this picture of my zones... i one would think its easy to make money off of this but only if i knew it would play out this way ahead of time....lol
Click image for original size
nice comment APK.......I really admire newkids passion that comes through in the posts and we all need great words of encouragement....it's not easy posting ones thoughts and trials and tribulations even though we are only names at the end of a wire ( the internet)......I wish more would post the good, the bad and especially the ugly........ugly is great because it helps one improve.......so maybe we aren't really traders .....we should all call ourselves " Managers of Ugly "......if u can manage the ugly then you will win in the markets....
Originally posted by apk781
thanks for the charts, the comments and so on Bruce...appreciate it.....and keep up the good work newkid
my final babble for today...may be of interest to those who are now looking at 30 minute with one minute time on the charts..i want to post this even if I end up being wrong......the point is that these ideas can and should be used with a proper signal...we have now popped up to weekly LVN edge and just below the 2003.50 greenie....I still think there is repair work below but as usual we don't know "WHEN" this will happen...
so far a nice clean break fro 2000.5......so I would expect sellers to try from greenie at 2003.5 up to 2005.50 ..probably don't want it too much beyond that ....if you are trying to fade this on a friday....just another reason I don't trade too much outside my window
thank you for the kind words Bruce and apk. I am still learning from you folks...
Originally posted by BruceM
nice comment APK.......I really admire newkids passion that comes through in the posts and we all need great words of encouragement....it's not easy posting ones thoughts and trials and tribulations even though we are only names at the end of a wire ( the internet)......I wish more would post the good, the bad and especially the ugly........ugly is great because it helps one improve.......so maybe we aren't really traders .....we should all call ourselves " Managers of Ugly "......if u can manage the ugly then you will win in the markets....Originally posted by apk781
thanks for the charts, the comments and so on Bruce...appreciate it.....and keep up the good work newkid
how we look when I merge all the bars that started at 12.30....so 2002 seems to be the line to beat now
Click image for original size
Emini Day Trading /
Daily Notes /
Forecast /
Economic Events /
Search /
Terms and Conditions /
Disclaimer /
Books /
Online Books /
Site Map /
Contact /
Privacy Policy /
Links /
About /
Day Trading Forum /
Investment Calculators /
Pivot Point Calculator /
Market Profile Generator /
Fibonacci Calculator /
Mailing List /
Advertise Here /
Articles /
Financial Terms /
Brokers /
Software /
Holidays /
Stock Split Calendar /
Mortgage Calculator /
Donate
Copyright © 2004-2023, MyPivots. All rights reserved.
Copyright © 2004-2023, MyPivots. All rights reserved.