ES Wednesday 1-28-15
Here's how I see it and a still shot below for those who prefer not to hear me ramble
Click image for original size
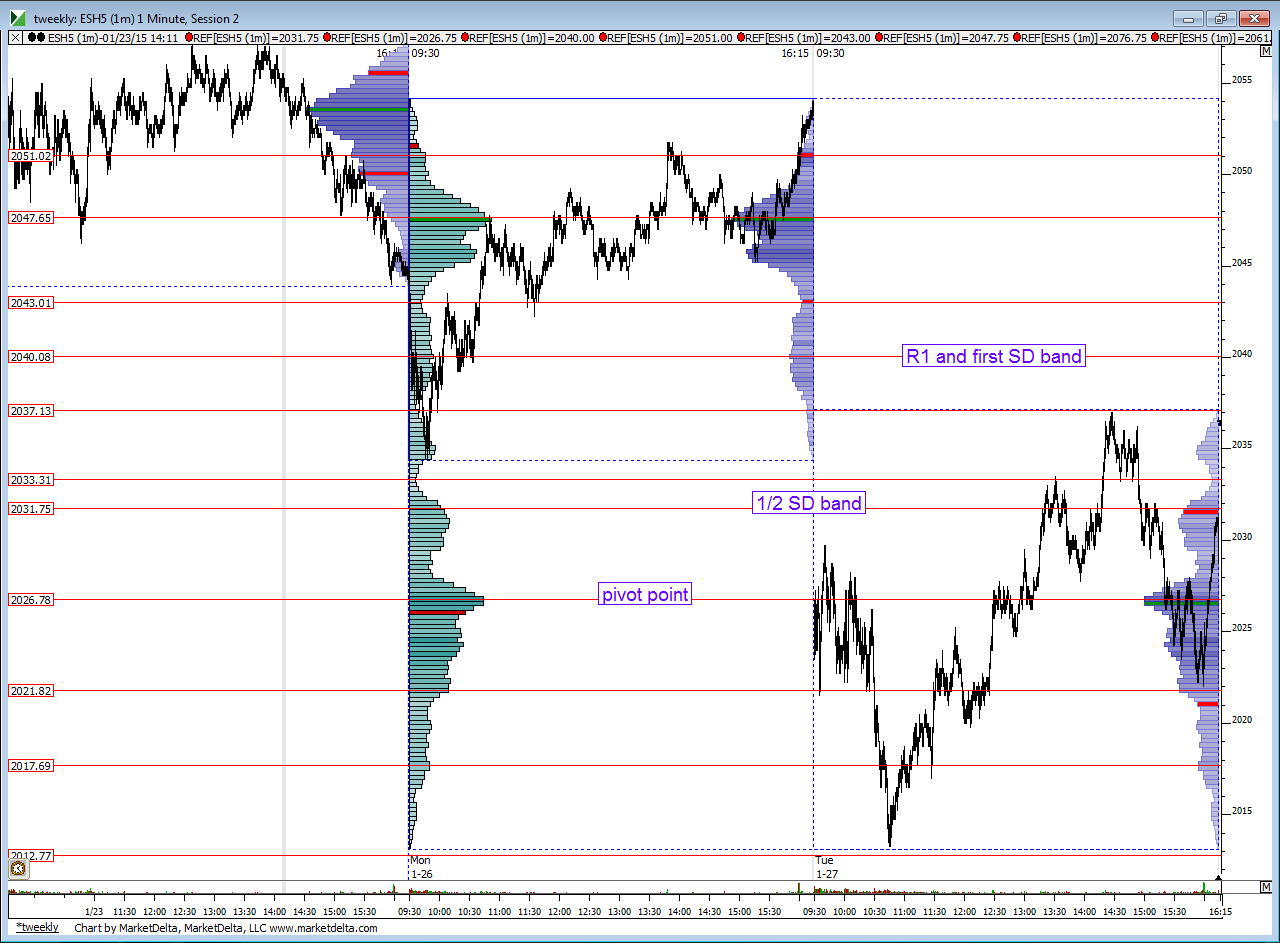
30 min VPOC @ 32.5
trying to hold this one final contract...this may be useful or useless to some...
is there a greenies video or more explaination as how to find them and trade them?
i think Bruce's last video did a good job of explaining how to trade them. his other videos in the past have shown it too.
as for finding them, they are basically untested high volume nodes. so depending on what charting software you use, you can set it up. if you are using MarketDelta, i can give you the settings so it plots it out like Bruce does.
as for finding them, they are basically untested high volume nodes. so depending on what charting software you use, you can set it up. if you are using MarketDelta, i can give you the settings so it plots it out like Bruce does.
Originally posted by daddywolf
is there a greenies video or more explaination as how to find them and trade them?
I have fin-alg market profile software.... are these greenies or HVN found on a composite profile or 1 hour Profiles? 24 hour profiles? so he takes a short at 38.50 greenie (HVN area) for test back to the 36mid or to the next HVN 26.75.. greenie area. so 26.75 would be a buy the greenie type trade?
i find them on a 30-min or 5-min chart plotting RTH (real trading hours) only.
The rest of your hypothesis is absolutely correct. obviously you want to see how the market is acting as you get close to the greenies. you have to see a slow down as bruce explained. cannot buy or sell it blindly
The rest of your hypothesis is absolutely correct. obviously you want to see how the market is acting as you get close to the greenies. you have to see a slow down as bruce explained. cannot buy or sell it blindly
Originally posted by daddywolf
I have fin-alg market profile software.... are these greenies or HVN found on a composite profile or 1 hour Profiles? 24 hour profiles? so he takes a short at 38.50 greenie (HVN area) for test back to the 36mid or to the next HVN 26.75.. greenie area. so 26.75 would be a buy the greenie type trade?
Bruce, please correct me if i am speaking incorrectly or out of turn
thanks newkid,, that helps me understand better!
the greenies are nothing more than the developing VPOC as the day moves along...so they show the VPOC shifts.....we can have volume that starts out at one spot early in the day but as the day progresses either time builds up or a big trader or group of traders step in with lots of volume....so then new greenies would get painted there.......it shows the points on the chart that brought in VOLUME.....the greenies are independent of TIME...they are not time POC's but it is possible that time can build up at certain areas and while we trade back and forth through a particular price then the volume accumulates and creates a vpoc there...
today's party just ended for me at 27.50...I was a bit slow on my exit which worked in my favor today...congrats to all who held for that pivot/poc today...
today's party just ended for me at 27.50...I was a bit slow on my exit which worked in my favor today...congrats to all who held for that pivot/poc today...
my greenies are only from each individual day...only RTH..have nothing to do with composites...it's just evolving VPOC for the day session only
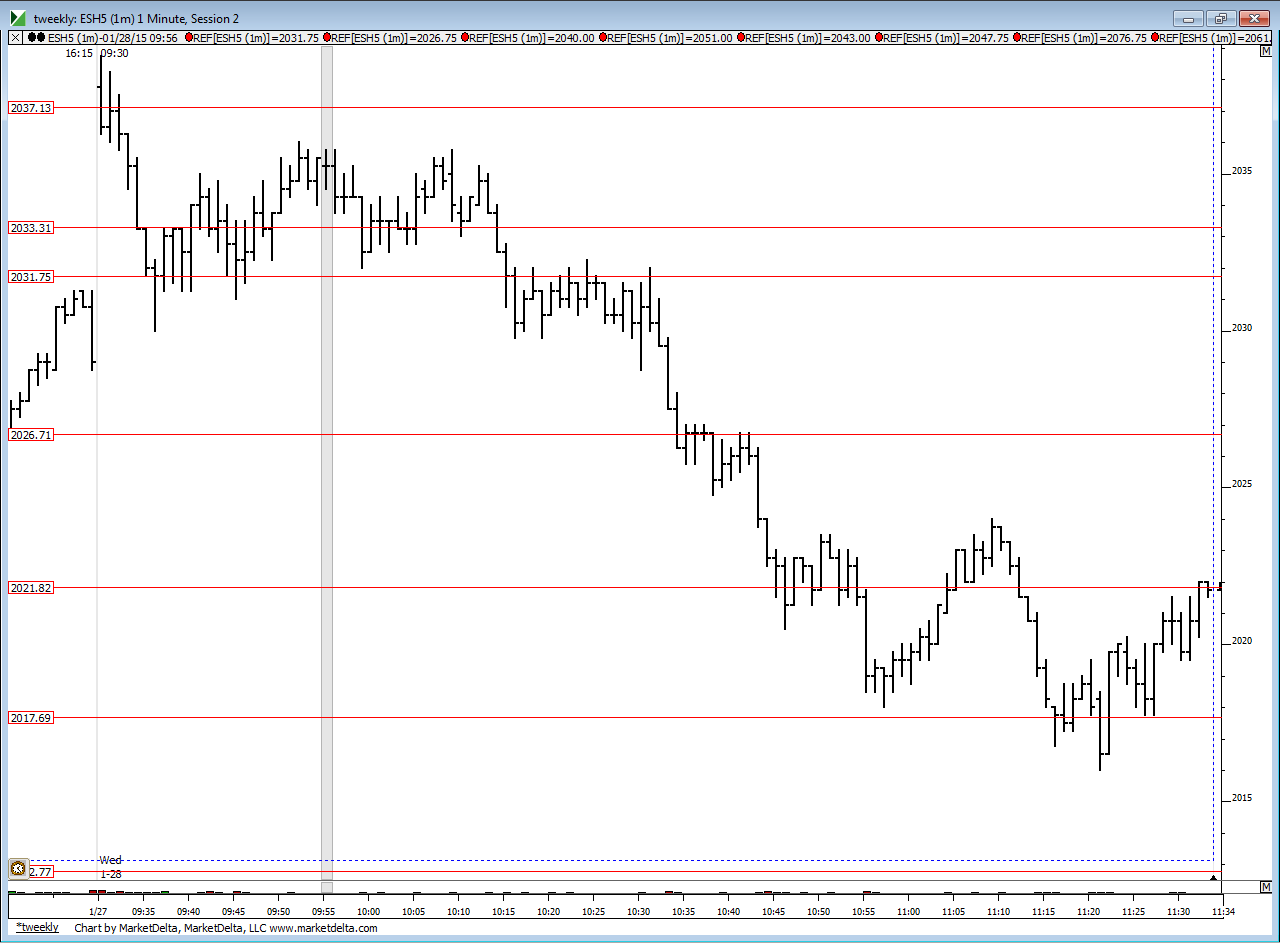
one for the road...here is how the lines are playing out so far today ...I'm posting this so some can see what happens if you take trade off the highs of low bars when u hit support ....or sell the low of that high bar at the top....remember...we buy highs of low bars when we drop down to them from above......how many tries would you take at your lines becore you get just one to run ??? Notice at the 26.71 line you never get trade above the high of any of the low bars at that line .....!!! very cool !!
Click image for original size
Emini Day Trading /
Daily Notes /
Forecast /
Economic Events /
Search /
Terms and Conditions /
Disclaimer /
Books /
Online Books /
Site Map /
Contact /
Privacy Policy /
Links /
About /
Day Trading Forum /
Investment Calculators /
Pivot Point Calculator /
Market Profile Generator /
Fibonacci Calculator /
Mailing List /
Advertise Here /
Articles /
Financial Terms /
Brokers /
Software /
Holidays /
Stock Split Calendar /
Mortgage Calculator /
Donate
Copyright © 2004-2023, MyPivots. All rights reserved.
Copyright © 2004-2023, MyPivots. All rights reserved.