ES Friday 2-13-2015
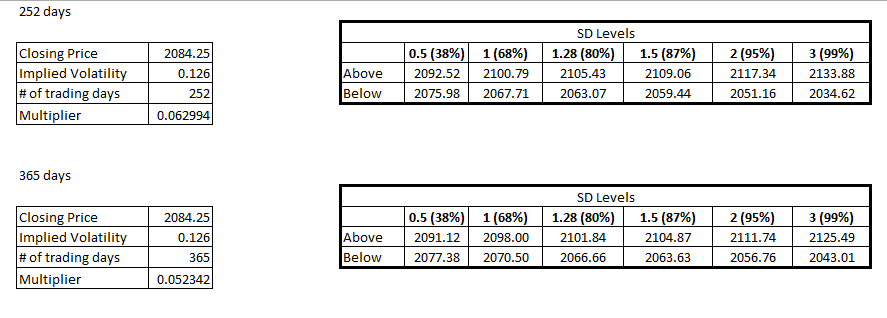
Bands for the day. The daily 0.5 band is at 91.25, weekly 1 band is at 91.75, daily R1 is at 89.5 and weekly R1 is at 90. So a lot of confluence from 90 to 92
Click image for original size
if you look at your 12-29 MP chart you will see that all they did was push out the upper edge of the bell and come back to the center...Like a good bell should..
still only one tpo print at YD highs..so MP players want that to stay as a buying tail to propel market up top r2 and beyond...us faders want them to give up on the 87.25 - 88.75 retests and roll it over to get second tpo print....it's really that simple !!
not to mention the the limited number of tpos at last week's high ! that 68 is ripe for a retest soon
now we can ask ourselves....how often to they leave only one or two tpo prints at YEARLY highs........answer is NOT often...so they may not print them there today but they could.... you can expect to see multiple tests of 88.75 in the future....the future begins NOW !!! ...I'd like to see some single prints on a push up into 94 to try one last short ( last runner stopped out) otherwise i will wait to see what happens if we can get closes below 88.75 on the 30 minute to think about a short from a different area to go get that high of YD again
good eyes apk...that becomes a natural LTN spot to us to work from and towards in the future....great !!!
Originally posted by apk781
not to mention the the limited number of tpos at last week's high ! that 68 is ripe for a retest soon
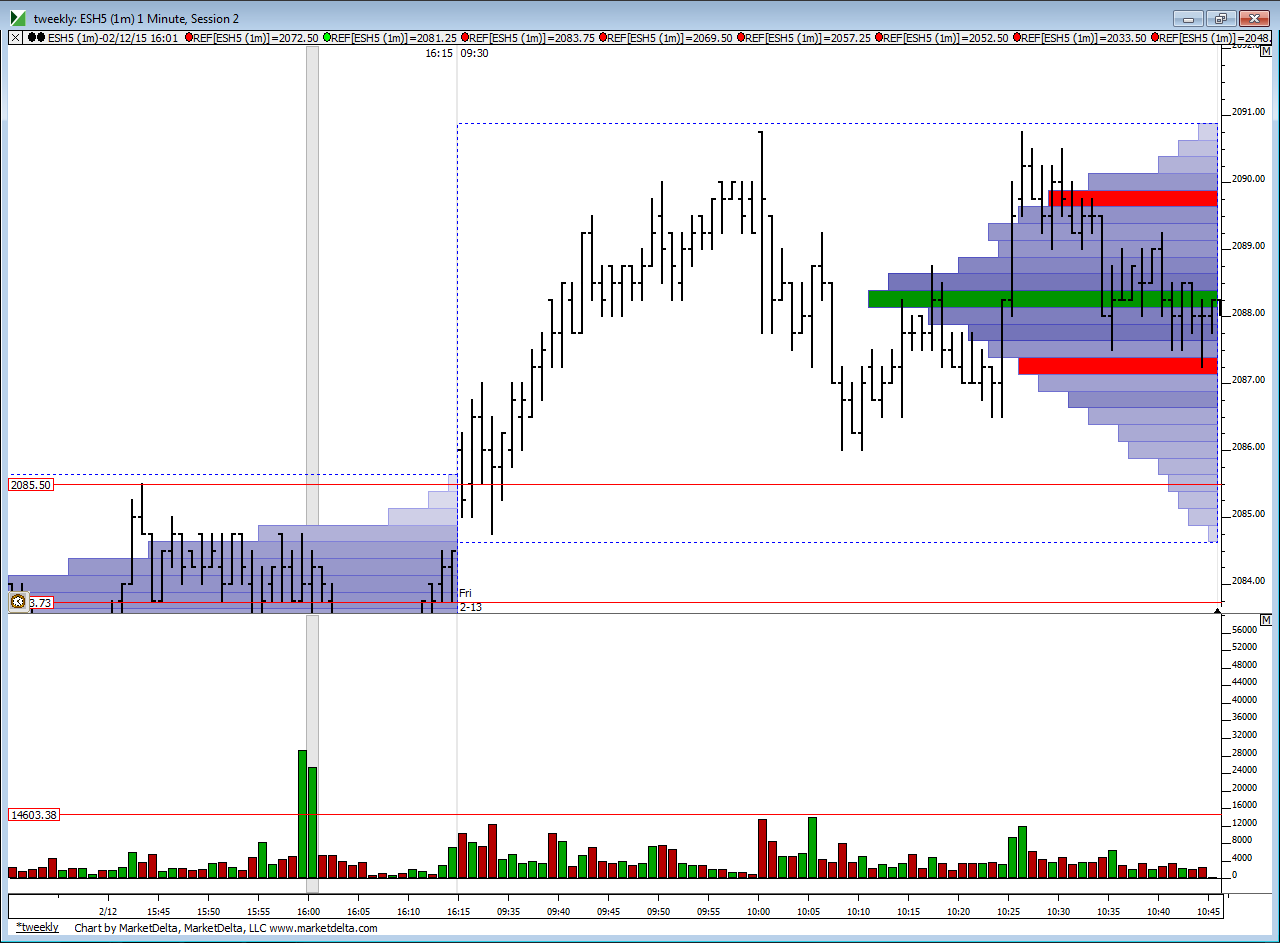
I starting from 89.25 again... and willing to battle a bit with small trys up here...using low of high bar trades.....and expecting those 88.75 retests and a battle line......perfect bell based on time so far.....so when it does really break we don't want to be on the wrong side I would think...only thing bad here is we have a double top one one minute bars seperated by a bunch of time...so we may be wrong on this one...but we know they can make poor highs and still sell off
coming out at 87.25- VA low on my chart....will try to hold last one but can't expect much with those all time highs and being stuck inside the IB range
here is how my chart looks...note the bell curve today, the low of high bar trade and the VA low...red bar on histogram at 87.25
Click image for original size
last sell for me is 90.50 today.....trying to target 88.75 and then see if I can hold again...sluggish up move but we saw ame thing YD...lately firday have met with selling...perhpas tone will change today
90.25 is an LTN now...
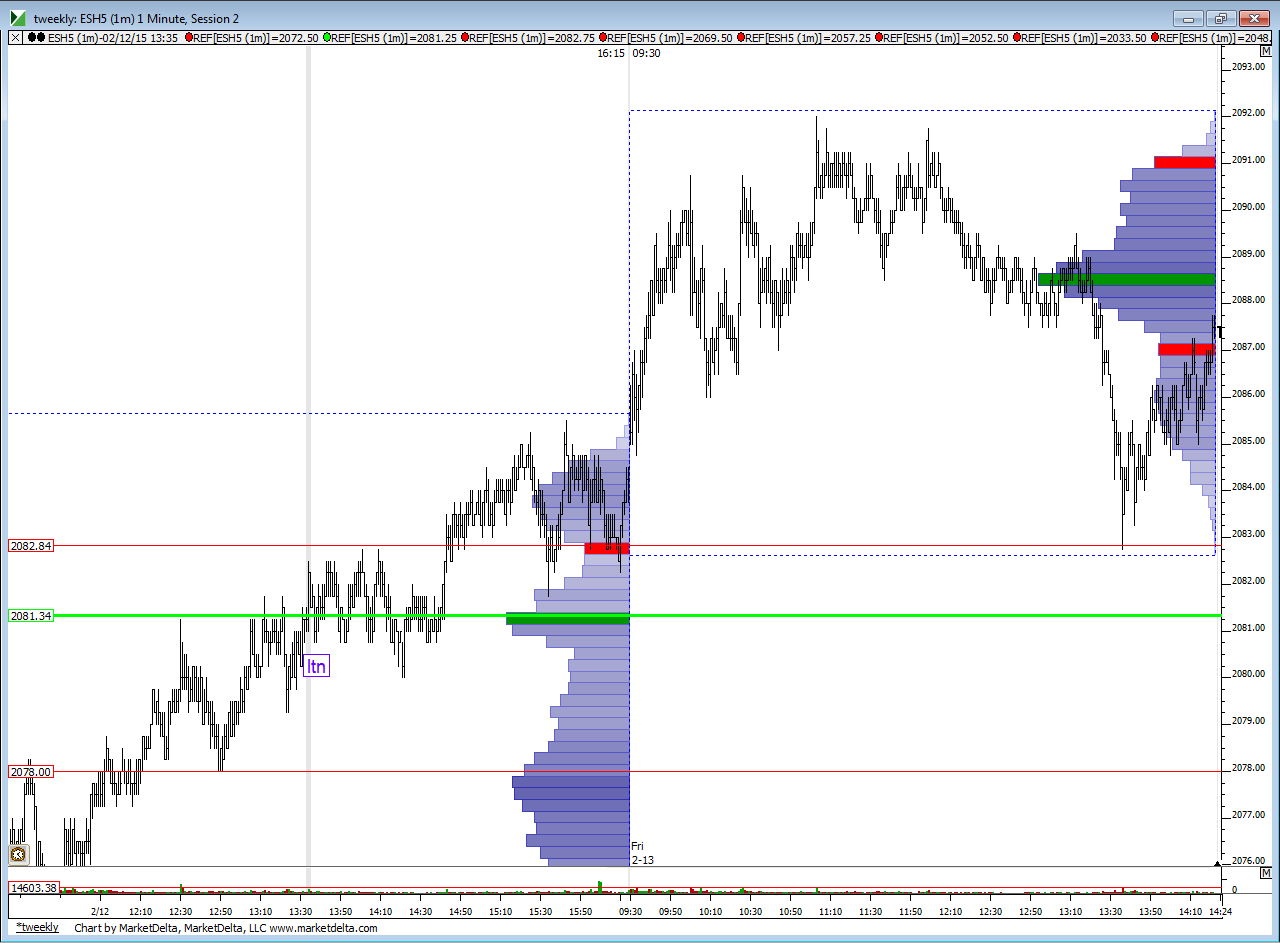
today I have patience but only on two runners at the end.......it becomes more like gambling at that point.....for those interested...82.75 was lowest time price that was in between bell curves on yesterday's RTH chart ......to confim you could have also noticed Greenies in your On chart before todays market opened..here are two pics
my "LTN" label should be up at 82.75.......so chart has it's label in the wrong spot
Click image for original size
Click image for original size
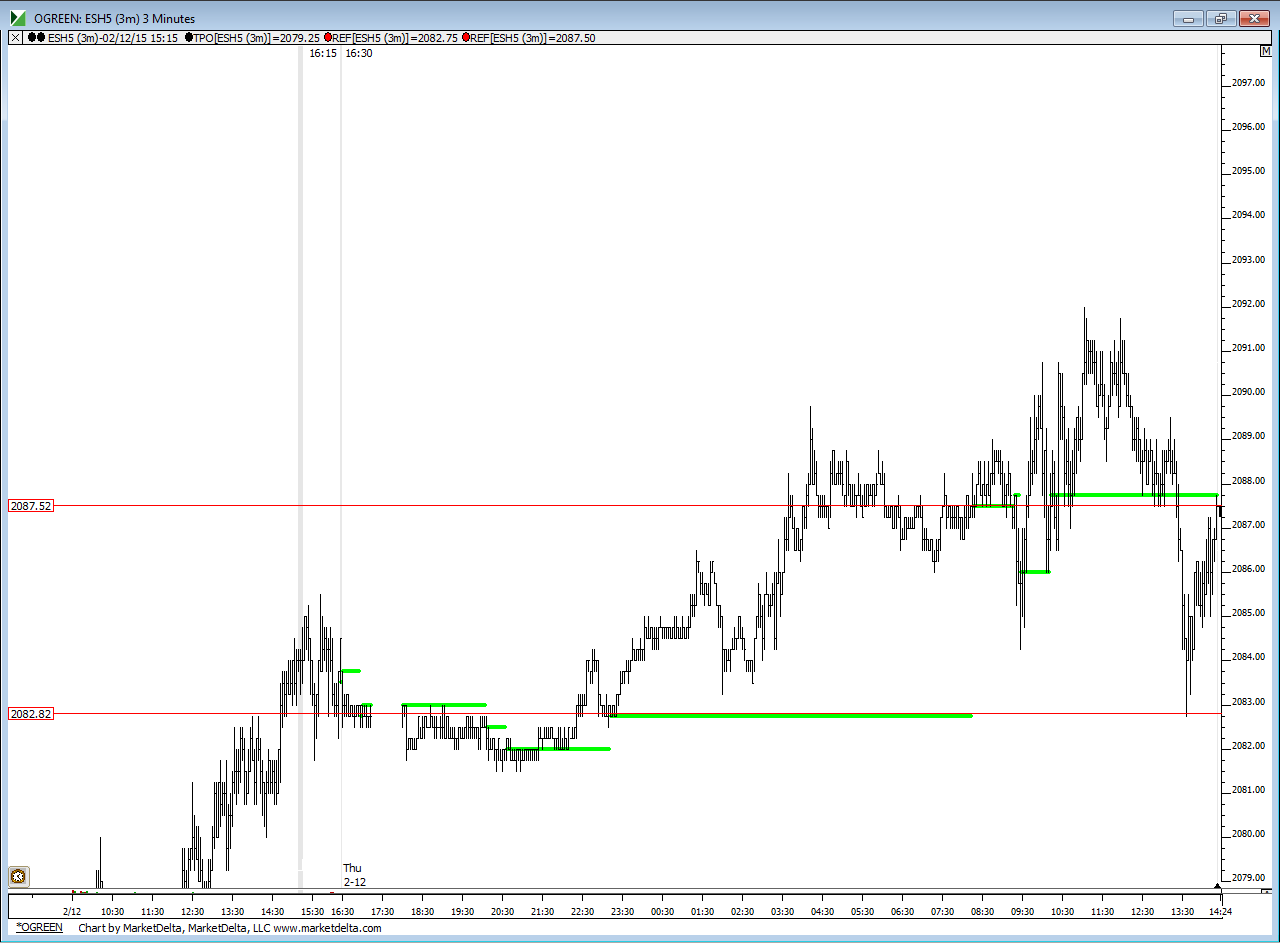
my "LTN" label should be up at 82.75.......so chart has it's label in the wrong spot
Emini Day Trading /
Daily Notes /
Forecast /
Economic Events /
Search /
Terms and Conditions /
Disclaimer /
Books /
Online Books /
Site Map /
Contact /
Privacy Policy /
Links /
About /
Day Trading Forum /
Investment Calculators /
Pivot Point Calculator /
Market Profile Generator /
Fibonacci Calculator /
Mailing List /
Advertise Here /
Articles /
Financial Terms /
Brokers /
Software /
Holidays /
Stock Split Calendar /
Mortgage Calculator /
Donate
Copyright © 2004-2023, MyPivots. All rights reserved.
Copyright © 2004-2023, MyPivots. All rights reserved.