ES Thursday 8-27-15
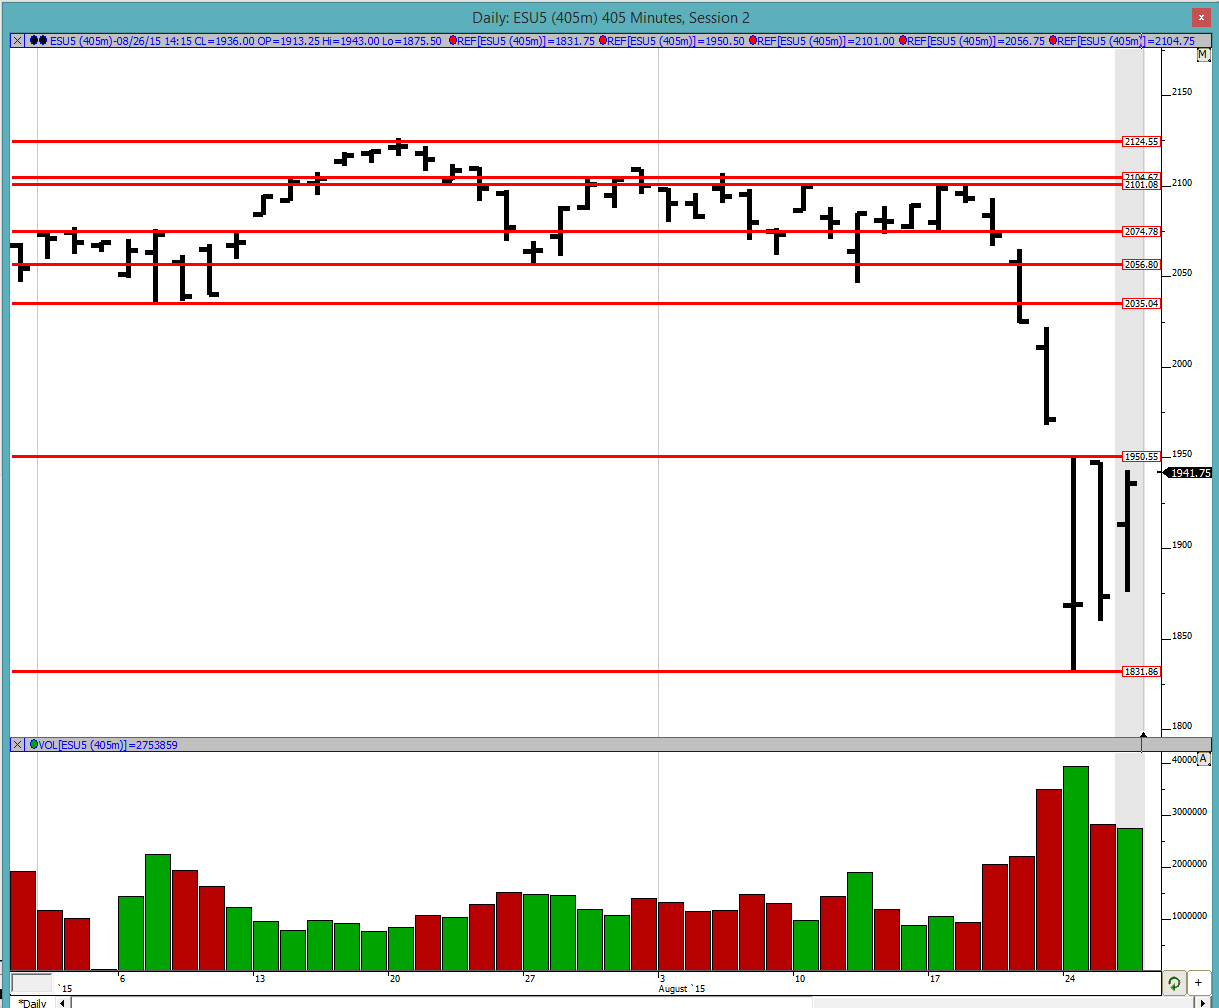
Good evening to all. I am trying to get the prep done tonight and hopefully will start doing that moving forward. As I wrote in Wednesday's page, we are now in a 3-day balance with each day within the prior day's range as can be seen in the chart below. This is a nice coiling action and should provide a likely explosive move. 1950.75 and 1831 (111.75 points range) are the extremities of this range. On Thursday 1 of 2 scenarios are likely to happen:
1) We look above 1950.75, hit the stops sitting there and explode upwards. The momentum of this move is likely going to be important. It needs to be quick and have a good feel to it for the market to keep moving up and close the gap to 1968 and get into Friday's (8/21) range.
2) We look above 1950.75 and fail with no upside continuation. If this happens then usually the destination trade is to the other side of the balance area i.e. 1831 in this case. Once we get to 1831 then either come back into balance or break downwards. IMO if we do go back to 1831, that would be fairly bearish because we would have a move down (last Thursday and Friday), consolidation this week so far and then a move downwards.
There is the Jackson Hole summit this Thursday and Friday although Yellen is not attending it. It is very likely that a lot of people are still watching it carefully and are going to hang onto every word said and dissect it to the ground. I personally do not care what is said or not said, but it is important to know that it is happening and could provide a catalyst to the market to move in either direction.
Profile:
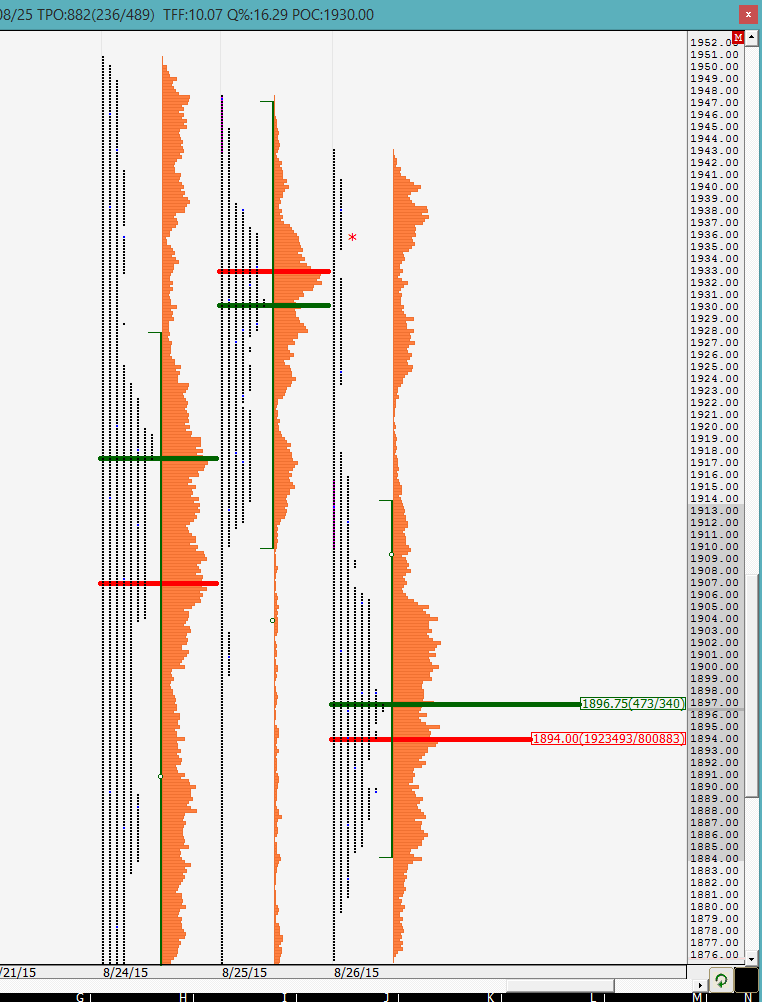
We can see in the profile that Wednesday had a triple distribution with the close in the top one. Buyers will likely be looking to defend these distributions tomorrow so look out for those single prints. Since it is not possible to read it on the chart, the singles extend from 1932.5 to 1934.5 and 1918 to 1923.25. Note how the first set of singles are at a previous greenie/VPOC of 1933. Interestingly the VPOC on Wednesday was way down at 1894 leaving that as the only untouched greenie for the day. I would have to do some research on what happens when the close is so far from the VPOC of the day and what impact it has on the next trading day. Perhaps this would be good homework for someone reading?
As mentioned earlier, today was again an inside day and has resulted in coiling action. Look out for the highs of the 3 days being taken out. There is likely to be a triggering of stops and short term traders with deep pockets could be targeting them. Also it is possible that traders have buy stops placed above it to initiate a long position looking to get back to much higher levels. Therefore this is going to be something to be watched very closely and is going to be THE trade.
Will be back in the AM to look at the O/N action.
Good luck to all.
1) We look above 1950.75, hit the stops sitting there and explode upwards. The momentum of this move is likely going to be important. It needs to be quick and have a good feel to it for the market to keep moving up and close the gap to 1968 and get into Friday's (8/21) range.
2) We look above 1950.75 and fail with no upside continuation. If this happens then usually the destination trade is to the other side of the balance area i.e. 1831 in this case. Once we get to 1831 then either come back into balance or break downwards. IMO if we do go back to 1831, that would be fairly bearish because we would have a move down (last Thursday and Friday), consolidation this week so far and then a move downwards.
There is the Jackson Hole summit this Thursday and Friday although Yellen is not attending it. It is very likely that a lot of people are still watching it carefully and are going to hang onto every word said and dissect it to the ground. I personally do not care what is said or not said, but it is important to know that it is happening and could provide a catalyst to the market to move in either direction.
Click image for original size
Profile:
We can see in the profile that Wednesday had a triple distribution with the close in the top one. Buyers will likely be looking to defend these distributions tomorrow so look out for those single prints. Since it is not possible to read it on the chart, the singles extend from 1932.5 to 1934.5 and 1918 to 1923.25. Note how the first set of singles are at a previous greenie/VPOC of 1933. Interestingly the VPOC on Wednesday was way down at 1894 leaving that as the only untouched greenie for the day. I would have to do some research on what happens when the close is so far from the VPOC of the day and what impact it has on the next trading day. Perhaps this would be good homework for someone reading?
As mentioned earlier, today was again an inside day and has resulted in coiling action. Look out for the highs of the 3 days being taken out. There is likely to be a triggering of stops and short term traders with deep pockets could be targeting them. Also it is possible that traders have buy stops placed above it to initiate a long position looking to get back to much higher levels. Therefore this is going to be something to be watched very closely and is going to be THE trade.
Click image for original size
Will be back in the AM to look at the O/N action.
Good luck to all.
yup, thats the same one i was referring to as well.
Originally posted by PAUL9
NewKid,
breakout of a 3 day balancing area pretty strong thing.
I noticed a naked VPOC from 8/21/15 at 1995.00 (IB DATA through Sierra Charts)
and I noticed same day has naked MPOC at 1995.25,
maybe they are calling to the market
duck, whats the reason for the short?
Originally posted by duck
trying to short 81.25 sttop 84.25
out on stop
short reason was 81.25rat and ema 22 and 50 cross down on 1 min chart
thanks. i dont usually track either of them so good to know. is this the sole strategy you use? how has it been performing, if you dont mind me asking?
Originally posted by duck
short reason was 81.25rat and ema 22 and 50 cross down on 1 min chart
nk the ema is a trend indicator..tells me short or long..in the trend i will use inside bars outside bars and low bar for entries. and i dont take every trade either. i try to take only 3 trades a day but will try multi times around price level..( like i should of done with 81.25) nk when using the ema there discretion to using it..i just find it a simple method and i cant over think it. i just over think the stop placement..lol the last 10 trades 4 loss 3 what i call break even trade and 3 12 point winner.you can ask me anything you want to. ya my wife has big ones..lol oh not that question..lol
take care
duck
take care
duck
lol, thanks for answering duck
Originally posted by duck
nk the ema is a trend indicator..tells me short or long..in the trend i will use inside bars outside bars and low bar for entries. and i dont take every trade either. i try to take only 3 trades a day but will try multi times around price level..( like i should of done with 81.25) nk when using the ema there discretion to using it..i just find it a simple method and i cant over think it. i just over think the stop placement..lol the last 10 trades 4 loss 3 what i call break even trade and 3 12 point winner.you can ask me anything you want to. ya my wife has big ones..lol oh not that question..lol
take care
duck
after watching the afternoon action from 2pm ET onward, I was going to come onto the page and ask where can I buy more tickets for the roller coaster ride,
but lo and behold, duck, posts educational instructions, leads you by the nose right into a head slammer, you can ask me anything you want to.
OMG, I am laughing so hard right.
Thank You, DUCK... just the kind of comic relief I needed after a day like today.
but lo and behold, duck, posts educational instructions, leads you by the nose right into a head slammer, you can ask me anything you want to.
OMG, I am laughing so hard right.
Thank You, DUCK... just the kind of comic relief I needed after a day like today.
Originally posted by duck
nk the ema is a trend indicator..tells me short or long..in the trend i will use inside bars outside bars and low bar for entries. and i dont take every trade either. i try to take only 3 trades a day but will try multi times around price level..( like i should of done with 81.25) nk when using the ema there discretion to using it..i just find it a simple method and i cant over think it. i just over think the stop placement..lol the last 10 trades 4 loss 3 what i call break even trade and 3 12 point winner.you can ask me anything you want to. ya my wife has big ones..lol oh not that question..lol
take care
duck
Seems like it would be great for scalping 1,5-2 pts as well.
With a setup like that, my view of what I would like to see this afternoon is short below 1M candles @ 1:33/1:39/1:46/1:53/2:02/2:10 All good for over 1.5 with minimal heat.
Have you traded it that way too?
the 1:33 1:39 bar the ema are still cross up..1:46 bar ema just cross down..i like to give it some time before shorting..the 2:02 &2:10 ema cross up..the 2:15 outside bar should of been my 2nd try at shorting it..but i didnt..
Mike i do see the trades you point out..as i said to nk there is discretion meaning there lots of ways to using the ema..for me i fine they point out the trend pretty easy..long or short..i seem to enter the trade ok just have hard time with stop placement..
what kind of stop would u use ?
take care
duck
I should have clarified; Chicago time.
The stops are above the prior bar, don't want a new high.
I like your engulfing OVB filter as well. would also like to see the trend establish for 12-15 minutes before a trade too.
The stops are above the prior bar, don't want a new high.
I like your engulfing OVB filter as well. would also like to see the trend establish for 12-15 minutes before a trade too.
Originally posted by duck
the 1:33 1:39 bar the ema are still cross up..1:46 bar ema just cross down..i like to give it some time before shorting..the 2:02 &2:10 ema cross up..the 2:15 outside bar should of been my 2nd try at shorting it..but i didnt..
Mike i do see the trades you point out..as i said to nk there is discretion meaning there lots of ways to using the ema..for me i fine they point out the trend pretty easy..long or short..i seem to enter the trade ok just have hard time with stop placement..
what kind of stop would u use ?
take care
duck
Emini Day Trading /
Daily Notes /
Forecast /
Economic Events /
Search /
Terms and Conditions /
Disclaimer /
Books /
Online Books /
Site Map /
Contact /
Privacy Policy /
Links /
About /
Day Trading Forum /
Investment Calculators /
Pivot Point Calculator /
Market Profile Generator /
Fibonacci Calculator /
Mailing List /
Advertise Here /
Articles /
Financial Terms /
Brokers /
Software /
Holidays /
Stock Split Calendar /
Mortgage Calculator /
Donate
Copyright © 2004-2023, MyPivots. All rights reserved.
Copyright © 2004-2023, MyPivots. All rights reserved.