Pitbull Three Strategy
Here is a strategy which I did not originate. Perhaps some of you have seen or heard about various forms of this. It was taught to me by a self proclaimed “old Timer” who I happened to meet about 5-7 years ago in a commodity site chat room. This was before Paltalk and Hotcomm was popular. I present it here mostly as it was taught to me for free. I “watched” him trade this for about 9 months in real time. It was designed for the big S&P contract so I have modified it slightly for the emini. The man who taught this was gruff, sometimes abusive ( especially when the future vendor Kingfish came in the room) but always answered questions…
Originally I thought he was going to turn out like the Army Sargent played by Lou Gosset Jr. in “Officer and a gentleman” but this mentor just disappeared and I never found him again. Perhaps he started his own service and markets this but I haven’t seen it. His idea on stops was the following….”You can either take the loss and try again or trade your way out”. He always tried to trade his way out and would sometimes lose on trend days… as it is a counter – trend strategy……a few other things….he would call in for the official opening range…( it is not the one minute high or low as some think but we can use that for exits)..I am using the opening price on the emini to set the levels . He would trade up to 50 contracts if he needed to so he was at times adding to a “losing trade” as some might say……he always took a 1.5 point profit target…….he didn’t alter this….I’ll think of other things as we go. He also thought that if the rumors where true and the floor traders where moving to screen trading then this strategy would become less effective…….it is only traded in the first hour and he only broke this rule if he was trying to “trade out”…..keep in mind this was designed when volatility was higher and 5 minute bar could have a range of 5 points…unlike today's markets……I think the levels are most important and although I don’t snap them on my own personal charts I have them written down on paper after the opening….He believed that at 10:30 EST you should close your business up and end for the day…unless he was trying to recover... ok enough of the history
ok first we take the opening price and add and subtract the following numbers
The strategy tends to capitalize on the floors ability to push the market in one direction to sucker in the public for it to then only snap back towards the opening range…I have noticed that it works best when the market is pushed to an extreme of either an overnight high or low or the previous days high or low…so we can relate this to an “open-test-reject” as per Market profile concepts……
+- 2.5
+- 4.0
+-5.5
+-8.0
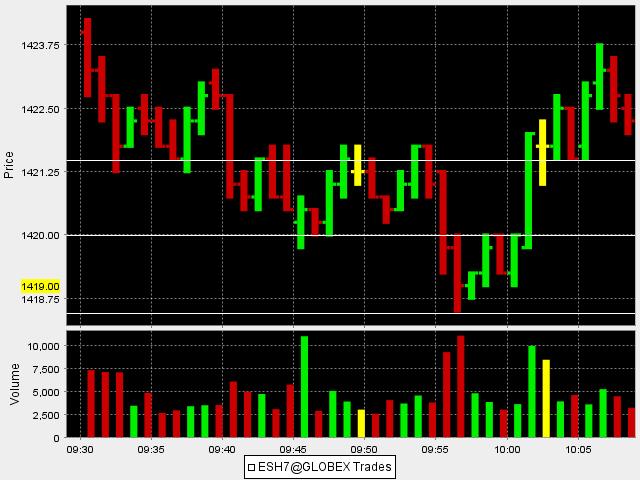
This sets up our WINDOW of trade entry points….For today Friday January 5th I have the opening price at 1424 so the downside numbers would be 1421.50, 1420, 1418.50 and 1416..and here are the rules.
1) If we open and drop down to the minus 2.5 number then rally to the open you buy
2) If we open and drop down to the minus 4 you then buy at the minus 2.5 on the way back up
3) If we drop down to the minus 5.5 you buy the minus 4 number
4) If we drop to the minus 8 you buy the minus 5.5
This is all reversed for the upside.
Anything beyond a plus or minus 8 meant the market was too risky too initiate from down or up from the opening so he avoided it…in general he believed that the further out into the WINDOW you went then the riskier it became…so buying a minus 2.5 after a hit on minus 4 is a safer trade then buying a minus 4 number after a minus 5.5…He didn’t use stops but his target was always 1.5 off the window number ..not your fill price...
You would stop trading if the markets dropped 2.5 points below the opening and then traded 2.5 above the opening…..this would be called a COMPLETED WINDOW RUN and the floor was done doing it’s business…you would be finished also…just one or two good trades a day……for now think about how you can incorporate the Pitbull One and II thread ideas into this……did you see the singles band with the first and second one minute bar today
The Market opens at 1424 and drops down to slightly below the minus 2.5 number at 1421.50…since we didn’t trade back to the opening at 1424 there is no long trade…..The market then drops further and goes to the minus 4 number at 1420 so we are a buyer at 1421.50……which is the minus 2.5…If you use stops then this trade would not have hit 1.5 points of profit and you lose if you are using stops….The market drops further to the minus 5.5 number to the tick at 1418.50..so you are a buyer at the minus 4 which is 1420….this achieves it’s target and rallies up to test the band..see pitbull thread II at the first and second one minute bars…not shown on this chart. ok...this is a lot so I will work on trying to clarify what needs to be clear…the second long was better because we had Tick divergence to support the trade…may seem complicated but it’s not..I’ll highlight the important stuff…..and ask questions...it helps me too to get this stuff in words
Bruce
Originally I thought he was going to turn out like the Army Sargent played by Lou Gosset Jr. in “Officer and a gentleman” but this mentor just disappeared and I never found him again. Perhaps he started his own service and markets this but I haven’t seen it. His idea on stops was the following….”You can either take the loss and try again or trade your way out”. He always tried to trade his way out and would sometimes lose on trend days… as it is a counter – trend strategy……a few other things….he would call in for the official opening range…( it is not the one minute high or low as some think but we can use that for exits)..I am using the opening price on the emini to set the levels . He would trade up to 50 contracts if he needed to so he was at times adding to a “losing trade” as some might say……he always took a 1.5 point profit target…….he didn’t alter this….I’ll think of other things as we go. He also thought that if the rumors where true and the floor traders where moving to screen trading then this strategy would become less effective…….it is only traded in the first hour and he only broke this rule if he was trying to “trade out”…..keep in mind this was designed when volatility was higher and 5 minute bar could have a range of 5 points…unlike today's markets……I think the levels are most important and although I don’t snap them on my own personal charts I have them written down on paper after the opening….He believed that at 10:30 EST you should close your business up and end for the day…unless he was trying to recover... ok enough of the history
Click image for original size
ok first we take the opening price and add and subtract the following numbers
The strategy tends to capitalize on the floors ability to push the market in one direction to sucker in the public for it to then only snap back towards the opening range…I have noticed that it works best when the market is pushed to an extreme of either an overnight high or low or the previous days high or low…so we can relate this to an “open-test-reject” as per Market profile concepts……
+- 2.5
+- 4.0
+-5.5
+-8.0
This sets up our WINDOW of trade entry points….For today Friday January 5th I have the opening price at 1424 so the downside numbers would be 1421.50, 1420, 1418.50 and 1416..and here are the rules.
1) If we open and drop down to the minus 2.5 number then rally to the open you buy
2) If we open and drop down to the minus 4 you then buy at the minus 2.5 on the way back up
3) If we drop down to the minus 5.5 you buy the minus 4 number
4) If we drop to the minus 8 you buy the minus 5.5
This is all reversed for the upside.
Anything beyond a plus or minus 8 meant the market was too risky too initiate from down or up from the opening so he avoided it…in general he believed that the further out into the WINDOW you went then the riskier it became…so buying a minus 2.5 after a hit on minus 4 is a safer trade then buying a minus 4 number after a minus 5.5…He didn’t use stops but his target was always 1.5 off the window number ..not your fill price...
You would stop trading if the markets dropped 2.5 points below the opening and then traded 2.5 above the opening…..this would be called a COMPLETED WINDOW RUN and the floor was done doing it’s business…you would be finished also…just one or two good trades a day……for now think about how you can incorporate the Pitbull One and II thread ideas into this……did you see the singles band with the first and second one minute bar today
The Market opens at 1424 and drops down to slightly below the minus 2.5 number at 1421.50…since we didn’t trade back to the opening at 1424 there is no long trade…..The market then drops further and goes to the minus 4 number at 1420 so we are a buyer at 1421.50……which is the minus 2.5…If you use stops then this trade would not have hit 1.5 points of profit and you lose if you are using stops….The market drops further to the minus 5.5 number to the tick at 1418.50..so you are a buyer at the minus 4 which is 1420….this achieves it’s target and rallies up to test the band..see pitbull thread II at the first and second one minute bars…not shown on this chart. ok...this is a lot so I will work on trying to clarify what needs to be clear…the second long was better because we had Tick divergence to support the trade…may seem complicated but it’s not..I’ll highlight the important stuff…..and ask questions...it helps me too to get this stuff in words
Bruce
I would agree that the "open" is 9:30, that's when the large majority of stocks open up in the US. So, if I was to base a strategy on the open, I would use 9:30.
I think it is important to know what happens overnight, but I do not think we live in a true 24 hour trading world, at least as it applies to US equities and their deriviatives. There is very little volume overnight, and even the European indices experience their highest volume at the opening of US trading hours.
I suppose these times could move eventually, but I think for now the open is 9:30 AM EST for stocks. The only thing that I add to that is if there is a big number at 8:30, you need to be aware of how that moves the futures....but, a lot of times this is just a whipsaw and the market goes back to where it would have been anyway.
I recieved an email yesterday regarding this and thought today provided an appropriate example.
( I'm on baby sitting duty so my chart is even more crude than usual..)
here is part of my email response
"it still works and thanks for showing the interest.....the challenge with it is that you need to realize when volatility is changing......currently I look at the ZONES more than taking the actaly signals....
the key zones based off the open print will be plus and minus
4 - 5.5 points
8-10 points
and 16 - 20 points
I believe it's a function of those who enter orders on the open and say " I'm gonna buy ( or sell) the open and take profit at key numbers off that open print......they'll risk 5 points off the open print to get 5 points or they'll risk 10 points to get the 8 - 10 range...":
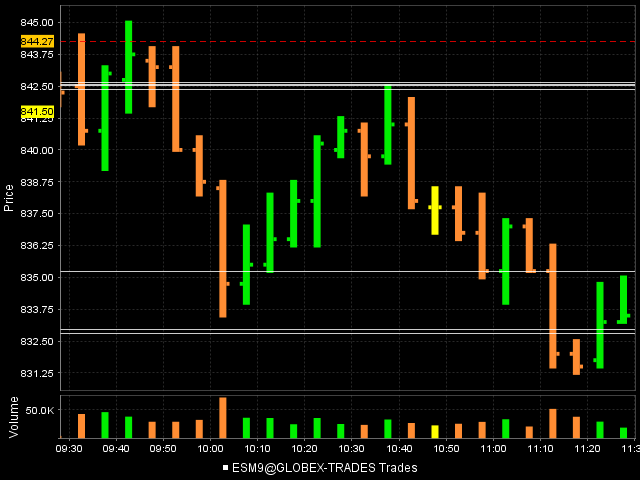
Ok so here we are on thursday with an open print of 842.50.....so we know a few things right away.......a good long will go after the overnight high which was the VA low near 846 - 847...Where is the plus 4 - 5.5 number come in ? 846.50 - 848..
Okay we know if we get a short signal then we have the previous close ( 836), previous days low and the overnight low ( 833)to try and target...open of 842.50 minus 10 is 832.50 so the overnight and previous days low are also in the "window"...we also know that after the numbers hit with the proper signal they will try and get it back to the open print....as per my original posts on this methodology
so today the numbers fell at some good targets
the minus 4 - 5.5 is near the close, the 8-10 is near the overnight low etc..you can do the simple math
...I'm not commenting on what trades I did or didnot take...I'm merely presenting this example and hopefully some can find it useful to put in their "Toolbox"
Here is the crude chart...thick lines are the open print,
single line is yesterdays low...double white is overnight low...
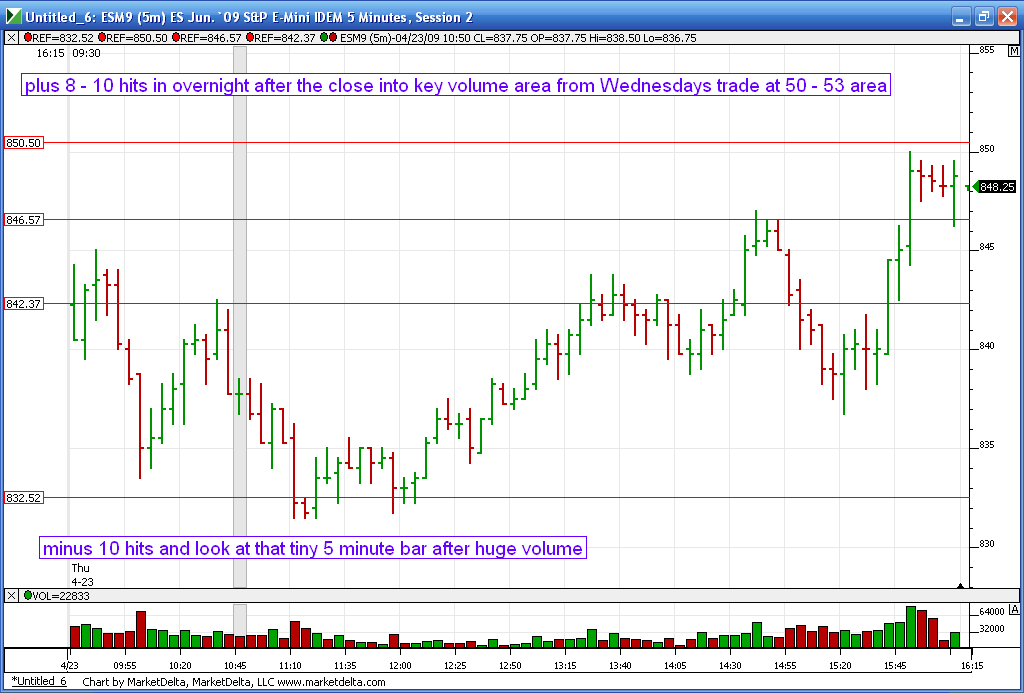
Also look how the range of the bars dry up after hitting the overnight low on big volume....
as I type it is not too late for them to try and run it to the plus 4- 5.5 which is the VA low from Wednesday....the 8- 10 range if hit today gets it to the key volume zone from yesterday ( POC) in MP terms up at the 50 - 53 area..In general I like the window fades in early trade and targets work good throughout the day
( I'm on baby sitting duty so my chart is even more crude than usual..)
here is part of my email response
"it still works and thanks for showing the interest.....the challenge with it is that you need to realize when volatility is changing......currently I look at the ZONES more than taking the actaly signals....
the key zones based off the open print will be plus and minus
4 - 5.5 points
8-10 points
and 16 - 20 points
I believe it's a function of those who enter orders on the open and say " I'm gonna buy ( or sell) the open and take profit at key numbers off that open print......they'll risk 5 points off the open print to get 5 points or they'll risk 10 points to get the 8 - 10 range...":
Ok so here we are on thursday with an open print of 842.50.....so we know a few things right away.......a good long will go after the overnight high which was the VA low near 846 - 847...Where is the plus 4 - 5.5 number come in ? 846.50 - 848..
Okay we know if we get a short signal then we have the previous close ( 836), previous days low and the overnight low ( 833)to try and target...open of 842.50 minus 10 is 832.50 so the overnight and previous days low are also in the "window"...we also know that after the numbers hit with the proper signal they will try and get it back to the open print....as per my original posts on this methodology
so today the numbers fell at some good targets
the minus 4 - 5.5 is near the close, the 8-10 is near the overnight low etc..you can do the simple math
...I'm not commenting on what trades I did or didnot take...I'm merely presenting this example and hopefully some can find it useful to put in their "Toolbox"
Here is the crude chart...thick lines are the open print,
single line is yesterdays low...double white is overnight low...
Also look how the range of the bars dry up after hitting the overnight low on big volume....
as I type it is not too late for them to try and run it to the plus 4- 5.5 which is the VA low from Wednesday....the 8- 10 range if hit today gets it to the key volume zone from yesterday ( POC) in MP terms up at the 50 - 53 area..In general I like the window fades in early trade and targets work good throughout the day
Click image for original size
as I type the plus 4 at 46.50 just printed...how cool is that.......? I'll post a chart for reference later
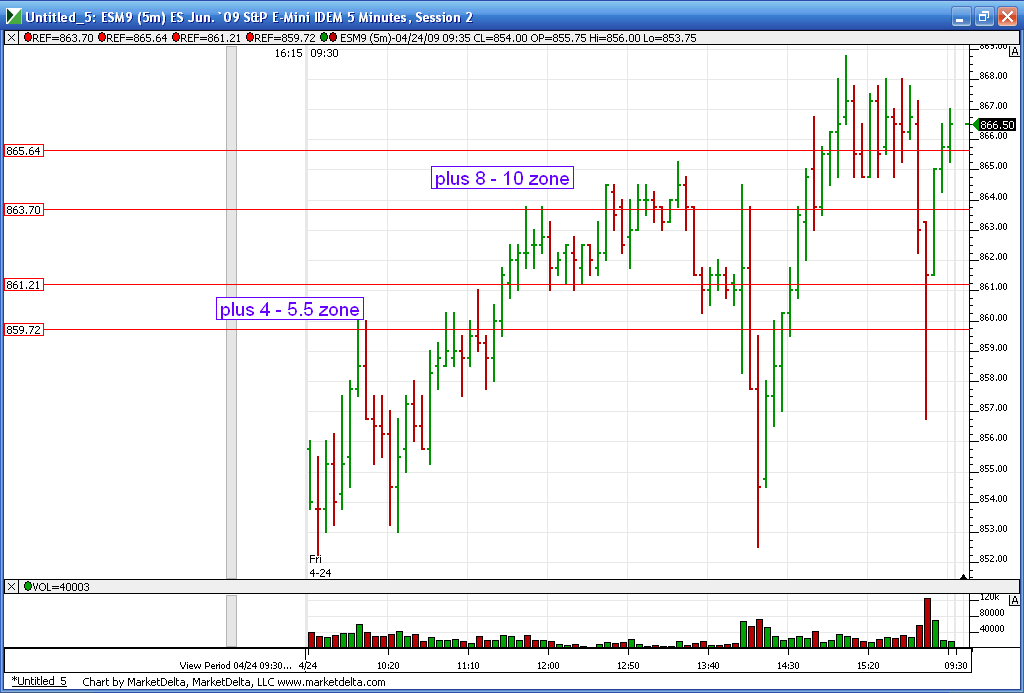
here is the follow up chart for reference.....For those who follow MP , we know that we traded on both sides of the IB so we know what to expect from there. Those who lack discipline could learn a lot from MP's structure...
Click image for original size
here's yesterday..this will end this thread for me unless there are questions
Click image for original size
Bruce,to summarize can we say that Previous Day Low/High, overnight high/low & POC/VAH/VAL are the confluence of numbers to be looked at in the 4.5-5, 8-10 and 16-20 point range?? The closer they are to the open the higher is the probability that the market will go to test them before forming a trend. Also do you consider any other numbers like daily/ weekly pivot point etc. Another question is that how do you qualify a reverse bounce. Do you use MA's or range of reversal bars etc etc. What do we look for once the market enters the 4.5-5/8-10/16-20 area to make a reverse entry.
Yes ahk1 you want some form of confluence......the first trade is usually the best, in Fridays chart you can see the market trade below the low of the highest ( i've mentioned this concept to you before so here is an example) 5 minute bar once we entered the plus 4 - 5.5 zone.......so if price action is your thing that that is a good trade entry....you simply want to see price get below the lows of the highest vertical bars on your chart....you may also want evaluate the days relative volume and if it is low then the odds favor the back and fill process we want to see in order for price to return to the open print.
It's important to watch how close we open to a previous days high or low and an overnight high and low.....the best fades usually come after they run out those stops.....In early trade I like the fades but as the day progresses I believe the numbers work better as targets in general.
You know I like $tick, volume spikes and market divergences so those are always critical to me for later day fades
Losing trades have taught me to be very careful of buying into the minus numbers if we have opened very close to overnight highs and sell off immediately....
More later...it's late here
First, let me say I love your analyis and mindset when reading the market! It all makes so much sense to me. So many people use a Opening Breakout Strategy, and this is the exact opposite of that. But are you no longer using the numbers and methods you described on page 1 of this thread?
+-2.5
+-4
+-5.5
+-8
With instructions:
1) If we open and drop down to the minus 2.5 number then rally to the open you buy
2) If we open and drop down to the minus 4 you then buy at the minus 2.5 on the way back up
3) If we drop down to the minus 5.5 you buy the minus 4 number
4) If we drop to the minus 8 you buy the minus 5.5
(The above was on your post of 1/5/2007, but I don't know how to make it look like your quote like I see on other posts in here)
The reason why I ask, is I have been backtesting this and using it realtime on a simulator for a few weeks now and it looks pretty good.
On Friday, open was 855.50; dropped a little below -2.5 number of 853, so buy 855.50 and get +1.5 profit at 857.
And on Thursday, open 842.50, starts up but doesn't hit 2.5 and goes down to just below -2.5 number of 840, so buy at 842.50 and hit target +1.5 at 844.
And on Wednesday,open 838.25, starts down, but doesn't hit 2.5; goes up to +4 of 842.25; so sell +2.5 number of 840.75 and hit target of +1.5 at 839.25.
Etc, etc. But you are not still using these numbers and following those rules? Is there something I am overlooking or misunderstanding?
Thanks Bruce for the detailed explanation. One problem that I have using the confluence of numbers is that whether Previous day close has any significance to being a potential reversal point if it falls within the 4.5-20 point range from the open.
These days I prefer to enter at the key zones instead of waiting for the actual signals to fire off. It just works better for me.I prefer to watch what is happening with the range of the bars, volume spikes ( and volume)and the $tick. You can see how the $tick is trading relative to any levels that are generated from the previous days afternoon. In other words I watch the level to see if the $tick is diverging in early trade. So on a gap up I'll compare the $tick level from the previous afternoon session etc...
Another thing that I watch is the longer term view of the market profile. For example, I know we are close to the upper end of a consolidation period...so on a gap higher on Monday I would not take long signals from this Pitbull method.
These following questions are critical to me and will help me filter the fade trades.
1) How close are we opening to an overnight high or low?
2) How close are we opening to a previous days high or low?
The best short fade trades will take place after we run out an overnight high or a previous days high on a low volume open. This increases the odds that buying interest may not be in the market. It takes volume usually to sustain a move above either and if the volume isn't there they will return it back to the overnight or previous days range. This gives me a chance to tighten the stop and get runners covered. Look at Fridays early action ...especially the overnight session high.....compare the first 5 minutes of volume and the first 15 minutes of volume.......it was lower than Thursdays so that was my first clue.....the $tick wasn't higher then Thursdys PM highs.... a great combination for short fades.
I'm also watching how fast we move off the open...if we open near an overnight high and sell off immediately on good volume then there is a very strong likelyhood that long trades will fail or struggle..more later....
Originally posted by BruceM
big mike...is this one of bitmans ideas u r using on weeklies
http://community.livevol.com/index.php/articles.html/_/options-trading/spx-weekly-credit-spread-strategy-r3205
Yes it is.
Emini Day Trading /
Daily Notes /
Forecast /
Economic Events /
Search /
Terms and Conditions /
Disclaimer /
Books /
Online Books /
Site Map /
Contact /
Privacy Policy /
Links /
About /
Day Trading Forum /
Investment Calculators /
Pivot Point Calculator /
Market Profile Generator /
Fibonacci Calculator /
Mailing List /
Advertise Here /
Articles /
Financial Terms /
Brokers /
Software /
Holidays /
Stock Split Calendar /
Mortgage Calculator /
Donate
Copyright © 2004-2023, MyPivots. All rights reserved.
Copyright © 2004-2023, MyPivots. All rights reserved.