CONFUSION OVER PROJECTIONS!
I think ive found one source of confusion over price projections. my method is well known ,but i think ,as i have stated before, that Vowaters 3 point(a-b-c-) fib extention projections might even be more accurate! lets look at an example. the math is the same ,but instead of adding or subtracting from th start of the move , Vo's program seems to add or subtract from the c point retracement, if i understand it ! for example: this may be even more accurate! observe this chart....
LONG AGO I POSTED THAT I THOUGHT Vo water and P.T. WERE TAKING MY WORK TO THE NEXT LEVEL AND THIS IS AN EXAMPLE OF WHAT I MEAN! GREAT JOB GUYS! Hope this clears up some of the confusion!
i forgot to label it but the C point appears to be 866.75 and 866.75- 4= 862.75 . note that i missed by 3 ticks! usually our projections have us looking to the same general area cause the retracements are usually somewhat close to the 'start points' follow?
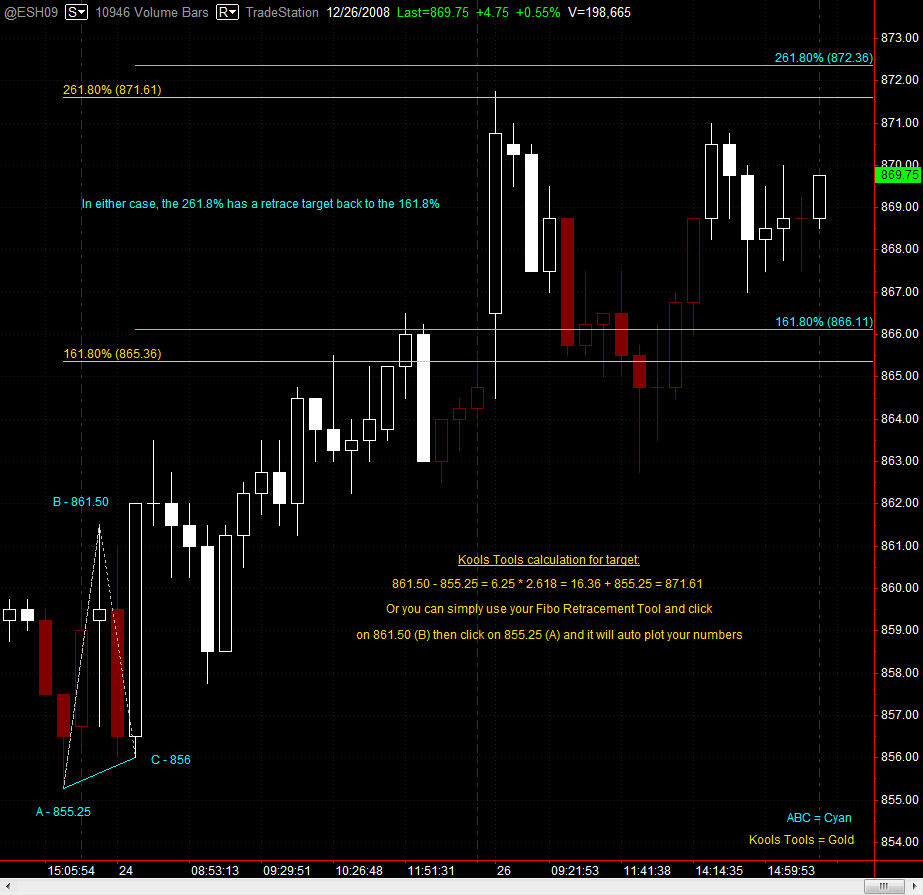
Not so fast chief! Here is an example where Kools Tools had a target of 871.50 and the ABC targeted 872.25 (rounded to the nearest .25). Actual price had high of 871.75. When were looking at an instrument that is priced in the upper 800's, I'm not to concerned if the the targets are off by .25 - .75. For some perpective that is +/- .0006%! I would say that is acceptable.
Click image for original size
True, friend , most projections the difference is so minor as to not be of much concern. Certainly a well placed stop would more than compensate for the difference. If nothing else, it gives one a well defined range with which to institute an entry or exit.
Been looking over the "tools" all weekend-quite an eyeopener. I have always been taught to use the fib projections like VO does ie applying them to a 1-2-3 pattern but I still need some clarification for Kool's rules for his projections. You have referred to a 20% retracement into the low/high candle. Just so I understand then, if you have an obvious low candle and the next candle takes out the high of the low candle and does retrace 20% or more-in that circumstance does Kool just use the difference between the low and high of that low bar? What if you get a series of higher candles that do not retrace 20% until, say the 3rd candle to the right of the low candle? In that case would you take the difference between the low of the low bar and the high of the first candle that makes the 20%+ retrace? In VO's example above it looks like the candle to the right of the lowest low retraces at least 50% of the body of the low candle so I thought Kools projection would just use the range of that low candle, but VO is using the low of the lowest candle and the high of the second candle(not quite a doji @ 861.50.0 Would appreciate some simple rules on this price projection thingy. Thanks.
one other question. For a newbie starting this technique what would you recommend as the best chart combination for day trading using Kool tools? 5min/1min or 15min//1min? thanks.
Click image for original size
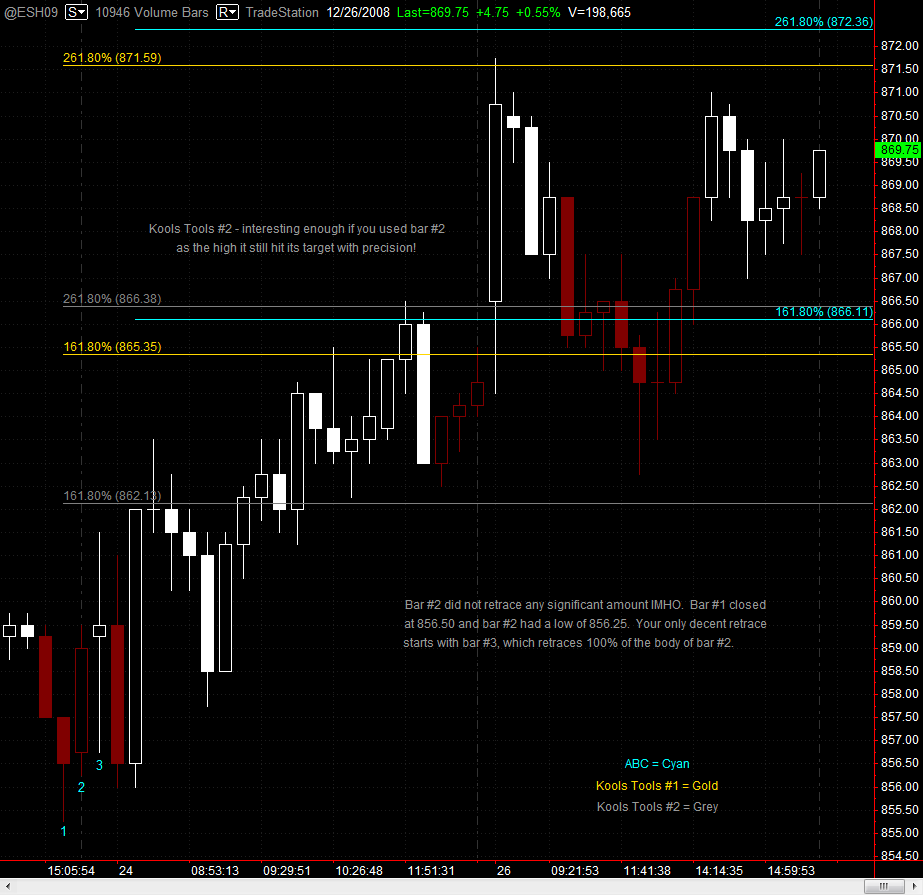
Einstein, I have always felt that every bar, indeed possibly every tick, is a book with its own story to tell. refer to my 'writings' on my theory. As you can see from VO'S example ,they can all work, but to the point of your question. Given that assumption, what bar or bars are best used? It may interest you to know ,when i first discovered the'secret' i was going nuts following each and every tick! Of course, making a call of a top 3 ticks away is not very condusive or realisically useful for trading! Remember the main premise of the theory. The 'initial' move before a 'significant' retrace. And of course what is 'significant'? Again, because every bar or tick, is important,some sort of guidelines would seem to be appropriate.I dont want to be evasive here ,but it really is a matter of perspective! I can tell you what i do, but thats from the perspective of a very short term scalper.When i follow a 1 min chart i generally use the 20% rule you mentioned. This is because as a very short term trader ,im looking for the absoulute bare minimum the market will go to for me to exit my position. On longer term charts (15,30 ,hourly, daily) i tend to give more latitude than 20% because im trying to see what the maximum move might be. For instance, on VO'S chart above candle # 1 alone gives its own projection (855.25-857.50) of 861.14(call it 861.25) which ironically is the met at the high of candle#3! but by the time i would have figured that out ,we probably would be well in to candle #2, say for sake of arguement ,around 859 or so... not much profit left to go after! SO in the above chart i probably would be looking at candle #1 and 2 or even have an eye on candle#3! Some would argue(a matter of perspective) that the main initial move is really the candle #1 low to the 863.50 high,before a real retracement occurs! And whos to say that wont happen! Actually im watching that 875.50-876.75 area now! So my advise is start very short term, like 1 min charts, and get your confidence up in the calls you make. Remember on ALL the projections ,your not trying to pick 'THE' top or bottom ,but simply a possible stopping point to enable an entry or exit for a profitable trade.
And again , i would stress, that this is not a 'holy grail' just a very powerful tool to have in your arsenal. On the above chart example check out the 30 min chart, then look at the 5 min chart and youll be amazed how your perspective might change. Looking at the 1 min and your perspective of the initial move may change again! You have to decide what kind of trader you are and what kind of moves your after. Then experiment with the various time frames and see what your most comfortable with. FOR instance , calling a 15 point move doesnt help me if i have to suffer thru 2 or more 3-4 point retracements along the way to getting there! im just too short term orientated for that! Thats why i dont swing trade!
Thanks to both of you for taking the time to answer my questions. I plan to sim trade this for a while and see what happens. I usually use a 2 point stop in the ES and like to target 4-6 points. May try the 5min/1min combination to start. Also plan to follow some the of trades in the forum. Thanks again.
I thought I better come back and and add a few things to avoid any misunderstanding to any people that may be new here.
This is not a trade you would take unless you were reasonably sure that the market was going to continue its downward movement. What I mean to say is that you wouldn't take it just because the 1.618 projection was there. You would have to have a good reason and in this case there were alotta good reasons to think they would go lower.
1. The market had been moving up all day with no real pullback
2. The previous 10 point decline showed some commitment to the down side.
3. It was very late in the day and with Mideast tensions people will be leery of being in over the Holiday.
4. There were other techs that confirmed the move: .618 fib retracement, possible H&S formation, and prob others.
I use this method when either I missed the trade (maybe I got 1 ticked, or just plain missed it) or if I felt I got out too early and want to get back in.
Emini Day Trading /
Daily Notes /
Forecast /
Economic Events /
Search /
Terms and Conditions /
Disclaimer /
Books /
Online Books /
Site Map /
Contact /
Privacy Policy /
Links /
About /
Day Trading Forum /
Investment Calculators /
Pivot Point Calculator /
Market Profile Generator /
Fibonacci Calculator /
Mailing List /
Advertise Here /
Articles /
Financial Terms /
Brokers /
Software /
Holidays /
Stock Split Calendar /
Mortgage Calculator /
Donate
Copyright © 2004-2023, MyPivots. All rights reserved.
Copyright © 2004-2023, MyPivots. All rights reserved.