ES 1-5-2009
Watching the 910 area this morning...
VAL 910.25
910.50 is the 61.8% retrace level of Friday's up trend.
Below 910 we have the 904 level:
Weekly Pivot Point at 904
Daily S1 at 903.75
904.25 is the 78.6% retrace of Friday's up trend.
POC at 913.75... will probably be ignoring this level today.
Pivot Point 918.25... will be ignoring this level also.
quote:
Originally posted by ak1
prestwickdrive could you please explain it, its confusing for me
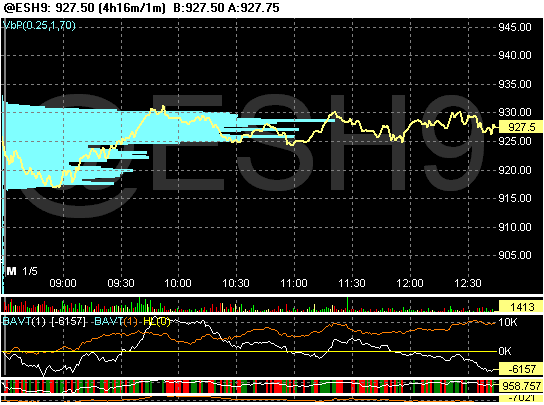
There is a study called BAV in which one can utilize time and sales information as another way to try to figure out what is happening within the volume numbers. Considering trades on the bid being distribution and trades on the ask being accumulation, I have my BAV set with trades of 50 or more contracts considered big money. The BAV on the following chart has 2 lines. The white line is the cummulative "big money" total since the pit open while the brown line is cummulative "small money" action. That's what I was referring to.
Click image for original size
since the GM sales numbers came out bigs have bought a net 3k so far
bigs now net positive again
sold 2 @ 33 avg 31
34.5 = 100% IB extension
My sense of direction is a bit mixed up today lol
flat 30.50!!
sumptin tells me I should take $3.50 for my puts
bigs negative 10900 now - they sure sold the IB extension hard
Whee... everything going on as anticipated
quote:
Originally posted by Margie
myptof, I thought you were joking the other day, hilarious!
lol, no its real...its just a divergence trade, need to have been in a trend and a higher high or double top (or close) The divergence is the big thing. I ended up drawing eyes and naming it for my own amusement. I've been calling it the Batman for years now.
Emini Day Trading /
Daily Notes /
Forecast /
Economic Events /
Search /
Terms and Conditions /
Disclaimer /
Books /
Online Books /
Site Map /
Contact /
Privacy Policy /
Links /
About /
Day Trading Forum /
Investment Calculators /
Pivot Point Calculator /
Market Profile Generator /
Fibonacci Calculator /
Mailing List /
Advertise Here /
Articles /
Financial Terms /
Brokers /
Software /
Holidays /
Stock Split Calendar /
Mortgage Calculator /
Donate
Copyright © 2004-2023, MyPivots. All rights reserved.
Copyright © 2004-2023, MyPivots. All rights reserved.