ES 30min RSI overbought/oversold
Click image for original size
Click image for original size

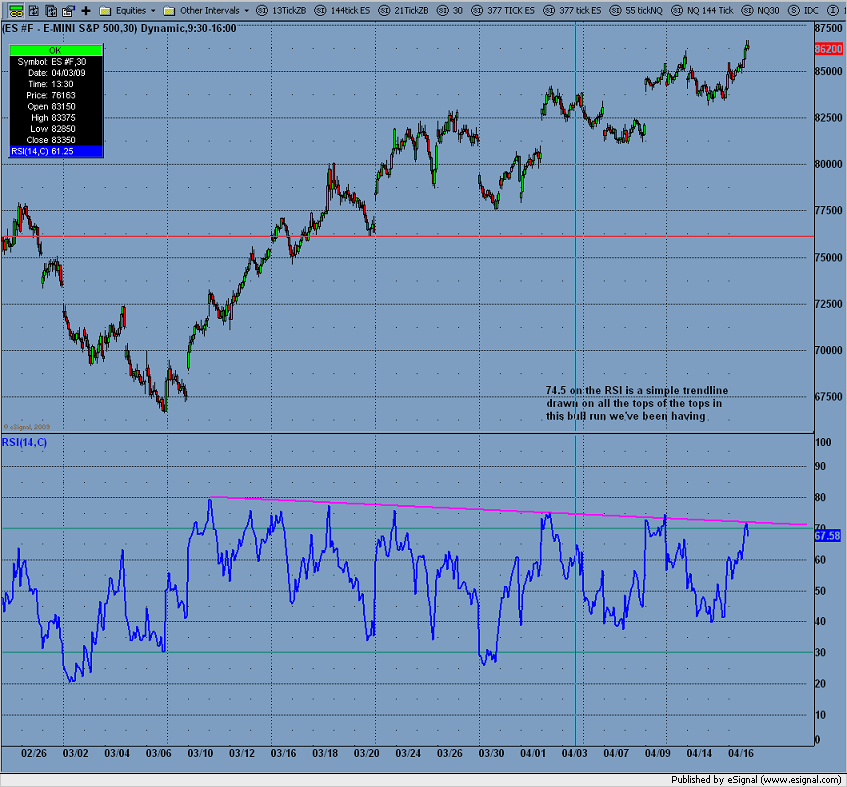
Covered @ +4points what a quick RSI 74.5 reject....I'll show what that 74 is>>>
Click image for original size
Click image for original size
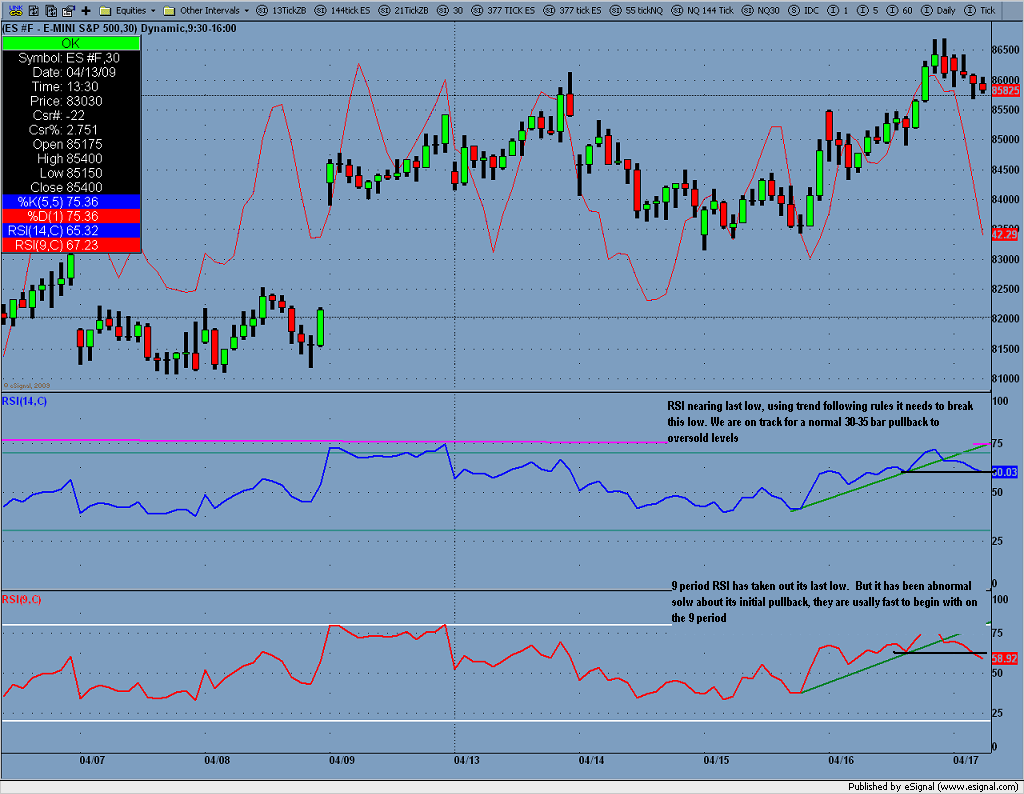
So far this has been a slow pullback. More bullish than bearish. Looking like it wants to make a higher high on the ES and a div on the RSI? If so that would be in line with the 1:00 original projection of 871 thats a good place for me to buy more puts.
Click image for original size
quote:
Originally posted by CharterJoe
Picked up some SPY may 86 puts @ 3.25 ES @ 864
Picked up more @ 2.68 avg now avg 2.96....Now would have been a much better entry.
quote:
Originally posted by CharterJoe
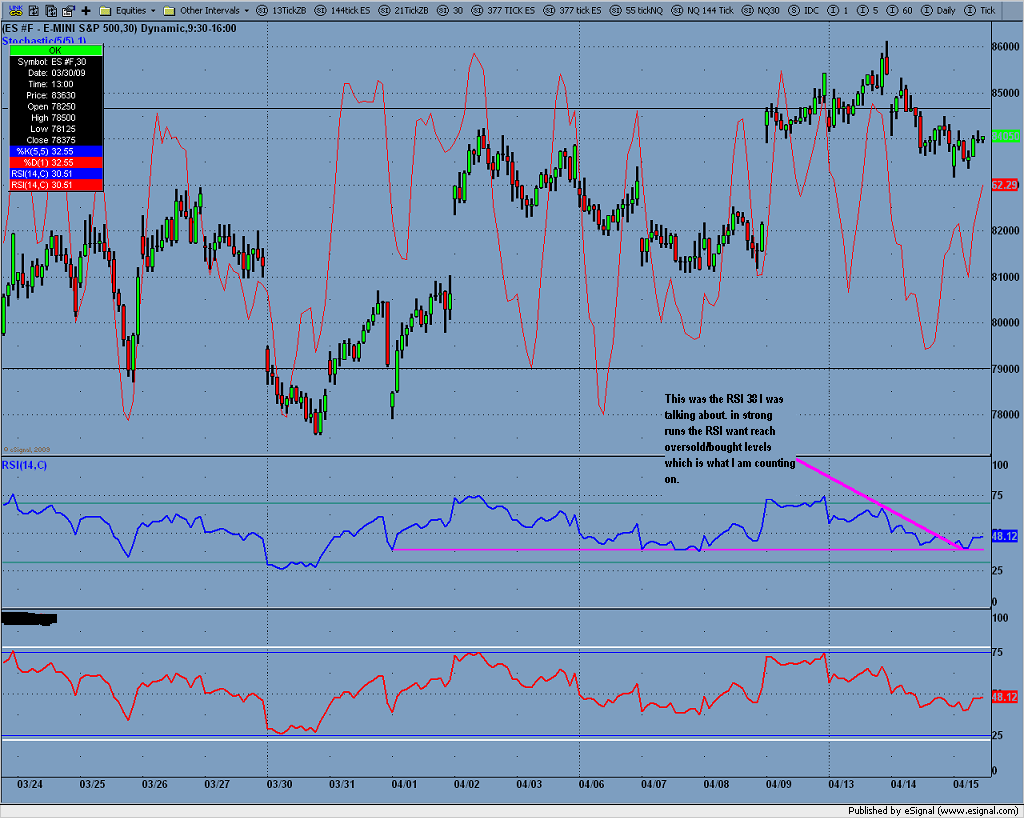
In a normal trending market it takes 25 about 30min bars to go from overbought to oversold, and visa versa. In a slower market it takes 35 30min bars. We are in the 35 bar rotation now, and 11 bars into it, which tells me we will make a high around 865-870 in about 20 bars or 13:00 time Monday.
BINGO! well I was off 1 point and 30 min. But I am always entering my trades early thats why I when I swing trade I do it with options.
Click image for original size
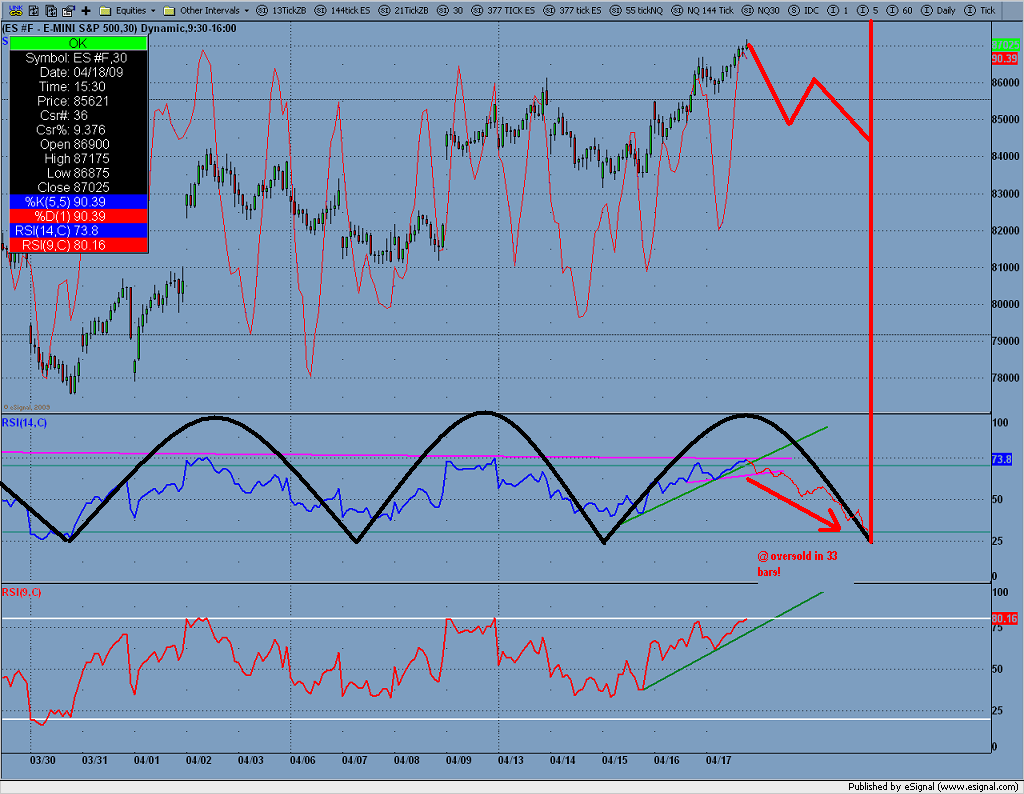
Picked up some more options thats it for me on those. Looking for -30 points in 33 30min bars. That is...4/22 (Wends) @ around 11:30. 377 tick chart made a lower low and with a MACD div. so IMHO thats it for the uptrend, its over. Nice trade btw with 30 min RSI overbought and a nice setup in the micro time frame.
Click image for original size

The Stochastics were overbought (blue line) with the RSI as well (bottom blue line) and @ 871 square of nine. All this with the 30 min overbought 3 points. A great way to end the week.
hey Joe, any chance I could get you to add the $vold ( In esignal ) to a few of these multi - day 30 minute charts...that's the up vol minus the down vol on the NYSE....I'm basically just wondering if we can see some nice Volume divergences at these key inflection points too along with the rsi readings
quote:
Originally posted by CharterJoe
Picked up more @ 2.68 avg now avg 2.96....Now would have been a much better entry.
Sold those puts at the close 4.25...+1.40...
Sure Bruce, I'll add that $vold
Joe;
Have you used the ADX. If so what time frame?
Thanks
Have you used the ADX. If so what time frame?
Thanks
Emini Day Trading /
Daily Notes /
Forecast /
Economic Events /
Search /
Terms and Conditions /
Disclaimer /
Books /
Online Books /
Site Map /
Contact /
Privacy Policy /
Links /
About /
Day Trading Forum /
Investment Calculators /
Pivot Point Calculator /
Market Profile Generator /
Fibonacci Calculator /
Mailing List /
Advertise Here /
Articles /
Financial Terms /
Brokers /
Software /
Holidays /
Stock Split Calendar /
Mortgage Calculator /
Donate
Copyright © 2004-2023, MyPivots. All rights reserved.
Copyright © 2004-2023, MyPivots. All rights reserved.