ES 30min RSI overbought/oversold
Click image for original size
Click image for original size

finally! BINGO O/N 896.75, SHORT FROM 896.50 JUST FOR A COUPLE HANDLES THO.(waited all doggone day for that!)
Next obvious resistance on BAC is 9.80, its air from there to 11.50
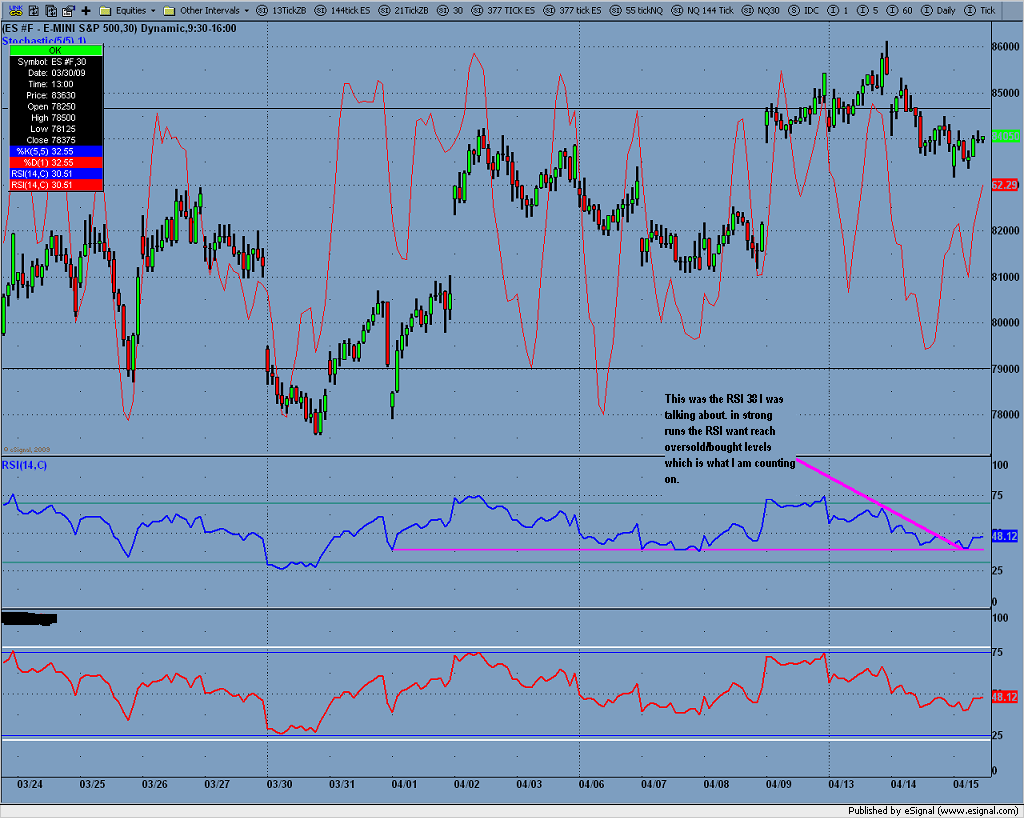
RSI divergence on the 30 min ES, now all we need is a lower low, and a close below the low.
Bought some more Puts avg 1.75 target 1/2 point. This market is strong
Bought some more Puts avg 1.75 target 1/2 point. This market is strong
covered 894.25 for a little scalp ,now looking for a position trade around this 906 level...
Hi Charter Joe,
FWIW, I really appreciate you posting your RSI 30 min swing trades here. I always enjoy your posts. You were gone for awhile and am glad you are back.
FWIW, I really appreciate you posting your RSI 30 min swing trades here. I always enjoy your posts. You were gone for awhile and am glad you are back.
Thanks Margie,
As you all know my wife had our second baby and it was a bit hectic around the house for a few months, during the sept-dec time. But we got back in sinc with things and trading is going well its good to be on the buying side again.
As you all know my wife had our second baby and it was a bit hectic around the house for a few months, during the sept-dec time. But we got back in sinc with things and trading is going well its good to be on the buying side again.
RSI was knocking the low 40's again, looks good around this 901-910 level 907 is were I am long, 901 would have been a much better entry (i.e. sq of 9) but I wanted to make sure we got above the 9period MA on the 30 min.
We had a longer pull back in number of 30min bars it was 33 bars from RSI overbought to oversold. Reason was because of a divergence that started to form on wend. As I stated in here earlier in the week that this top would be on a 30min RSI divergence. Divergence's on the RSI are cyclical as well.
Pull back from RSI peak on 5/6/09 to the 901 level today was more in line with 29 bars of the typical 30 bar cycle that the RSI travels in from overbought-oversold.
Covered 1/2 near the plus 8 this morning. I have got the flu with 102.5 and really sore. I mam goin back to bed, see if you guys can't keep the market up for me
Covered other 4cons @ 926 +19 on those. RSI is approaching the overbought area, and at 64.6 which is a resistance area, Its the downtrend line drawn from the last 2 tops on RSI.
Joe;
Have you used the ADX. If so what time frame?
Thanks
Have you used the ADX. If so what time frame?
Thanks
Emini Day Trading /
Daily Notes /
Forecast /
Economic Events /
Search /
Terms and Conditions /
Disclaimer /
Books /
Online Books /
Site Map /
Contact /
Privacy Policy /
Links /
About /
Day Trading Forum /
Investment Calculators /
Pivot Point Calculator /
Market Profile Generator /
Fibonacci Calculator /
Mailing List /
Advertise Here /
Articles /
Financial Terms /
Brokers /
Software /
Holidays /
Stock Split Calendar /
Mortgage Calculator /
Donate
Copyright © 2004-2023, MyPivots. All rights reserved.
Copyright © 2004-2023, MyPivots. All rights reserved.