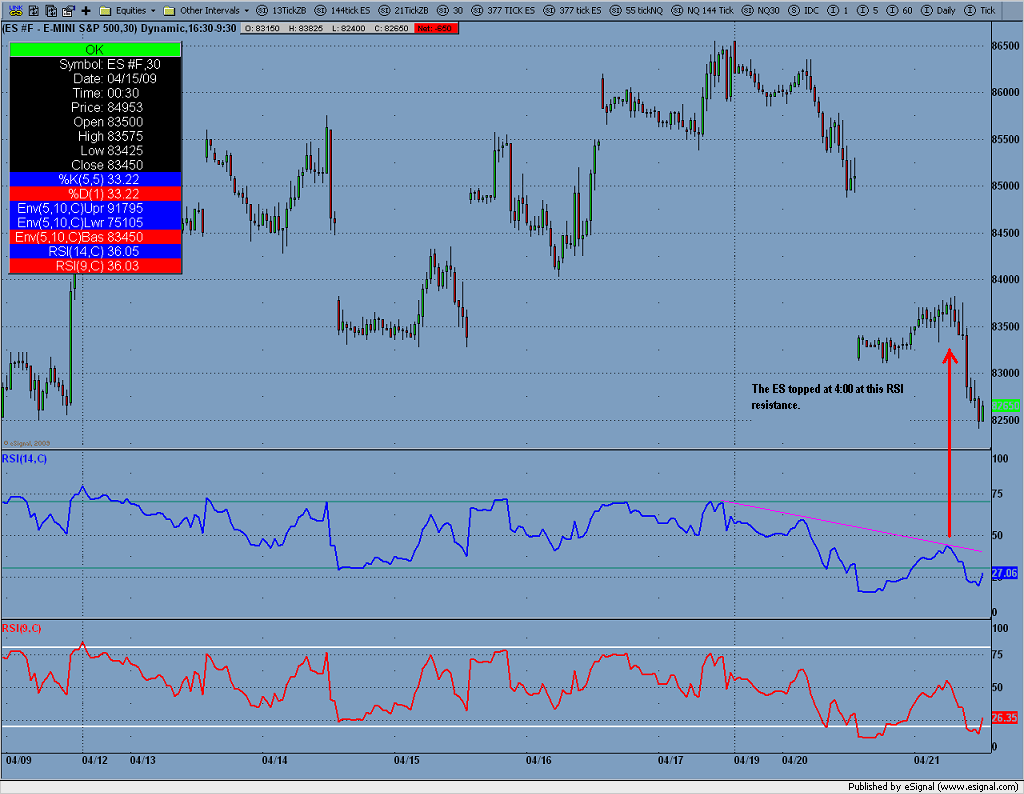
ES 30min RSI overbought/oversold
Click image for original size
Click image for original size

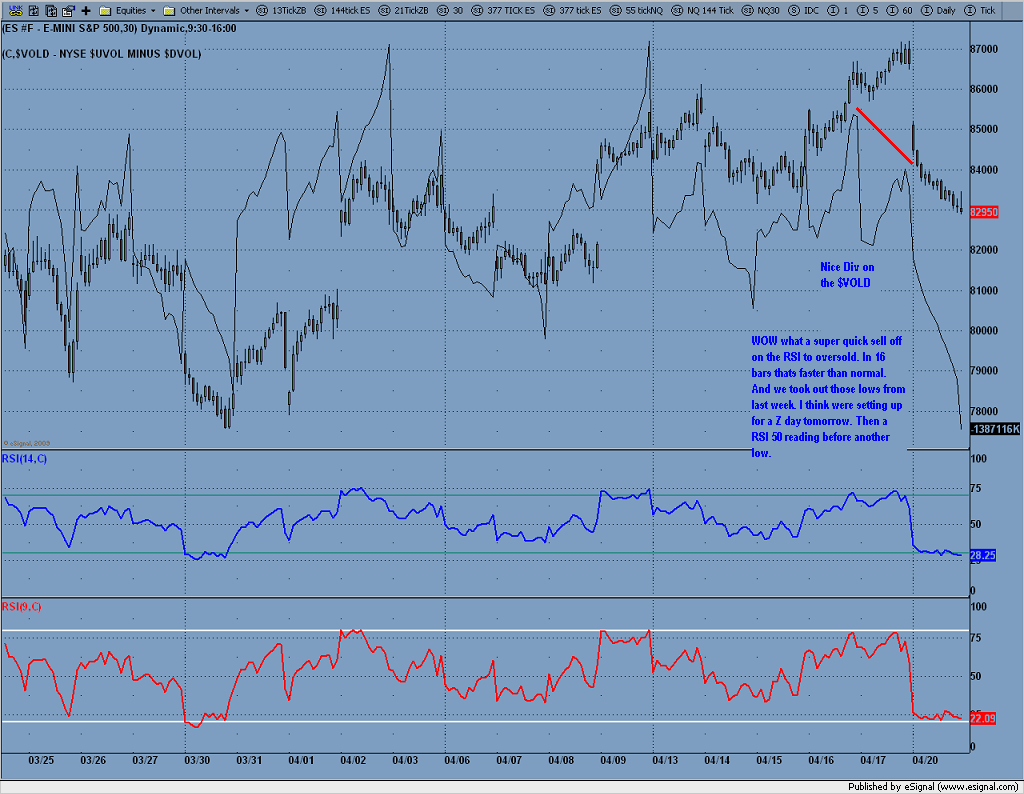
Bruce here is what you asked for.
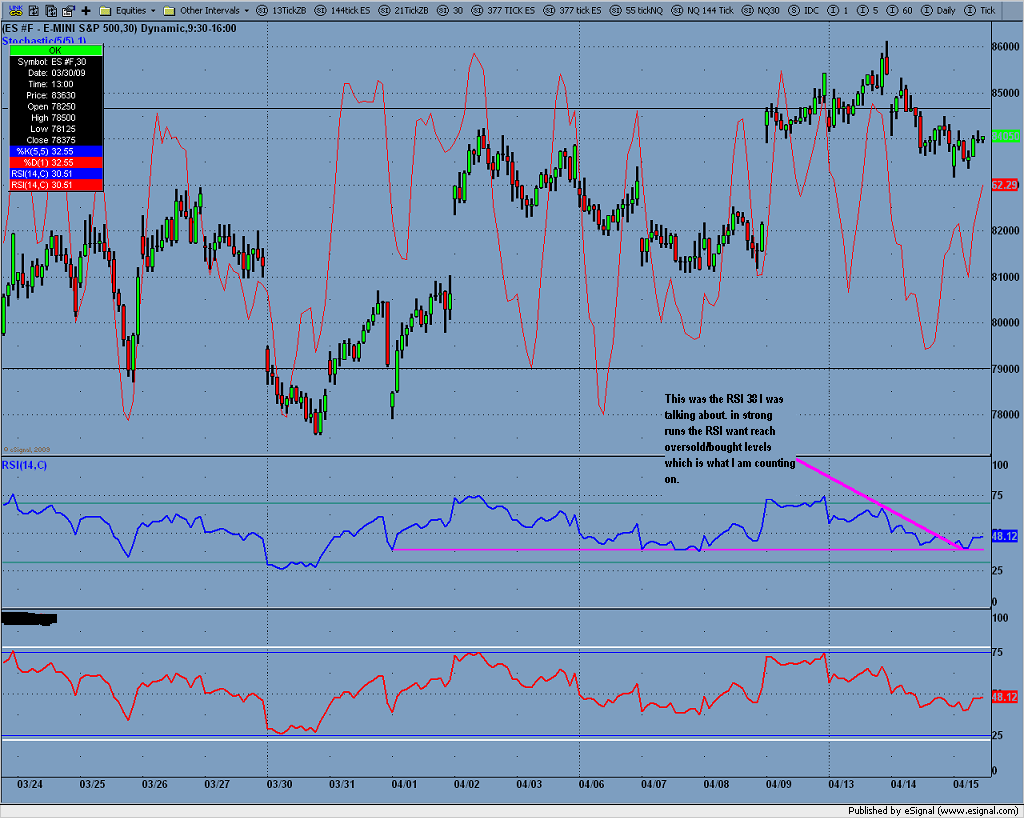
Not really much else to report on RSI today. Other than those Puts I had are gone, next I'll look to buy calls only if the market makes a lower low tomorrow and then only at close. If this doesn't set-up then I'll look to buy some puts at RSI 50ish level.
hmmm??? We are in a superb box on the RSI, but kidding ourselves to think it'll last forever.
Click image for original size
Not really much else to report on RSI today. Other than those Puts I had are gone, next I'll look to buy calls only if the market makes a lower low tomorrow and then only at close. If this doesn't set-up then I'll look to buy some puts at RSI 50ish level.
Click image for original size
hmmm??? We are in a superb box on the RSI, but kidding ourselves to think it'll last forever.
Click image for original size
Here is a chart of the overnight only, Long @ 832.75 SL @ 826
Should get some upside movement @ 2:30AM
Call options prem. ought to be very cheap at the open. I am thinking of buying some on open...
quote:
Originally posted by CharterJoe
Up move topped around 4:00 AM. Long @ 825, also long NQ @ 1306
Made +18 points on those, sold them neare close. Due too the $VOLD trending up 90% of the day, and a beautiful rising RSI. Thanks 4 sharing bruce...Still holding the NQ's I would like to hold out for 60points on those...I watched in amazement how the $VOLD kept me long all day. Listen I have never seen something that speaks to me about when to use one min RSI and when not to like this $VOLD.
Sold 1/2 of those NQ's @ 1346...+40points on those. SL on rest @ even. It didn't look so good yesterday with that RSI breakdown. I think I can get another 30points on whats left due to the fact of a good RSI pullback and we broke mon-tues range yesterday and markets looking strong.
Click image for original size
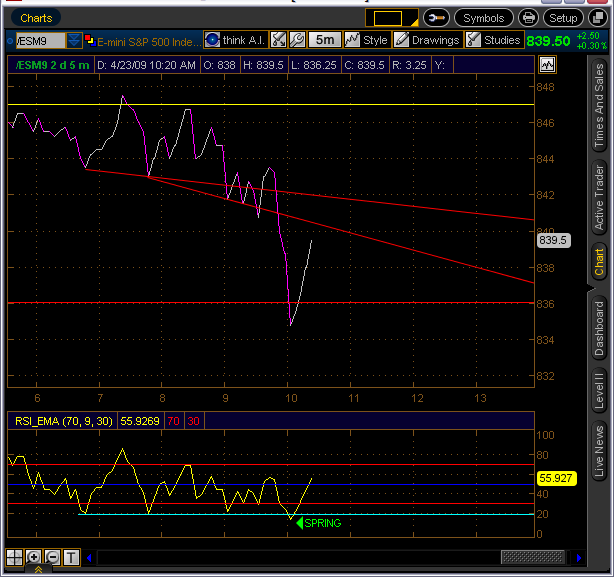
5min SPRING
The rule I use with the "spring" is it should project to the most recent high
prior to the spring. This would be the 47.00 area from the overnite high.
The next projection would be the RTH high 58.75 from 4/22....we'll see
prior to the spring. This would be the 47.00 area from the overnite high.
The next projection would be the RTH high 58.75 from 4/22....we'll see
That's probably the most statistically sound strategy for trading cup and handles, Red. Cat ears or big pictures, double tops and bottoms and variations of triangles and flags all pretty much give the same divergence signals, and they're coupled together within your screen. Cup and handles can go back a couple of days, which means it's a set-up trend changing pattern where cat ears and the rest are changing or continuation patterns; all of which makes it hard without a bigger time frame chart for reference to guage when to flip the divergences according to market bias, at times.
Nice work. Less risk, too. Thumbs up.
Nice work. Less risk, too. Thumbs up.
Joe;
Have you used the ADX. If so what time frame?
Thanks
Have you used the ADX. If so what time frame?
Thanks
Emini Day Trading /
Daily Notes /
Forecast /
Economic Events /
Search /
Terms and Conditions /
Disclaimer /
Books /
Online Books /
Site Map /
Contact /
Privacy Policy /
Links /
About /
Day Trading Forum /
Investment Calculators /
Pivot Point Calculator /
Market Profile Generator /
Fibonacci Calculator /
Mailing List /
Advertise Here /
Articles /
Financial Terms /
Brokers /
Software /
Holidays /
Stock Split Calendar /
Mortgage Calculator /
Donate
Copyright © 2004-2023, MyPivots. All rights reserved.
Copyright © 2004-2023, MyPivots. All rights reserved.