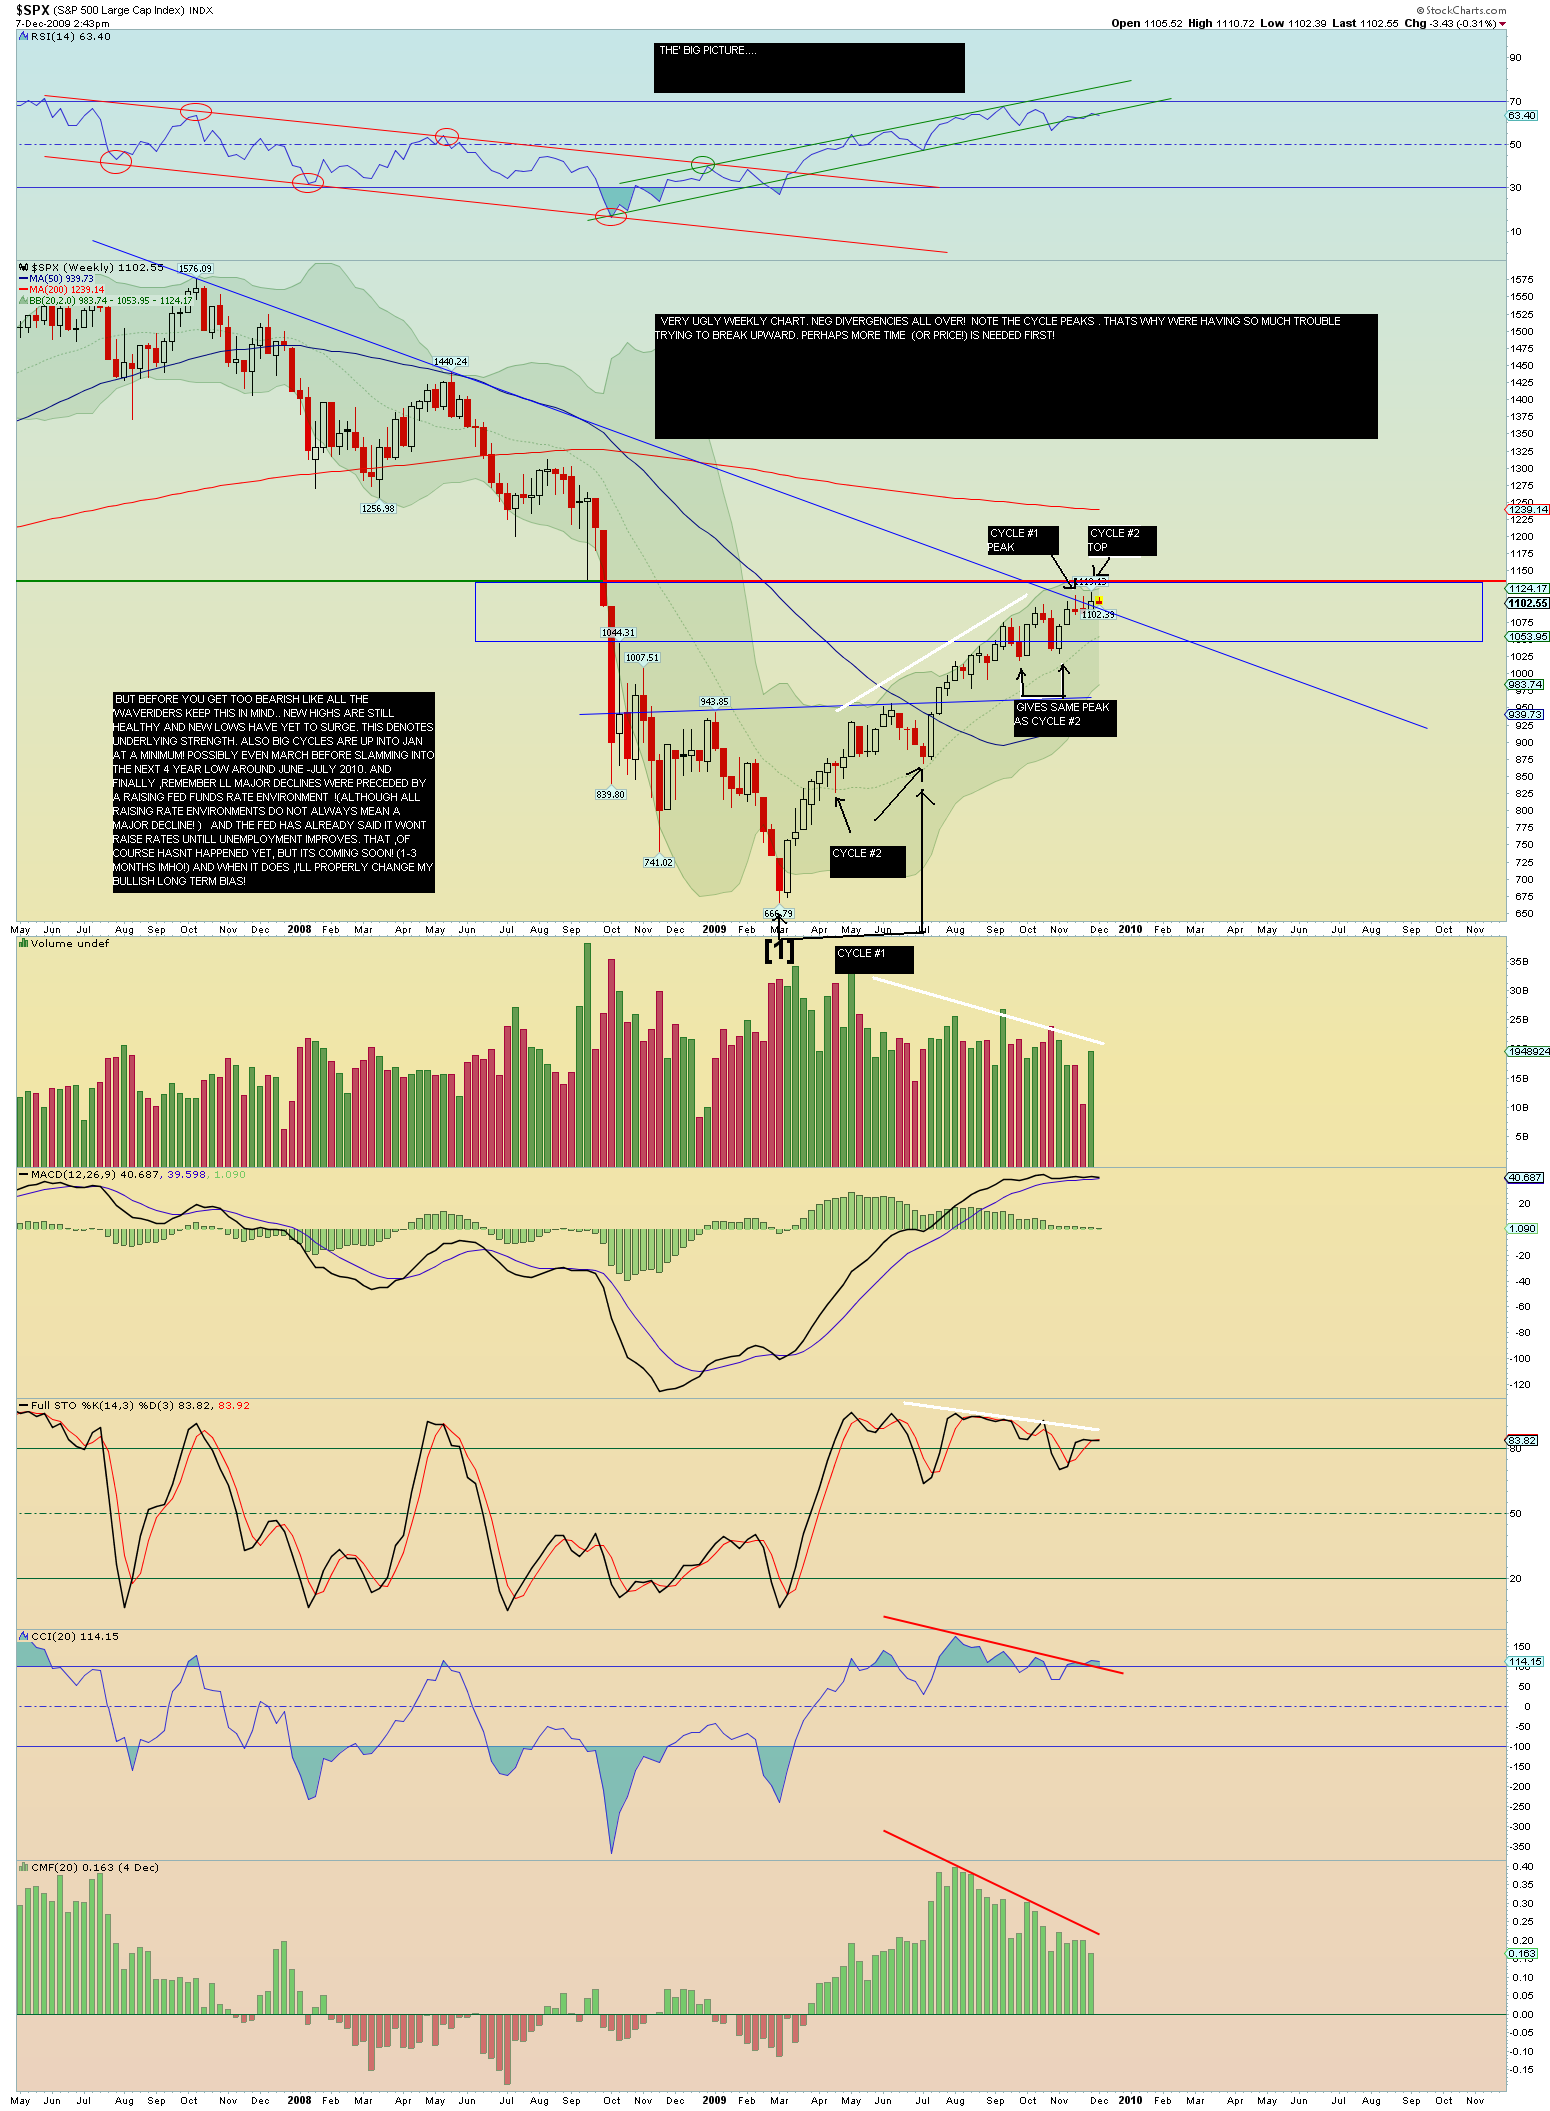
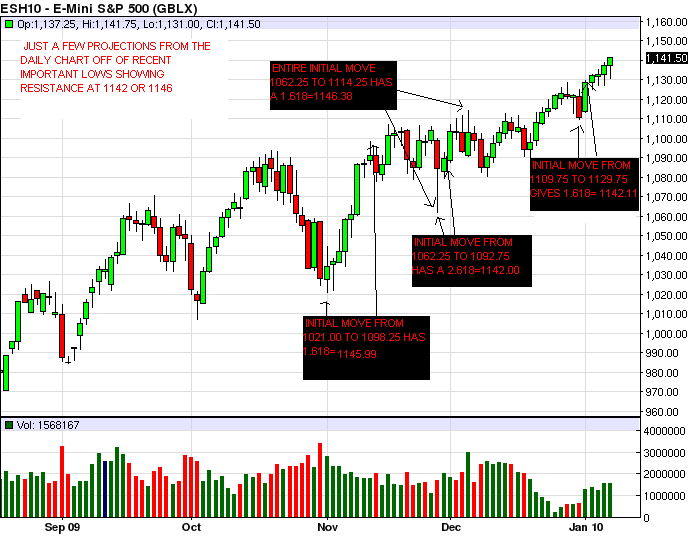
Longer term view
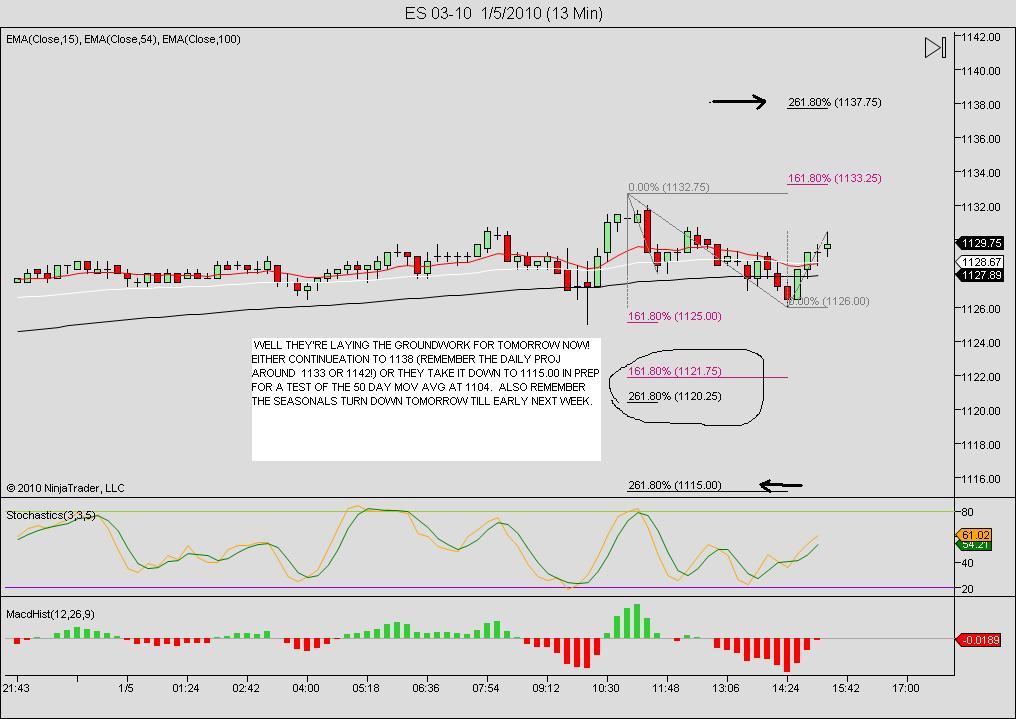
This is why im cautious here , but still bullish longer term (at least for now)...
Click image for original size
....thoughts? opinions? critisizems? all are welcome!
One more fun fact to be aware of..may be useful...
Click image for original size
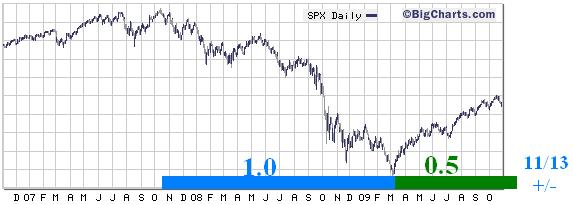
( a ) Fibonacci Time Zone ratio 0.618 due 01/18/10
Originally posted by koolblue
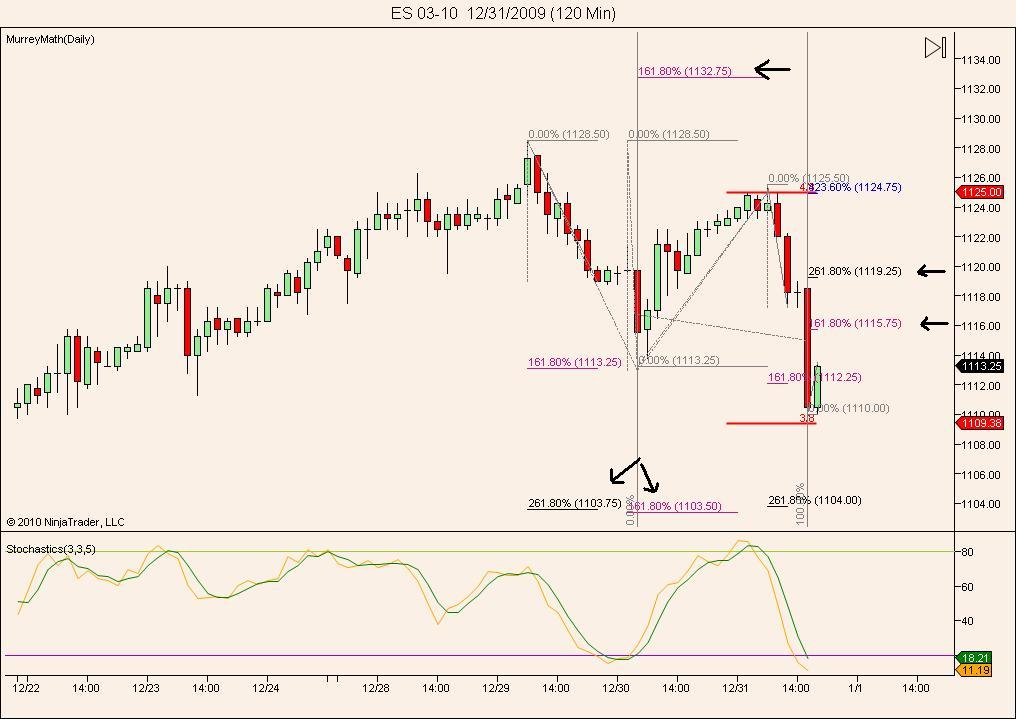
as i pointed out , we hit the 1109 level shown on the above 120 min chart. Is that enough? I dont think so, but time will tell. after a rebound mon.(1115 or 1119?) im wondering if the 1103 area gets hit? Thats certainly a possibility. Or maybe , 1109 will be enough. We'll see. At any rate , heres hoping all of you have a great 2010!...
Click image for original size
Great chart analysis, KoolBlue!
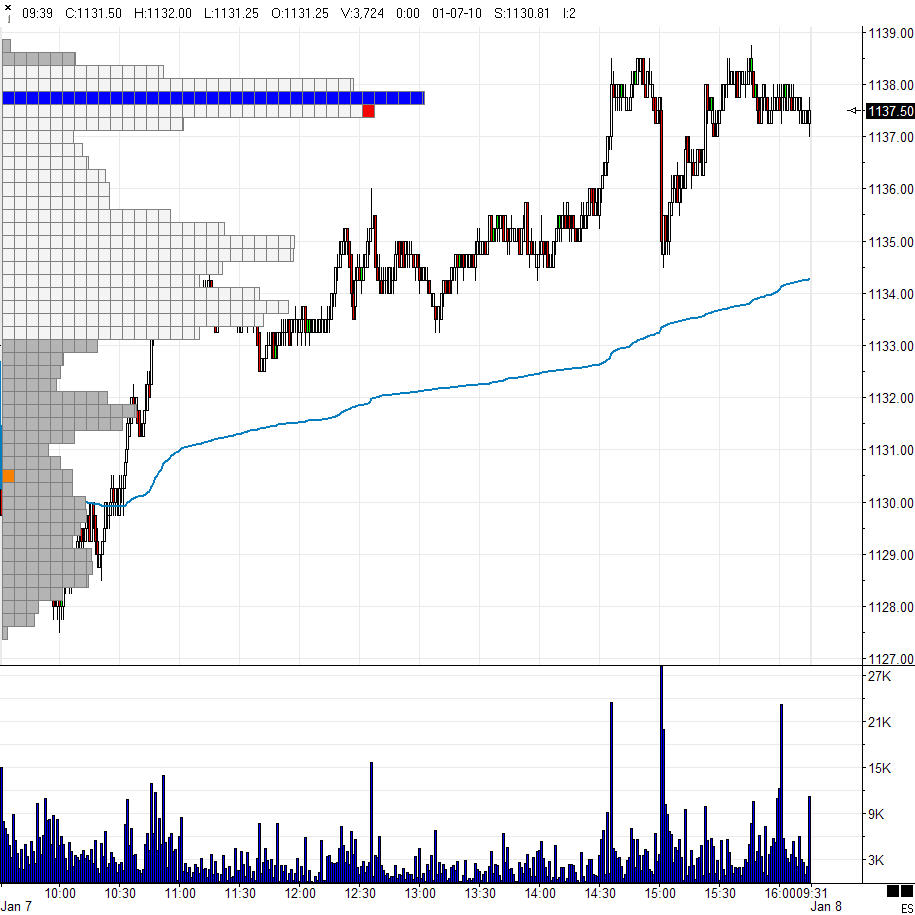
If buyers don't show up at 1109, then we will likely see 1103 get tested. Avg range during the holidays was around 8pts, so I'd be surprised if we didn't see at least a 14pt range on Monday.
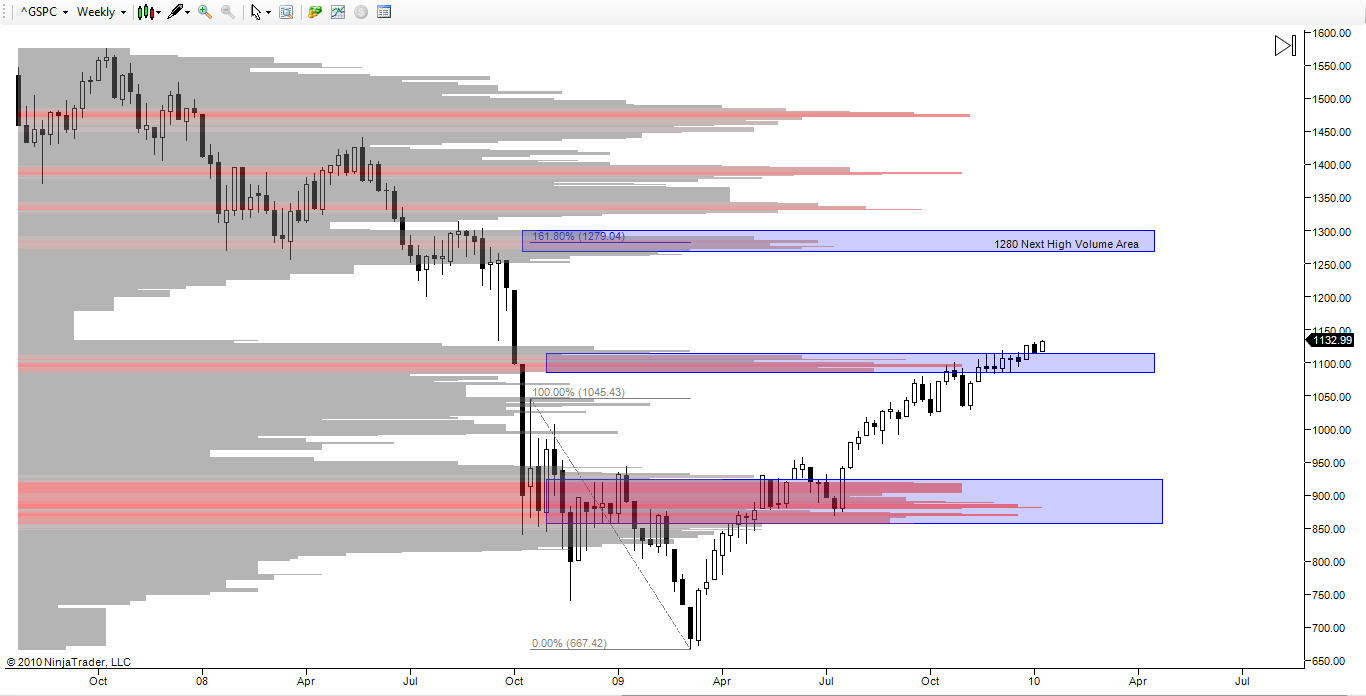
Here is a look at a weekly volume composite of the S&P 500. Could 1280 be our next stop? RubRub
Click image for original size
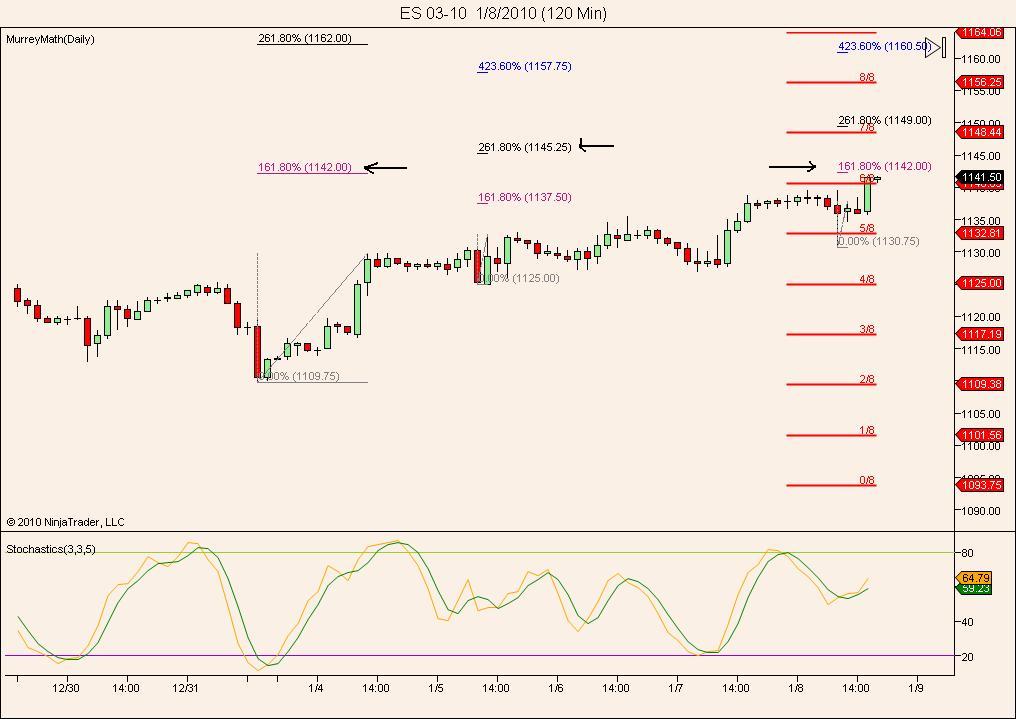
note the BINGO! at 1132.75! Thx for your charts Doesone! Great contribution.
Click image for original size
WEEKEND UPDATE 1-09-10 : Interesting week, with the averages surging Monday , then drifting sideways into a rally Friday from the obligatory Thursday low, a pattern which has repeated countless times since Sept.This was in the face of seasonals which turned down into early next week. They next peak in about a week.Also of note is the poor employment news greeted with higher closes on the indicies! Slowly the tide is turning where good employment news could be a cataylst for a downdraft! Can we make it to the expected March high? Possibly,new highs and new lows remain positive for now, anyway. Next week however is expiration week. From Sy Harding: The ‘monthly strength period’, which began the previous Thursday and encompasses the days surrounding the end of the month when extra chunks of money flow into the market from monthly 401K contributions, those who dollar cost average into the market on a monthly basis, re-invested monthly dividends and interest payments, etc., was due to end on Thursday.
The next pattern is that next week will be this month’s options expirations week. And while expirations weeks tend to be positive, that is not the pattern for the expirations week in January. The Stock Traders Almanac notes that “January Expiration weeks down big 8 of last 11 years”, and expiration day (Friday of next week) “Expiration Day Dow down 9 of last 11 . Interesting indeed , as Kools tools has some targets right in this area. Though i have the 0.618 of the entire bear decline on the 18th, several bloggers have it on the 11th! For all these reasons and many others ( high put/ call,neg divergencies,qqqq black bar on Thurs. which usually preceeds a short term decline by a few days, overbought short term technicals,etc), i'm looking for a short term top right in this area....
The next pattern is that next week will be this month’s options expirations week. And while expirations weeks tend to be positive, that is not the pattern for the expirations week in January. The Stock Traders Almanac notes that “January Expiration weeks down big 8 of last 11 years”, and expiration day (Friday of next week) “Expiration Day Dow down 9 of last 11 . Interesting indeed , as Kools tools has some targets right in this area. Though i have the 0.618 of the entire bear decline on the 18th, several bloggers have it on the 11th! For all these reasons and many others ( high put/ call,neg divergencies,qqqq black bar on Thurs. which usually preceeds a short term decline by a few days, overbought short term technicals,etc), i'm looking for a short term top right in this area....
Click image for original size
Click image for original size
Click image for original size
Click image for original size

Emini Day Trading /
Daily Notes /
Forecast /
Economic Events /
Search /
Terms and Conditions /
Disclaimer /
Books /
Online Books /
Site Map /
Contact /
Privacy Policy /
Links /
About /
Day Trading Forum /
Investment Calculators /
Pivot Point Calculator /
Market Profile Generator /
Fibonacci Calculator /
Mailing List /
Advertise Here /
Articles /
Financial Terms /
Brokers /
Software /
Holidays /
Stock Split Calendar /
Mortgage Calculator /
Donate
Copyright © 2004-2023, MyPivots. All rights reserved.
Copyright © 2004-2023, MyPivots. All rights reserved.