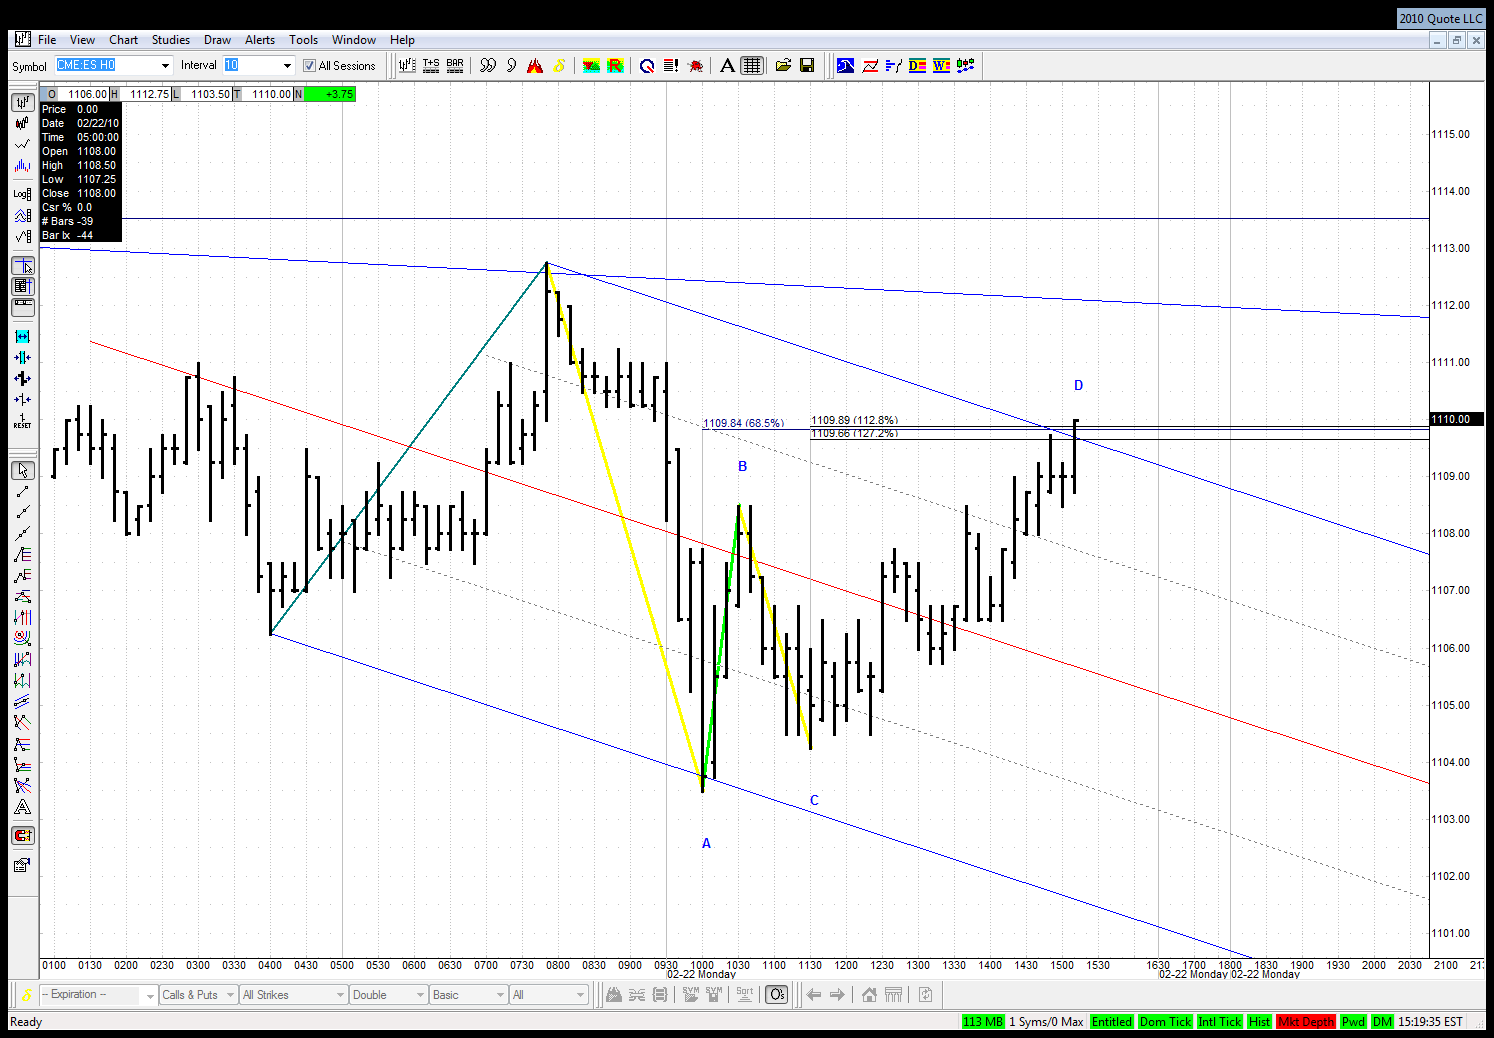
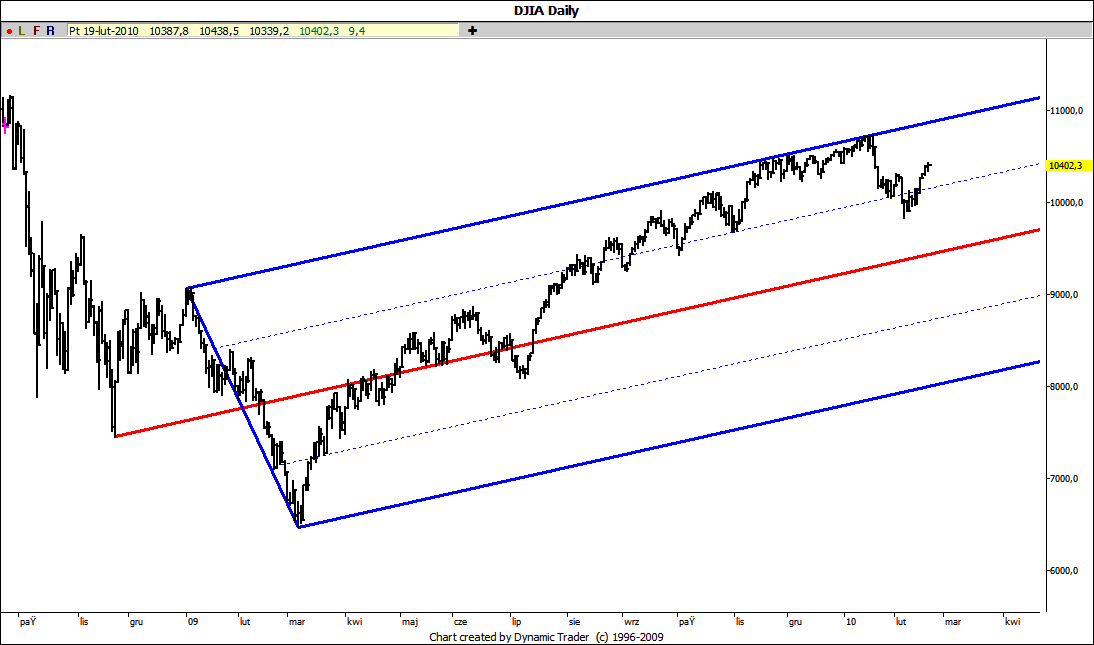
After dozen or so of unsuccessful attempts to overcome the upper ML DJIA has moved decisively into the direction of the main ML. However it didn't reach it and is now hovering around the division line:
Click image for original size
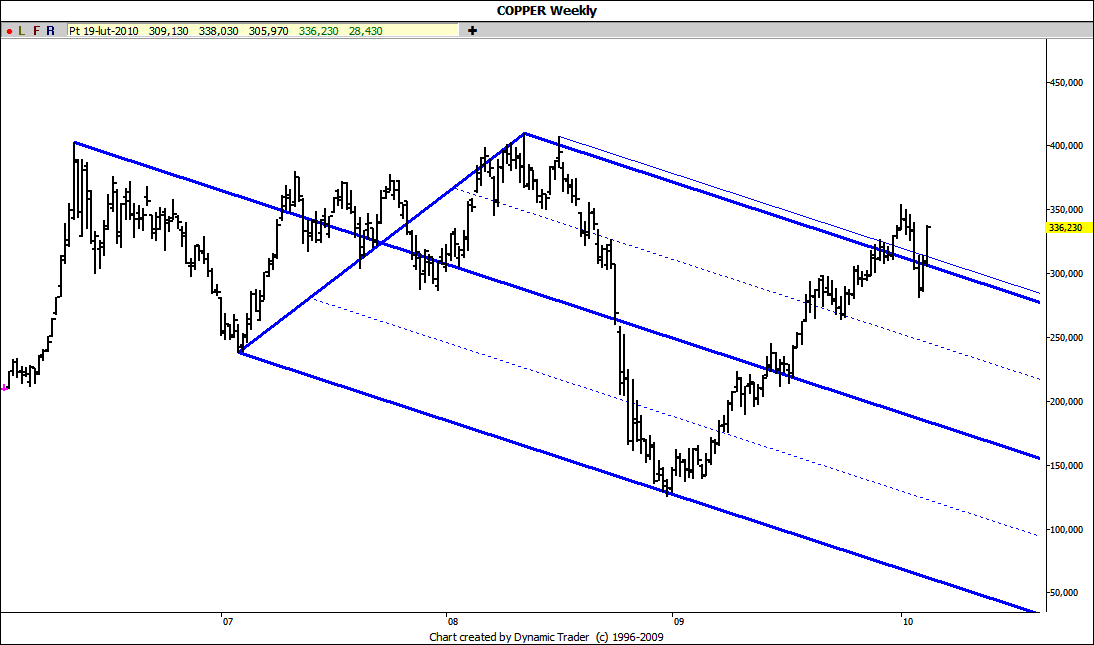
Copper shows no respect at all to its long term natural set moving through its lines back and forth:
Click image for original size
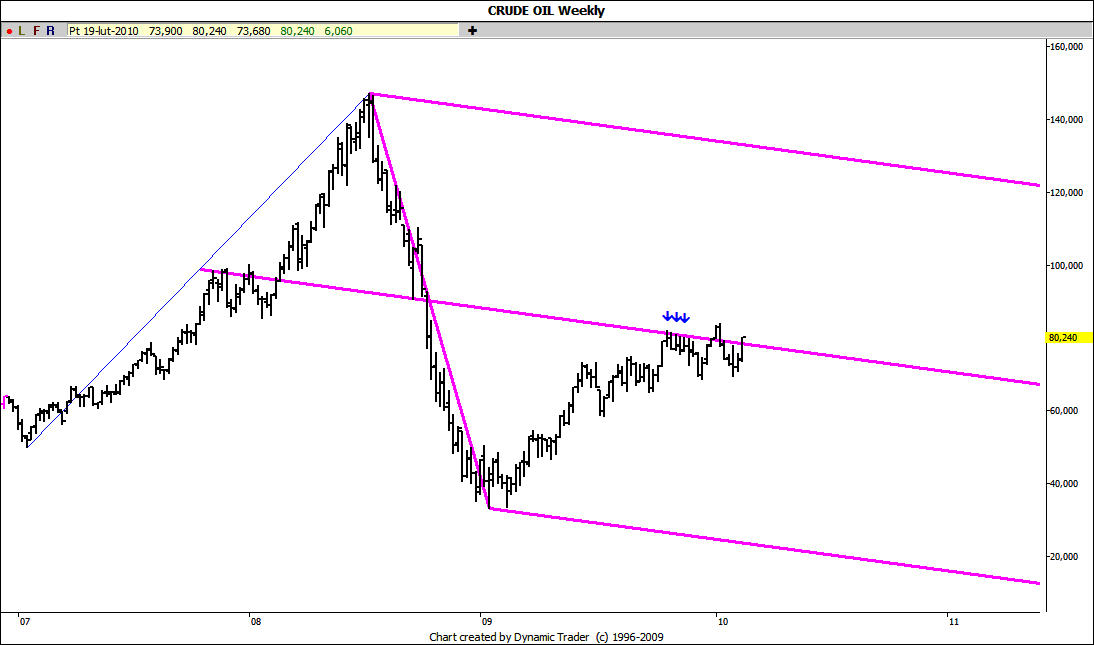
Crude is still hovering around the ML of its long term Schiff set what in my opinion looks more and more like just a pause in its long term upward march:
Click image for original size
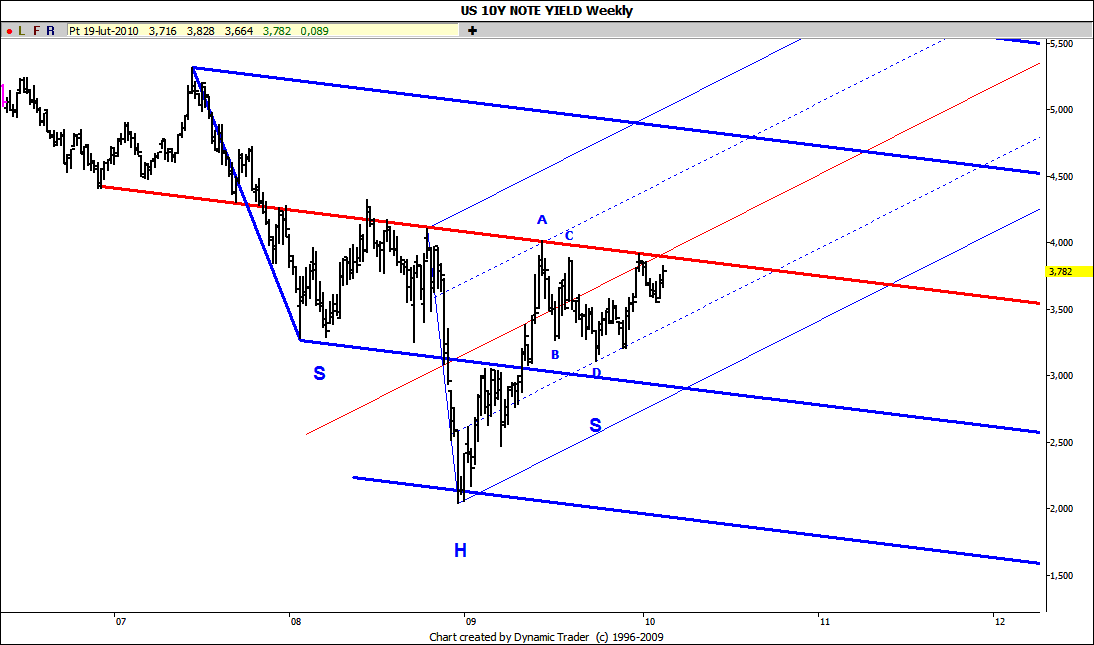
10Y yield is again approaching the potential neckline of its long term inverse head and shoulder pattern. If the rise doesn't stop here we may see much higher rates pretty soon:
Click image for original size