MyPivots
Sign In
JA
jarek
Rep: 94
Posts: 3,474
Here is the update of some of the long term charts I was presenting here in the last months.

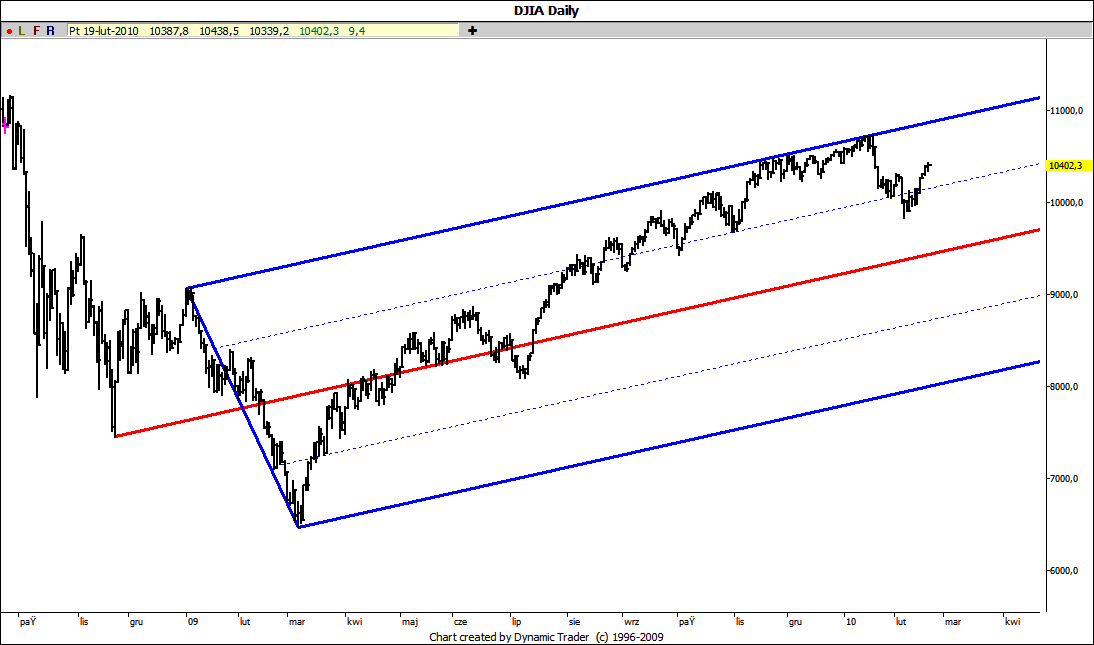
After dozen or so of unsuccessful attempts to overcome the upper ML DJIA has moved decisively into the direction of the main ML. However it didn't reach it and is now hovering around the division line:

Click image for original size


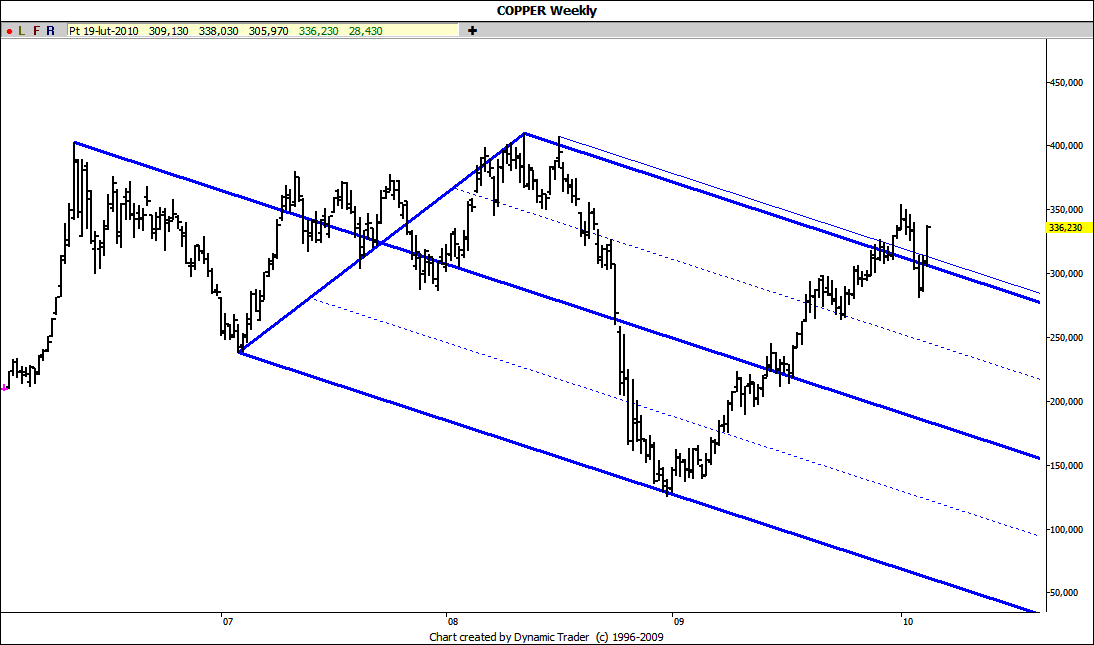
Copper shows no respect at all to its long term natural set moving through its lines back and forth:

Click image for original size


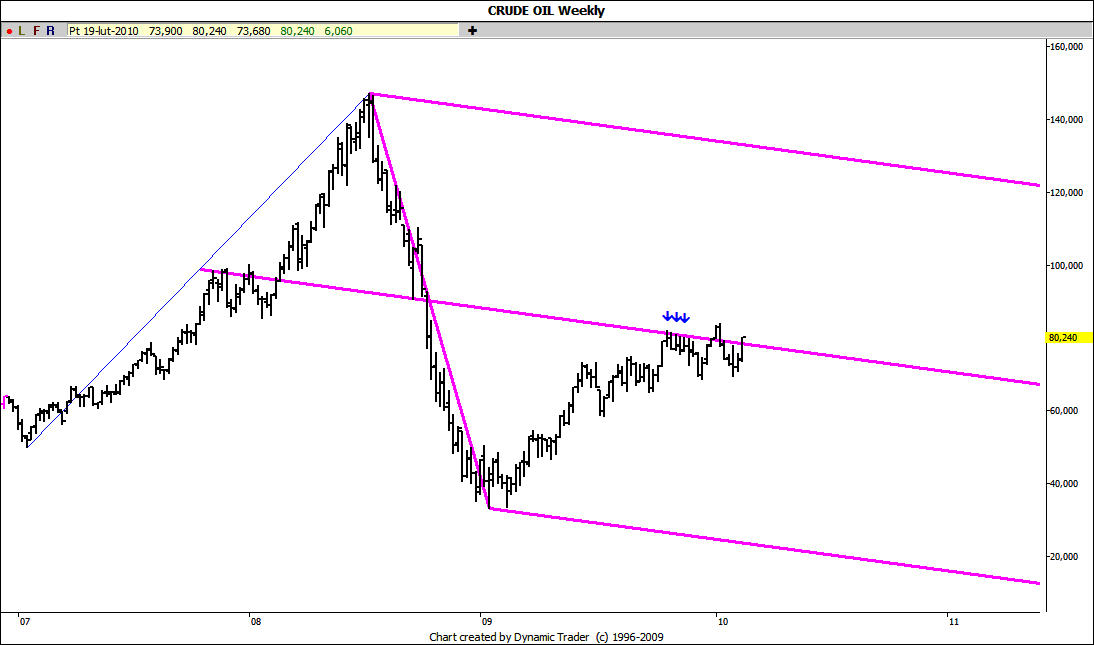
Crude is still hovering around the ML of its long term Schiff set what in my opinion looks more and more like just a pause in its long term upward march:

Click image for original size


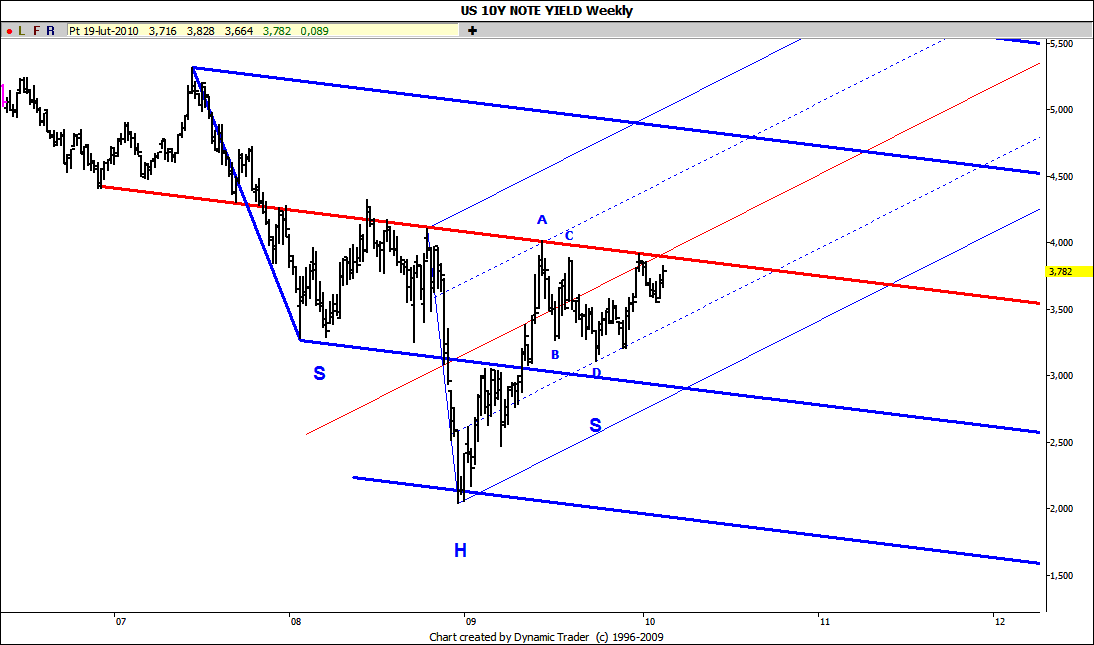
10Y yield is again approaching the potential neckline of its long term inverse head and shoulder pattern. If the rise doesn't stop here we may see much higher rates pretty soon:

Click image for original size
TO
TonyC
Rep: 99
Posts: 471
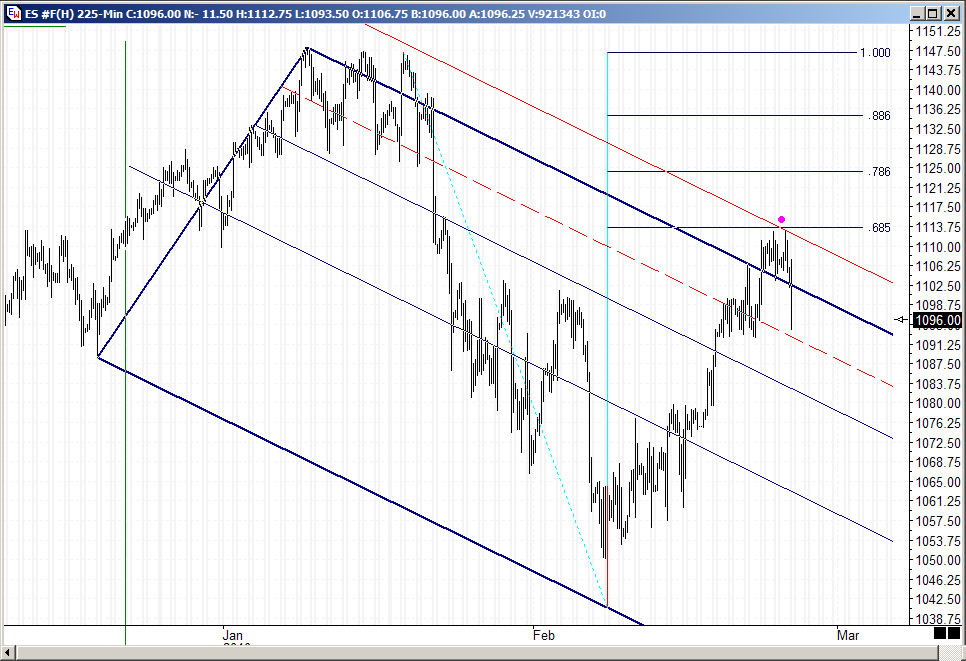
ES reaction spot. Got some insane action down the lower time frames. U could see the nasty scare tactics live down the tick chart to kick start the current leg down in the EURUSD cueing off the London futures.
How long will it last I really don't know but I sure love the movements
Click image for original size
JA
jarek
Rep: 94
Posts: 3,474
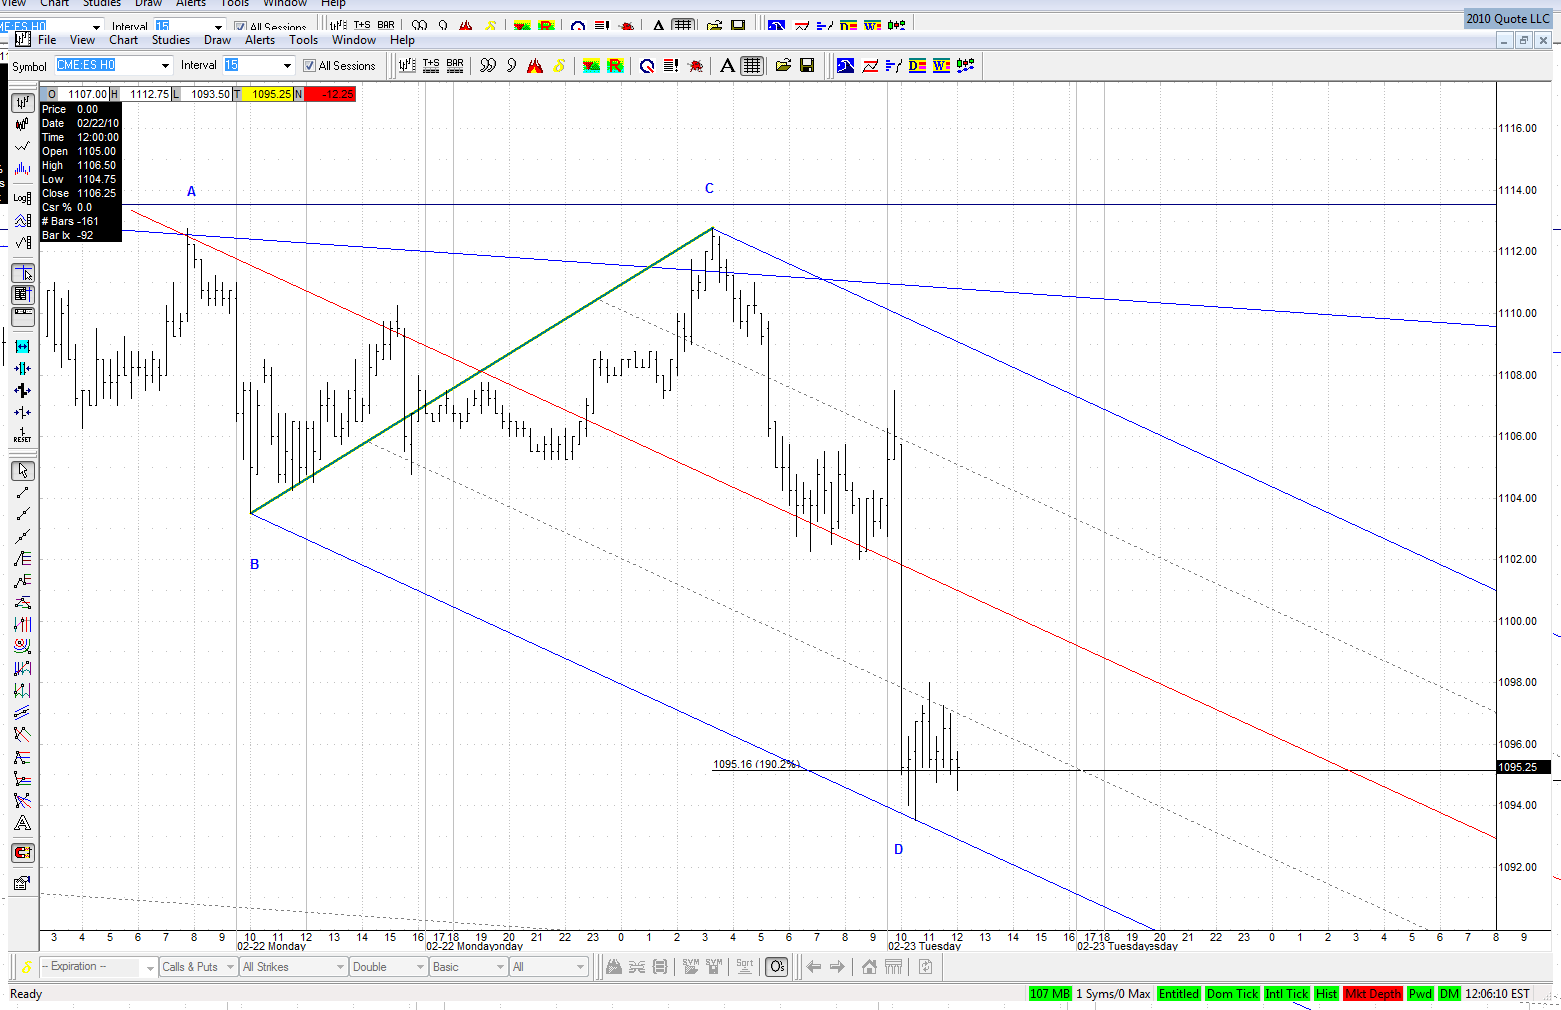
Today's low was probably the last possible area for the following DT ABCD:

Click image for original size


Failure to keep it would mean more troubles for bulls.
AL
albert
Rep: 99
Posts: 3,094
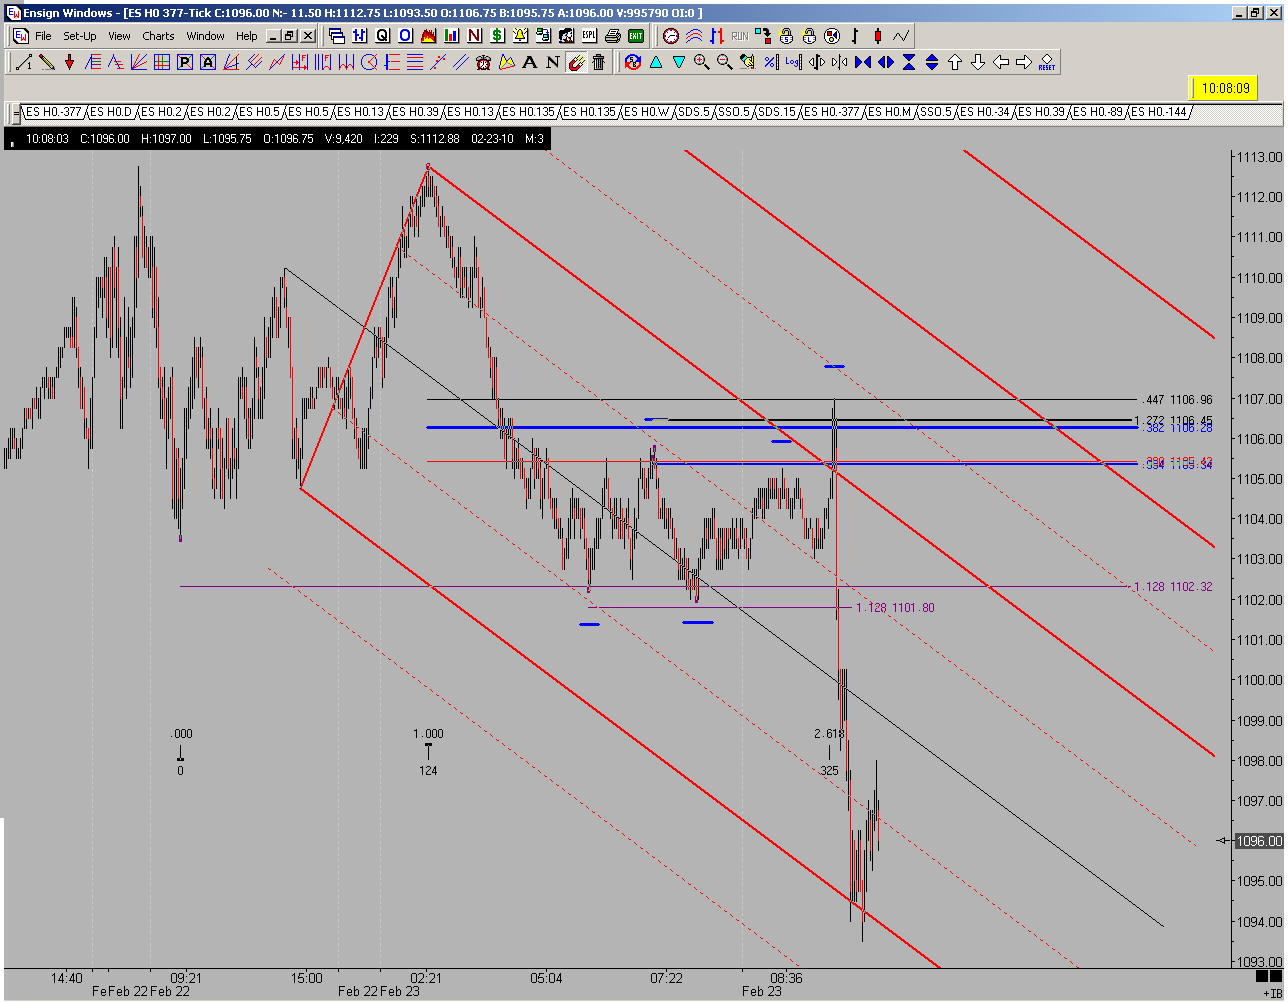
Yes. I saw a Kane TD morphing into a Kane EXP shown on the 377 tick chart. I entered the Kane TD & barely exited it before I started having price data problems. The Kane EXP completed and a rapid downmove began. LOL. I TRY to stay mindful of possible Kane TD to EXP transitions but this one took me by surprise! The Kane methodology sure goes a long way to explaining the price action, IMHO.

Al Kamego
Click image for original size
TO
TonyC
Rep: 99
Posts: 471
ES getting a small bounce off its .300 retrace @90-91. Not much of a pop yet
JI
jimkane
Rep: 3,058
Posts: 33,089
Great posts, crew. What a pleasant surprise for me to check in and see those!

This may want the 80-85 area on this pullback. Watch that .300 right here, though.
JI
jimkane
Rep: 3,058
Posts: 33,089
Ah, I didn't refresh my page before posting that, only to see T beat my post by two minutes mentioning that .300 :-)
TO
TonyC
Rep: 99
Posts: 471
Originally posted by jimkane

Ah, I didn't refresh my page before posting that, only to see T beat my post by two minutes mentioning that .300 :-)

On the same page, are we?
TO
TonyC
Rep: 99
Posts: 471
yeah next area is @85 but there that main uptrend line sitting right in between the .382 and the current .300 level . If it does go to -85 level then it'll have to blow through that line wich would set things up for a 'line poke' that often springs price action back.And it will be the third contact point to the line, and odds usually favor the fade plays in this situation.
T
JI
jimkane
Rep: 3,058
Posts: 33,089
Great observation, T.

Okay, folks, is this third drive here at a 'spike line' going to do it? It sure 'sees' the area, but will this push up here to this obvious little bounce area be it? Or will it bounce strongly? Anybody long short-term intraday here?
JA
jarek
Rep: 94
Posts: 3,474
Originally posted by jimkane

...Anybody long short-term intraday here?


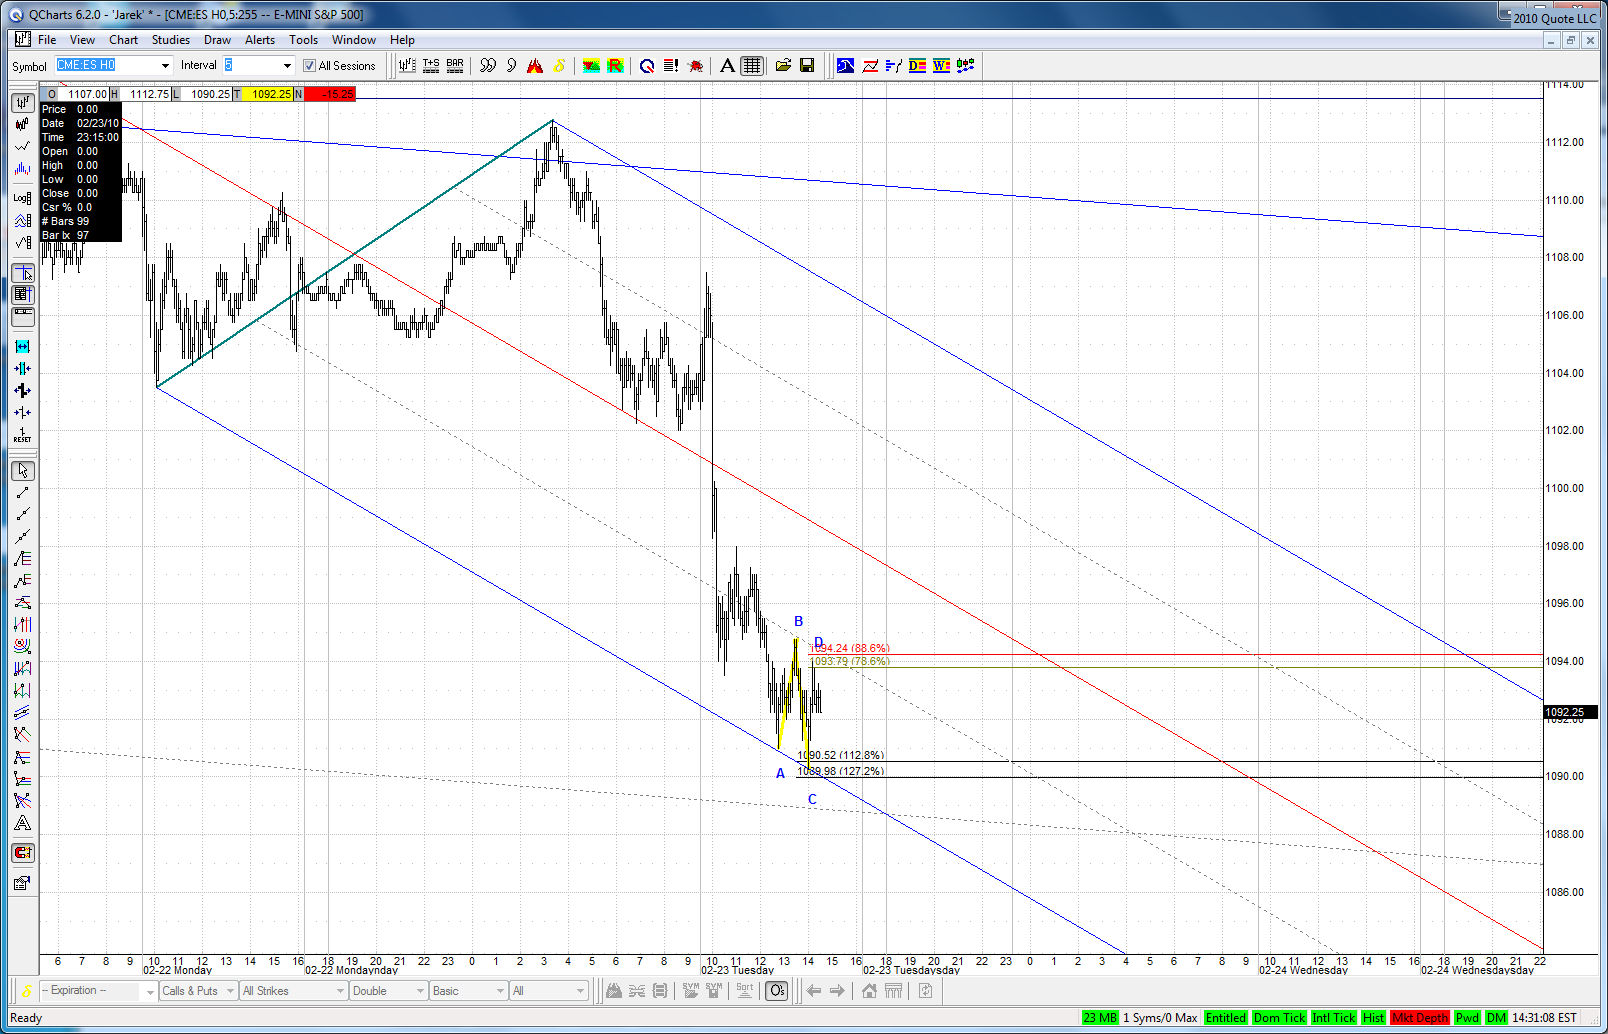
Me not. Watching the impact of this small TD ABCD here:

Click image for original size
JI
jimkane
Rep: 3,058
Posts: 33,089
Nope, it just slept for the rest of the session. It will be fun to watch Sunday night in GLOBEX with this trading in the upper end of the recent range. Will it be 24 out of 26 up sessions?