MyPivots
Sign In
JA
jarek
Rep: 94
Posts: 3,474
Here is the update of some of the long term charts I was presenting here in the last months.

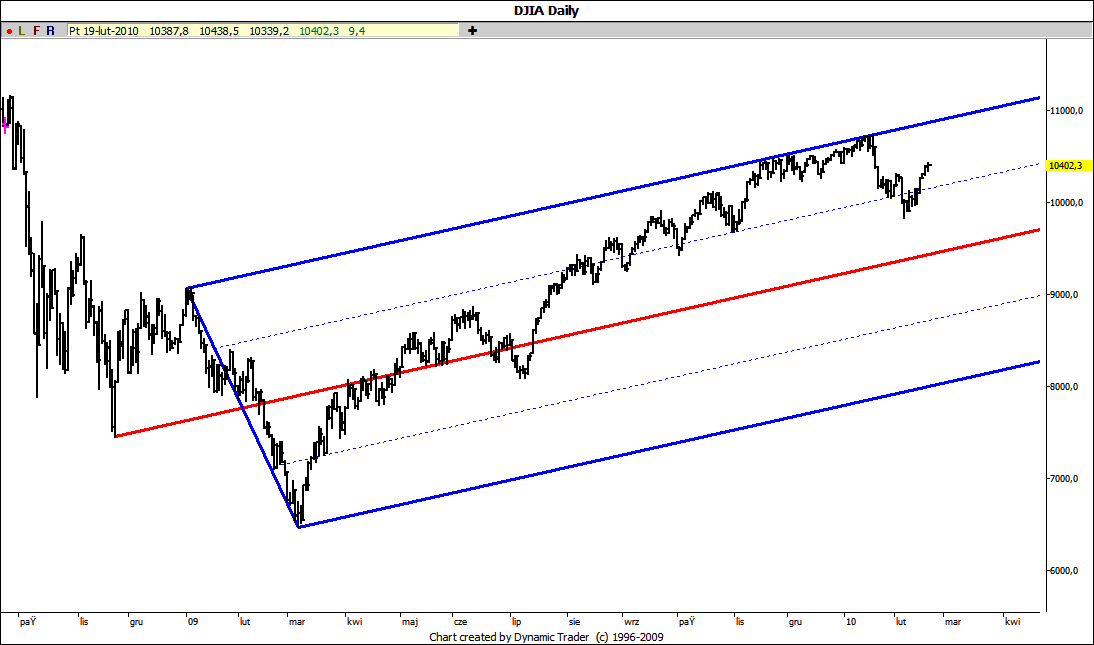
After dozen or so of unsuccessful attempts to overcome the upper ML DJIA has moved decisively into the direction of the main ML. However it didn't reach it and is now hovering around the division line:

Click image for original size


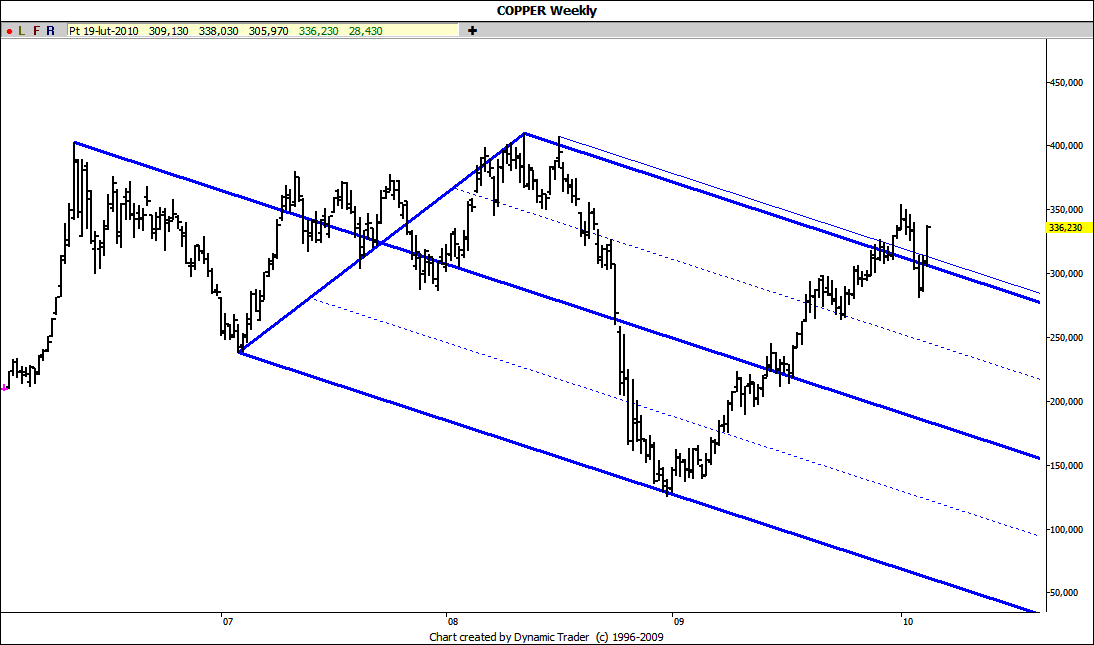
Copper shows no respect at all to its long term natural set moving through its lines back and forth:

Click image for original size


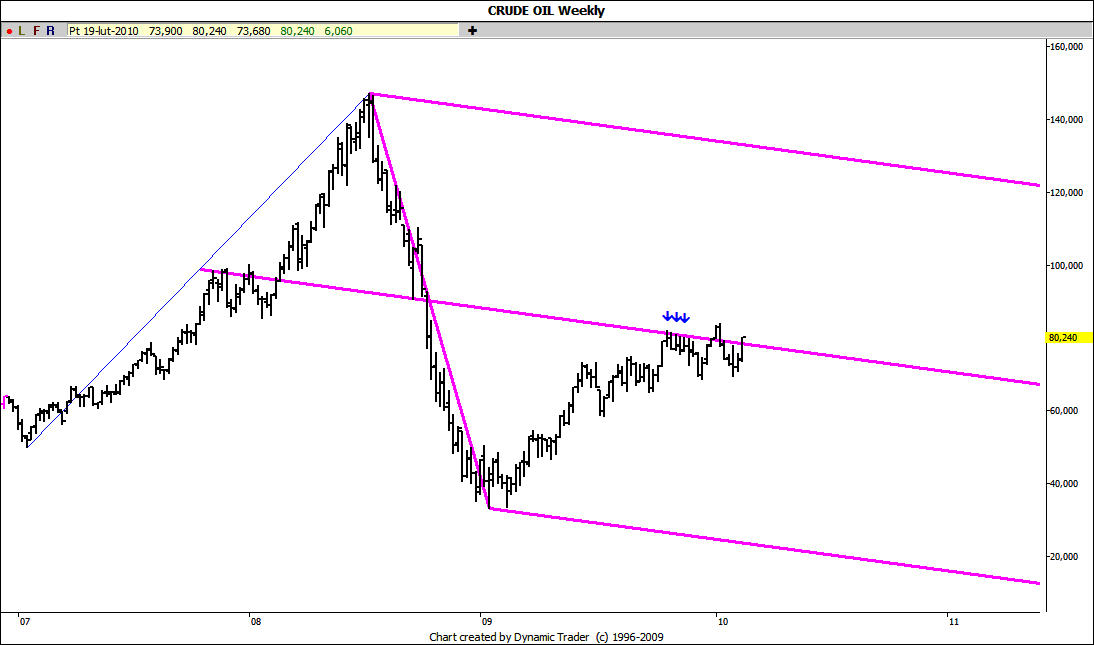
Crude is still hovering around the ML of its long term Schiff set what in my opinion looks more and more like just a pause in its long term upward march:

Click image for original size


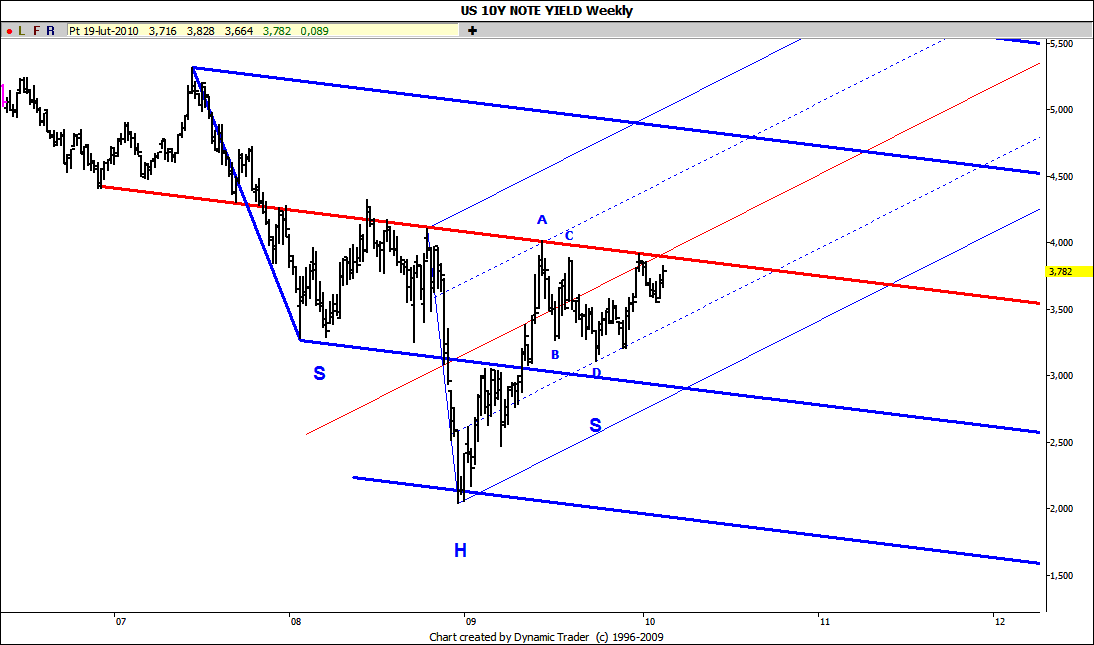
10Y yield is again approaching the potential neckline of its long term inverse head and shoulder pattern. If the rise doesn't stop here we may see much higher rates pretty soon:

Click image for original size
JI
jimkane
Rep: 3,058
Posts: 33,089
That surely is a great place to look for clues (hence my comment about the obvious little bounce spot), but 3D into a PTA is something to give a lot of weight to.
JI
jimkane
Rep: 3,058
Posts: 33,089
And yes, it is not a 'symmetrical' 3D, and that does detract a little from the pattern.
JI
jimkane
Rep: 3,058
Posts: 33,089
I surely want to watch this EXP ABCD here, with an ABCD in the CD leg (okay for me with an EXP, a deal breaker for a zig-zag ABCD).
JI
jimkane
Rep: 3,058
Posts: 33,089
Keep in mind, my view is that this '.300 with at least two key lines PTA' will likely produce some level of reaction.
JA
jarek
Rep: 94
Posts: 3,474
Originally posted by jimkane

I surely want to watch this EXP ABCD here...


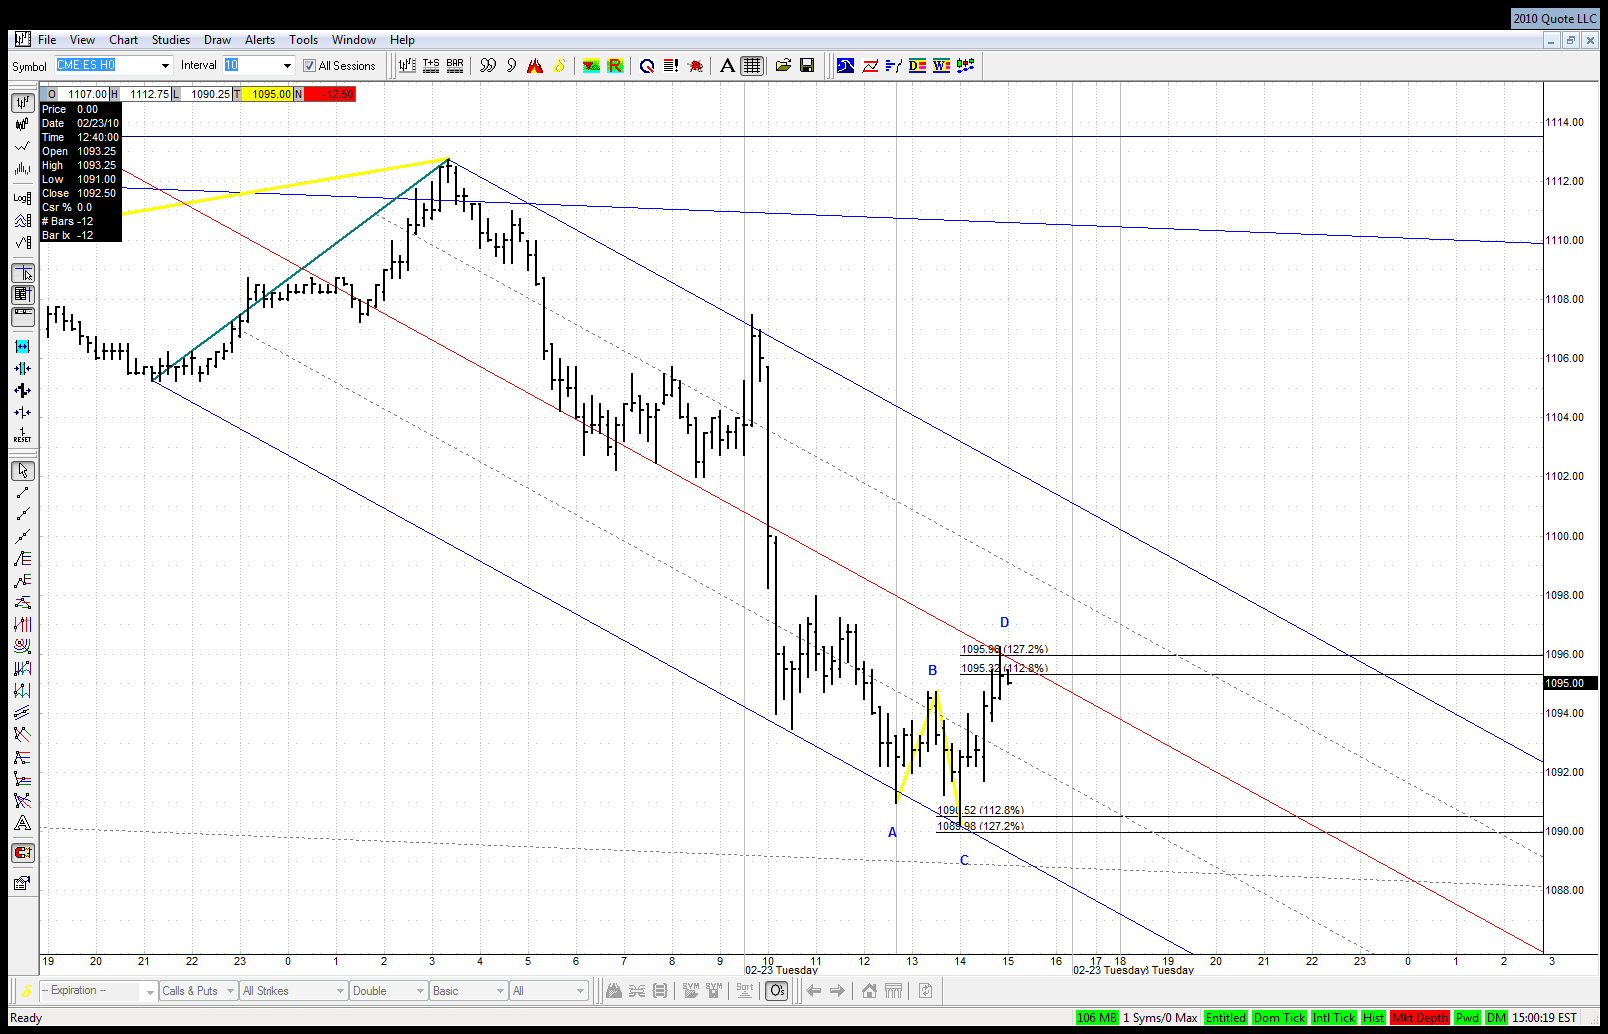
Here's the one:

Click image for original size
JI
jimkane
Rep: 3,058
Posts: 33,089
Yes, that's it, nice chart. So, if my 'context' read is correct, then I would expect a small reaction off that, perhaps back to a .382/.447 area, and then up and over. Let's see.
JI
jimkane
Rep: 3,058
Posts: 33,089
No sooner does he post that then it blasts up and over. It pulled back first off the EXP, as expected, to 94.25. And where was the obvious .447? 94.24. Hmmm.
JI
jimkane
Rep: 3,058
Posts: 33,089
Now it has five clear waves up, so I'm watching to see what happens with that. It may just keep pulsating up, or it may need a bigger correction after this sequence so far, or after the next push. Just giving it room to breathe.
JA
jarek
Rep: 94
Posts: 3,474
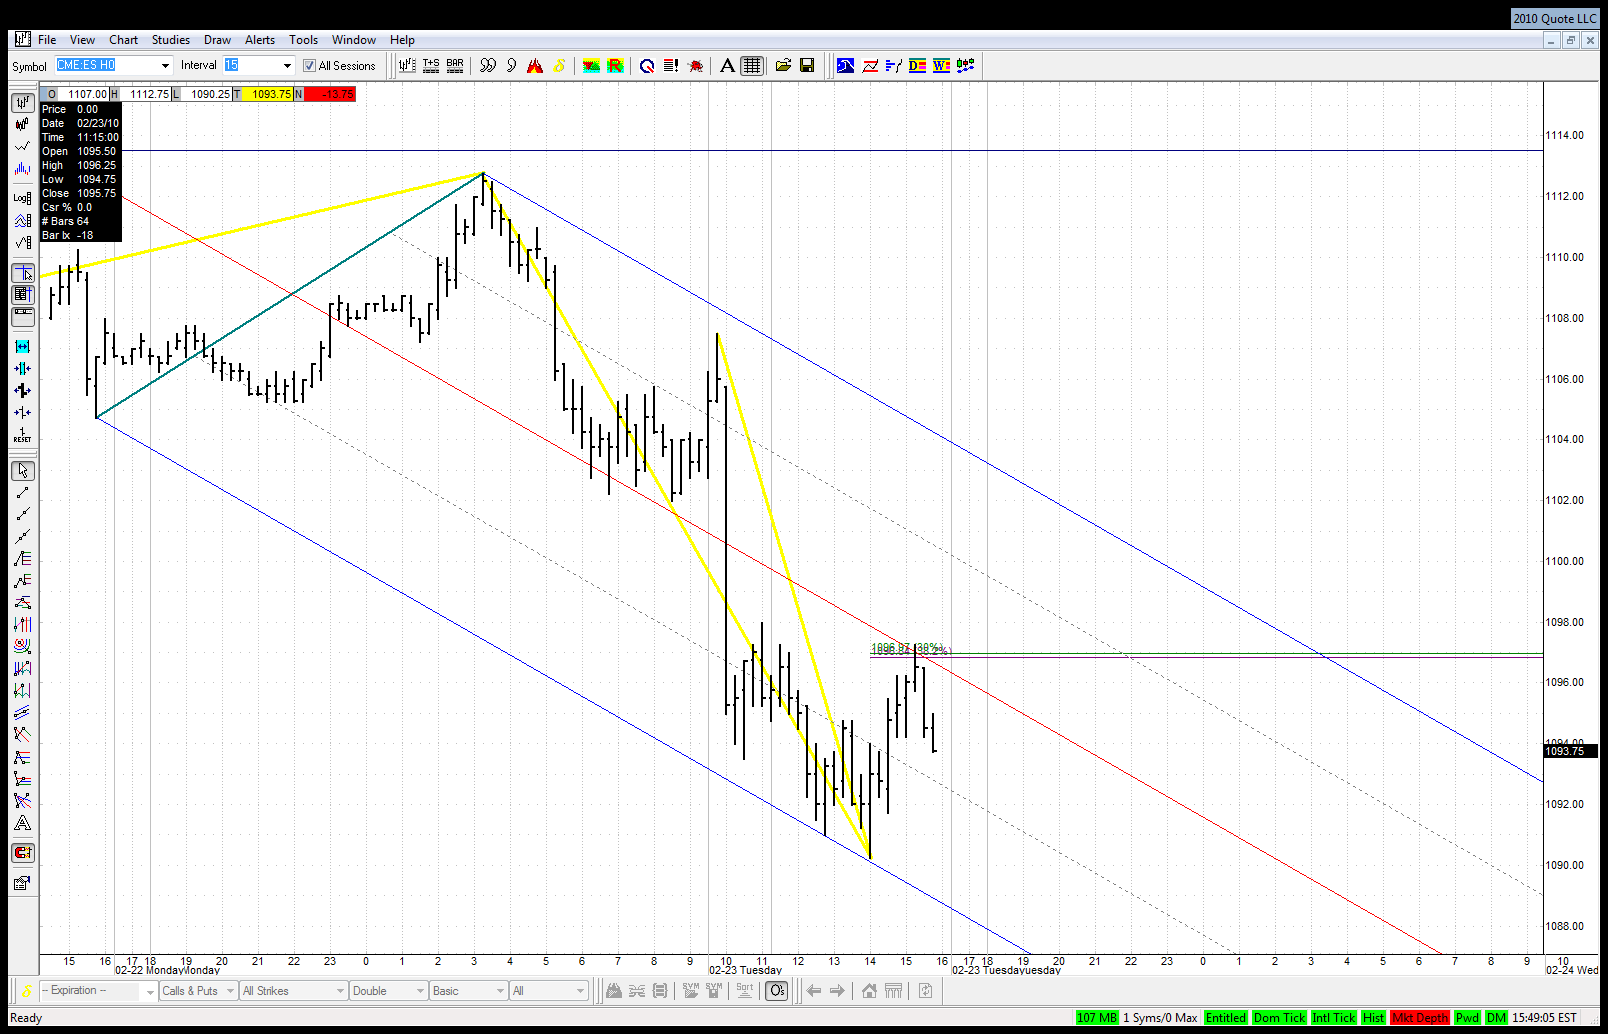
No pattern but interesting line and fibs at recent high:

Click image for original size
JI
jimkane
Rep: 3,058
Posts: 33,089
And lo and behold, after the five waves it corrects more (bigger correction than any on the way up so far in that little 5-wave). Now we see if this is a reversal or just the needed bigger correction. If this .300 area fails, it likely wants to do battle with the areas T and I mentioned earlier.
JI
jimkane
Rep: 3,058
Posts: 33,089
Nope, it just slept for the rest of the session. It will be fun to watch Sunday night in GLOBEX with this trading in the upper end of the recent range. Will it be 24 out of 26 up sessions?