Here is the update of some of the long term charts I was presenting here in the last months.
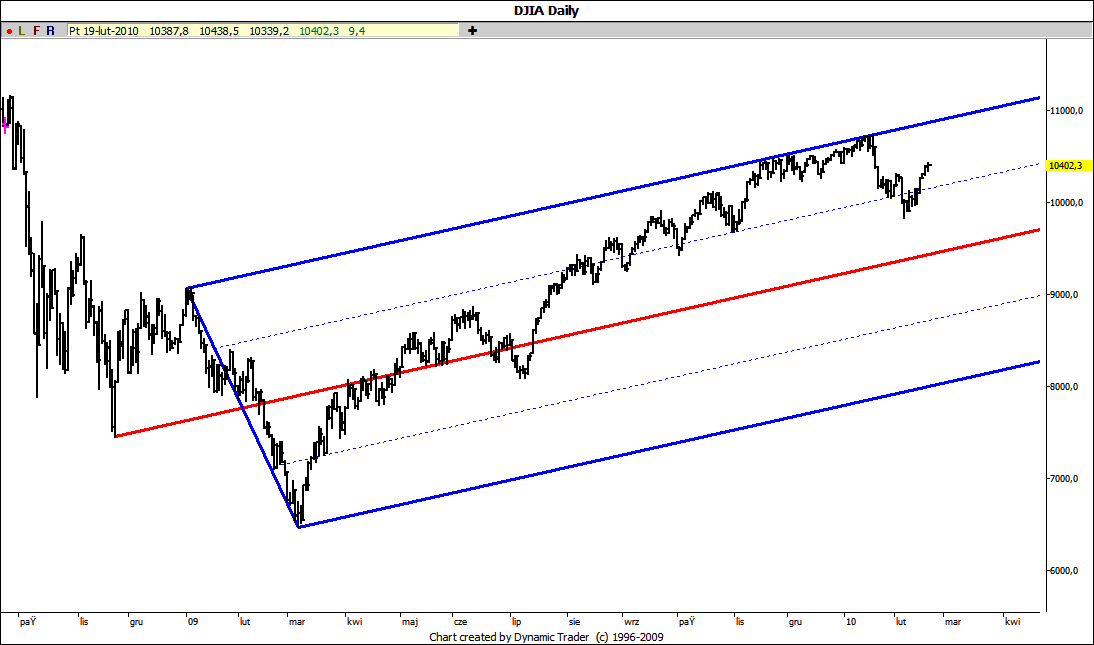
After dozen or so of unsuccessful attempts to overcome the upper ML DJIA has moved decisively into the direction of the main ML. However it didn't reach it and is now hovering around the division line:
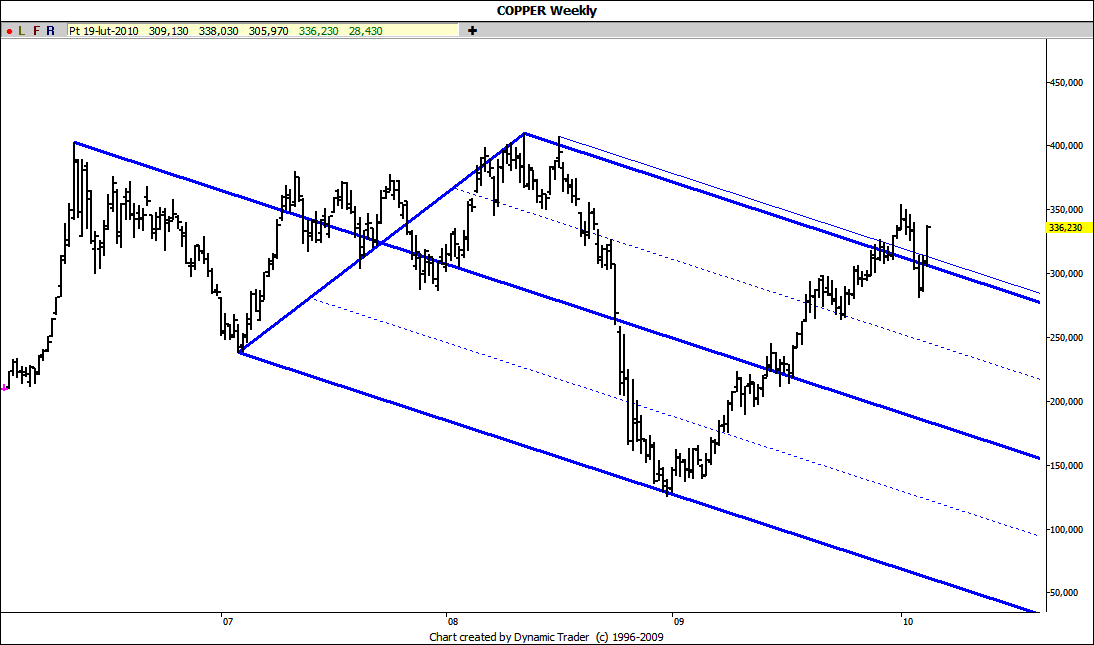
Copper shows no respect at all to its long term natural set moving through its lines back and forth:
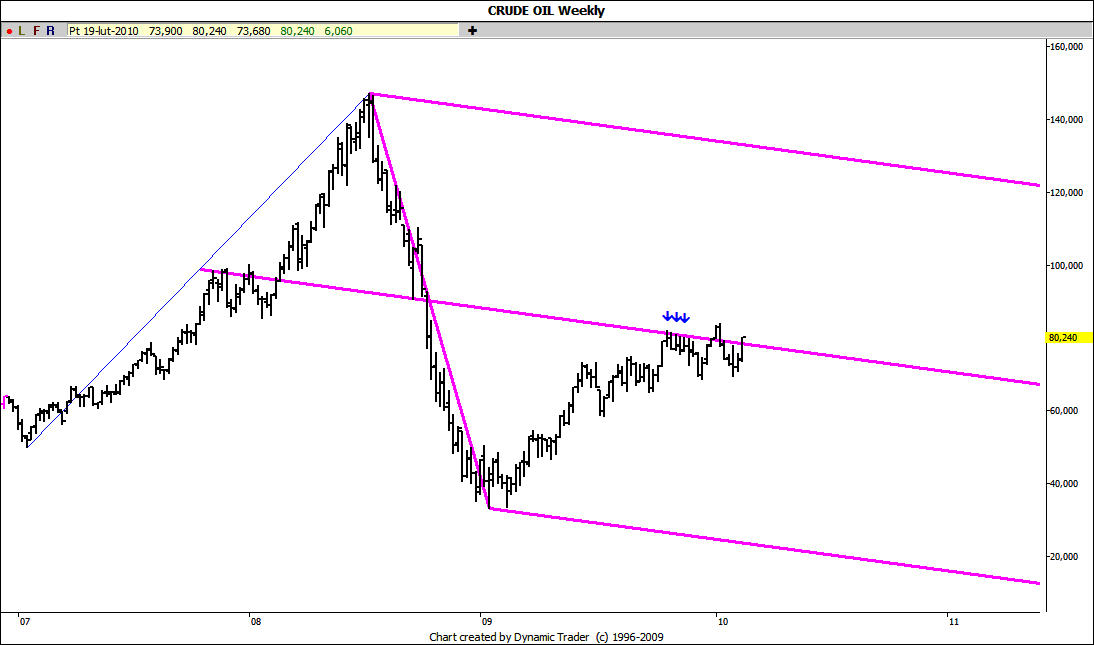
Crude is still hovering around the ML of its long term Schiff set what in my opinion looks more and more like just a pause in its long term upward march:
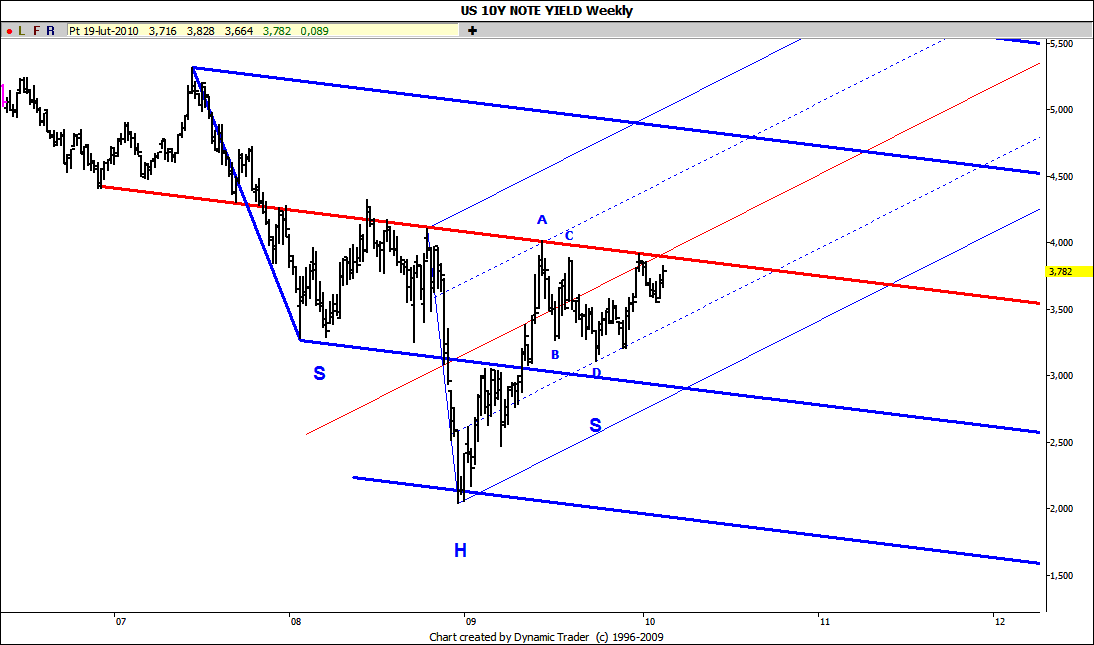
10Y yield is again approaching the potential neckline of its long term inverse head and shoulder pattern. If the rise doesn't stop here we may see much higher rates pretty soon:
JI
jimkane
Rep: 3,058
Posts: 33,089
Amazing how I posted in here before it dumped that it had that ready to dump look. But what is really curious/interesting is the change in character when they didn't come in for it in the usual spot. Instead of the quick dump and then a strong snap back and right back up, they just sat on it, and then continued to dump it. Now, it may be done dumping in here, but this is a clue I am watching that we may have had a serious shift in the character. I plan to stay on the short side bias intraday now until they show me there hasn't been a change.
JI
jimkane
Rep: 3,058
Posts: 33,089
Watch this .447 and 1.272 area here closely, as it surely 'sees' it. We'll know soon how serious these sellers are...
JI
jimkane
Rep: 3,058
Posts: 33,089
And right up off the area it went. It's very corrective looking, with deep overlapping swings, so I'll see what it does, but it likely will just head to a new HOD. Again, right off the area I said to watch...
Jim, the one man show :-(
JI
jimkane
Rep: 3,058
Posts: 33,089
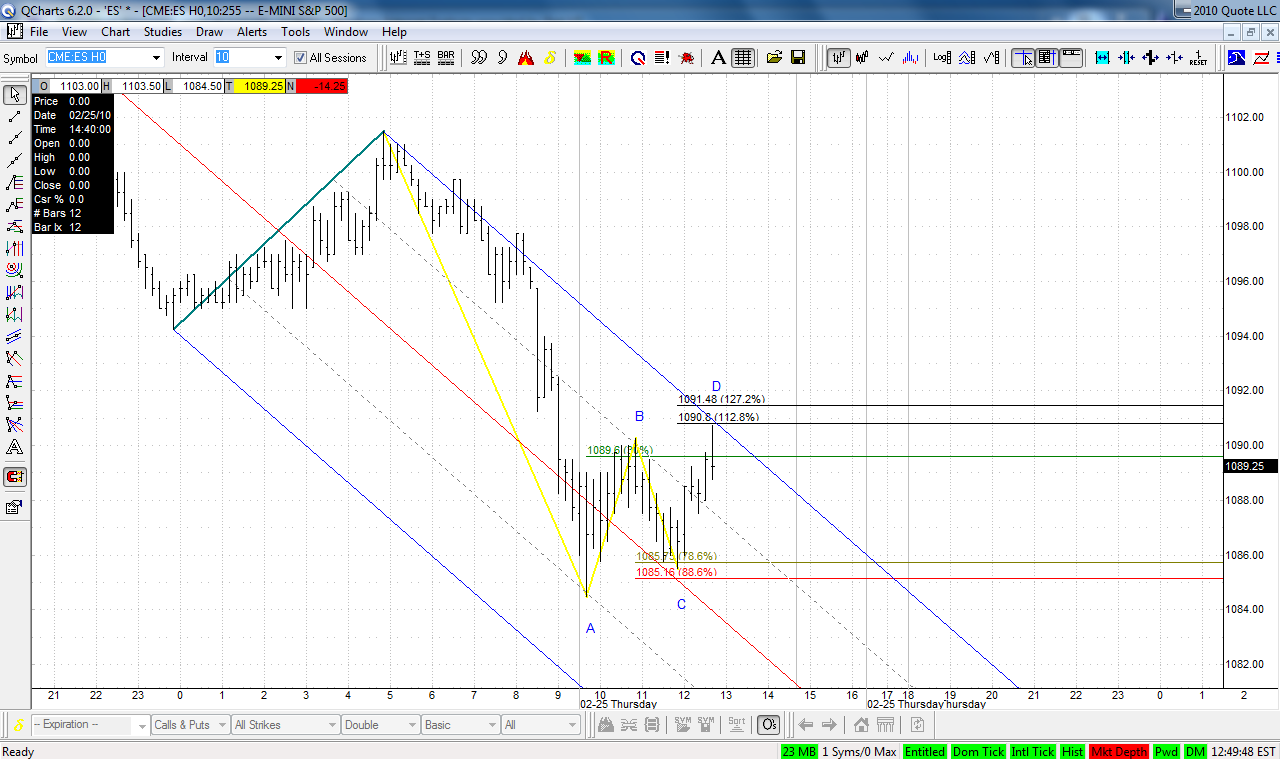
Now that's a very nice little dump there during GLOBEX. Did everyone see the .786 and set line intersection this rolled off of after that bounce up?
JI
jimkane
Rep: 3,058
Posts: 33,089
Great charts, jarek. I thought you were gone until next week?
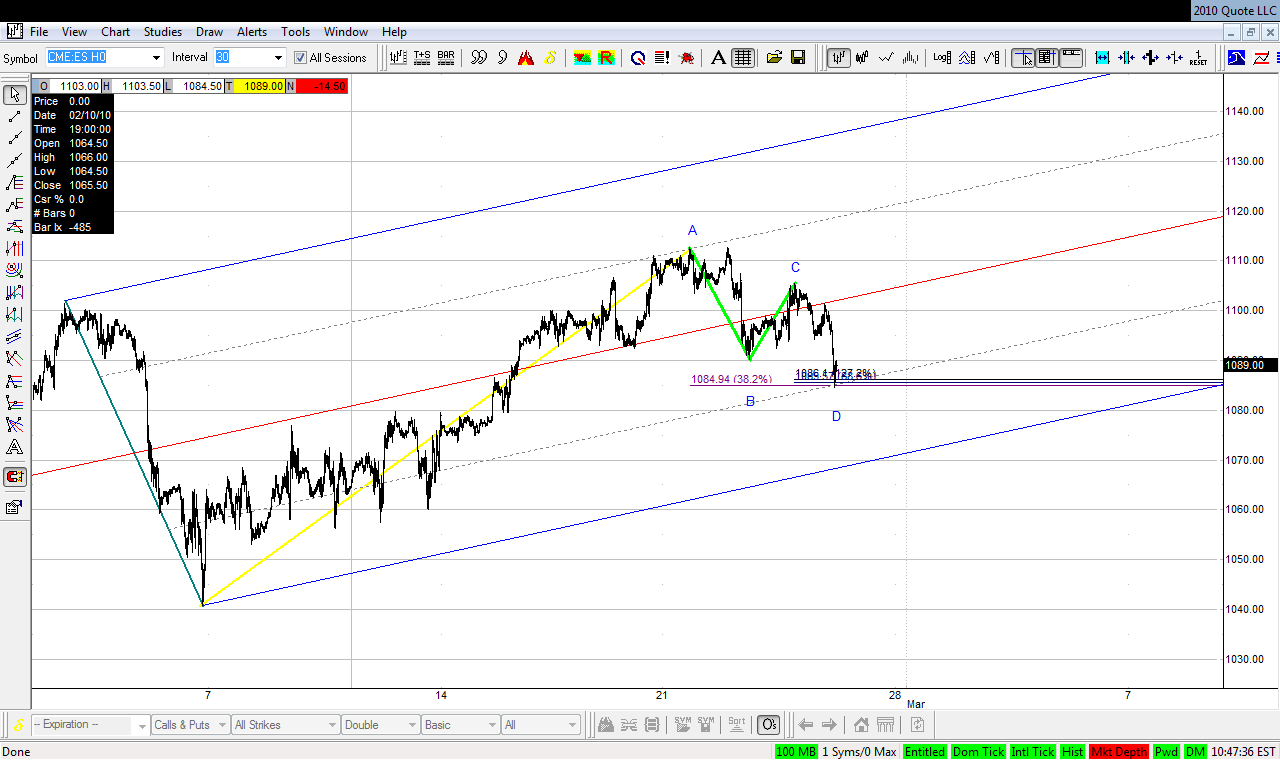
Myself, I'm watching this bigger ABCD very carefully, it's exactly what I look for in an uptrend. If the uptrend is still intact, an extraordinarily unpopular opinion (which is why I am considering it so carefully), this is exactly the kind of setup I'd be hoping for. Now, as you show, it sets up a smaller ABCD against it. While this may roll it down for a 3-4-5 finishing sequence (or just a continuation of the down move), a break over that is a major entry trigger for the bigger ABCD. So, there is a lot to give us information here.
JI
jimkane
Rep: 3,058
Posts: 33,089
Originally posted by jimkaneThis was timestamped at 13:28:55 yesterday. Note that the furthest move off the top at that point was 1.25 points. In other words, I noticed this 'look' it had as soon as it started to roll. I followed up with this post:
Be very careful in here, they are making it look like they want to dump it... It may be a trick, but it may not be.
"Amazing how I posted in here before it dumped that it had that ready to dump look. But what is really curious/interesting is the change in character when they didn't come in for it in the usual spot. Instead of the quick dump and then a strong snap back and right back up, they just sat on it, and then continued to dump it. Now, it may be done dumping in here, but this is a clue I am watching that we may have had a serious shift in the character. I plan to stay on the short side bias intraday now until they show me there hasn't been a change."
And then:
"Now that's a very nice little dump there during GLOBEX. Did everyone see the .786 and set line intersection this rolled off of after that bounce up?"
Everyone can look back at all the posts and follow the chart. It bounced at an area I expected (the second one, actually, not at the first one), went right to the most expect bounce area, then dumped into this big ABCD. While I wanted to point out how well this moved off area after area, here's why I put this post together. Notice how I saw a character change almost the second it was born. This is similar to the one commentary I posted when I sent the e-mail to Scott when I saw this happen in the daily chart 'context' for one of the big rollovers that may have been the start to the bear.
The point is not to say how cool is Jim, pointing that out as it just started. The point is, there was something I saw there, in the price action, in the trading, and it was exactly a correct read. Hence, I am saying, I think there was something observable that tipped off that this big selloff, down today over 20 points, was about to start.
That's just my opinion, but otherwise it would be quite a coincidence I posted that right as it just barely started to roll, only 1.25 points at the most off the top. That's what price action can sometimes bring to the table in conjunction with the methodology.