Here is the update of some of the long term charts I was presenting here in the last months.
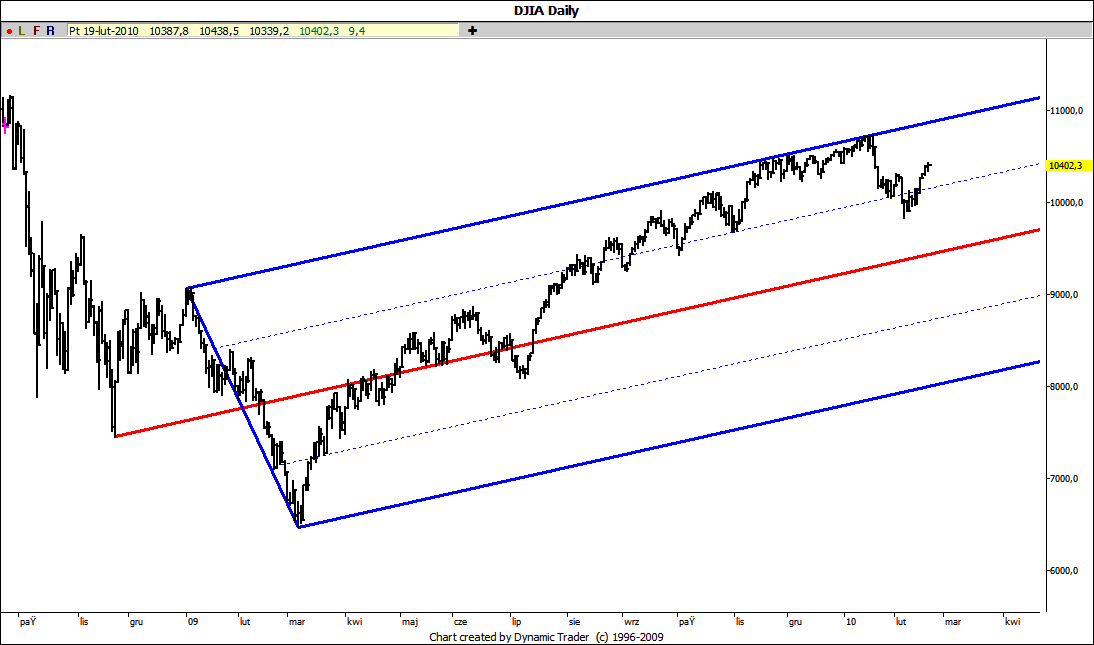
After dozen or so of unsuccessful attempts to overcome the upper ML DJIA has moved decisively into the direction of the main ML. However it didn't reach it and is now hovering around the division line:
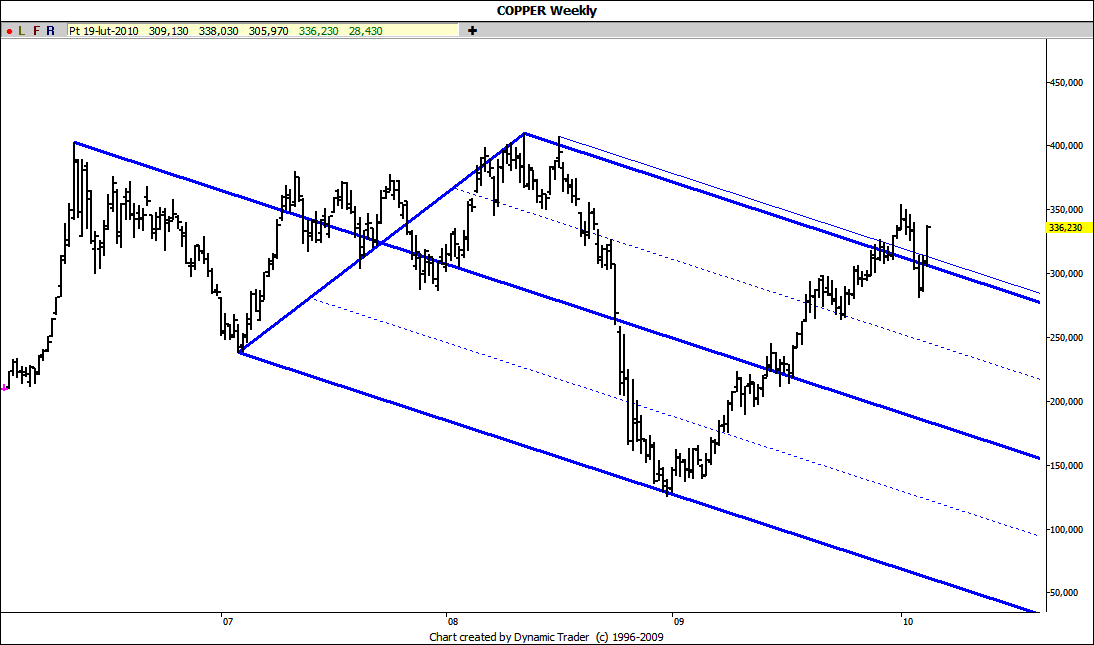
Copper shows no respect at all to its long term natural set moving through its lines back and forth:
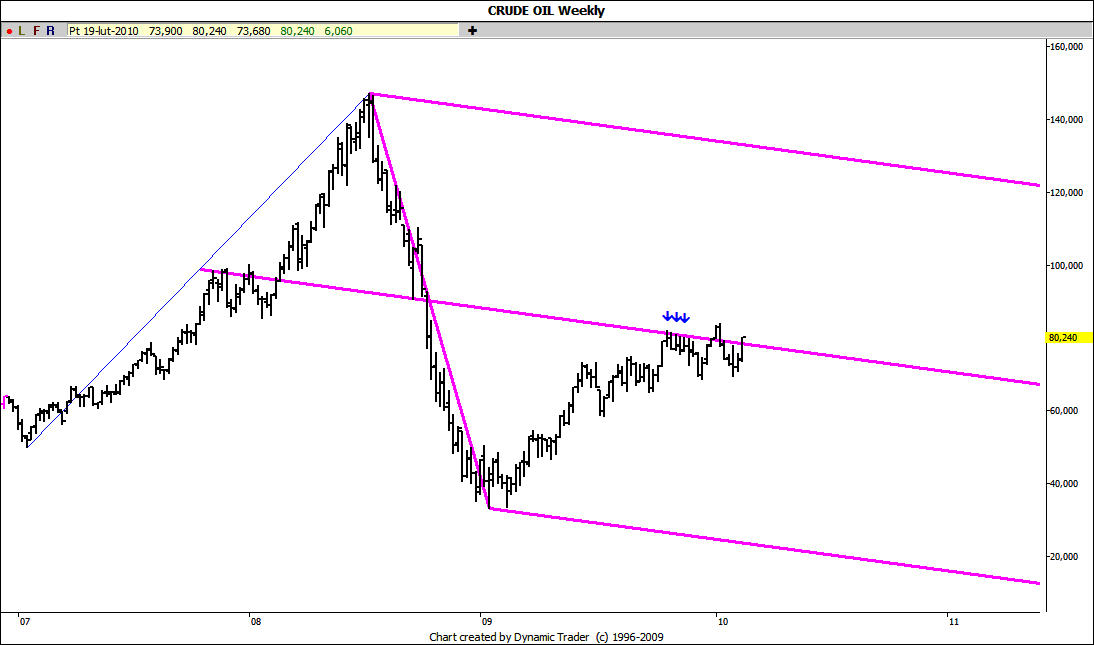
Crude is still hovering around the ML of its long term Schiff set what in my opinion looks more and more like just a pause in its long term upward march:
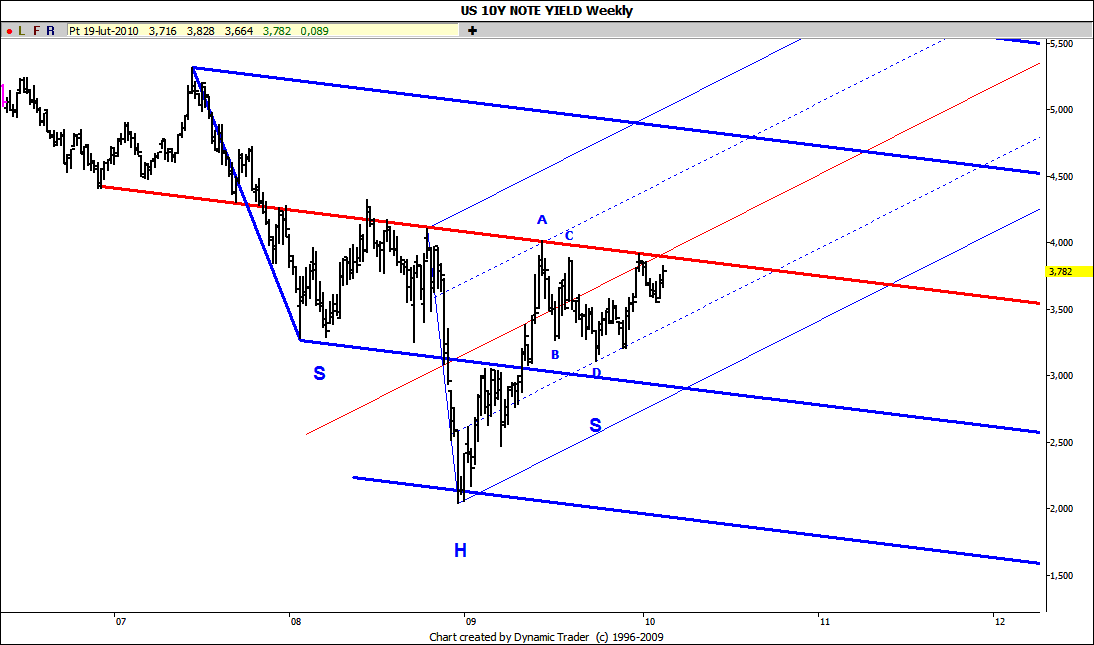
10Y yield is again approaching the potential neckline of its long term inverse head and shoulder pattern. If the rise doesn't stop here we may see much higher rates pretty soon:
JI
jimkane
Rep: 3,058
Posts: 33,089
Great chart, jarek. Now it should be clear why after the 5-wave sequence into that area it has fallen right off. Now it's pulled back to the key set line for a 'W2' here, so what the greater intent is, we should know soon.
JI
jimkane
Rep: 3,058
Posts: 33,089
Kind of cool how cash is closing at such a critical spot. Maybe we see something in the fifteen minutes of after cash, or later in GLOBEX. Very cool action today.
JA
jarek
Rep: 94
Posts: 3,474
I'll be out till Saturday with limited chances to post (if at all). Good trading!
JI
jimkane
Rep: 3,058
Posts: 33,089
See you after that, jarek. Great posts today.
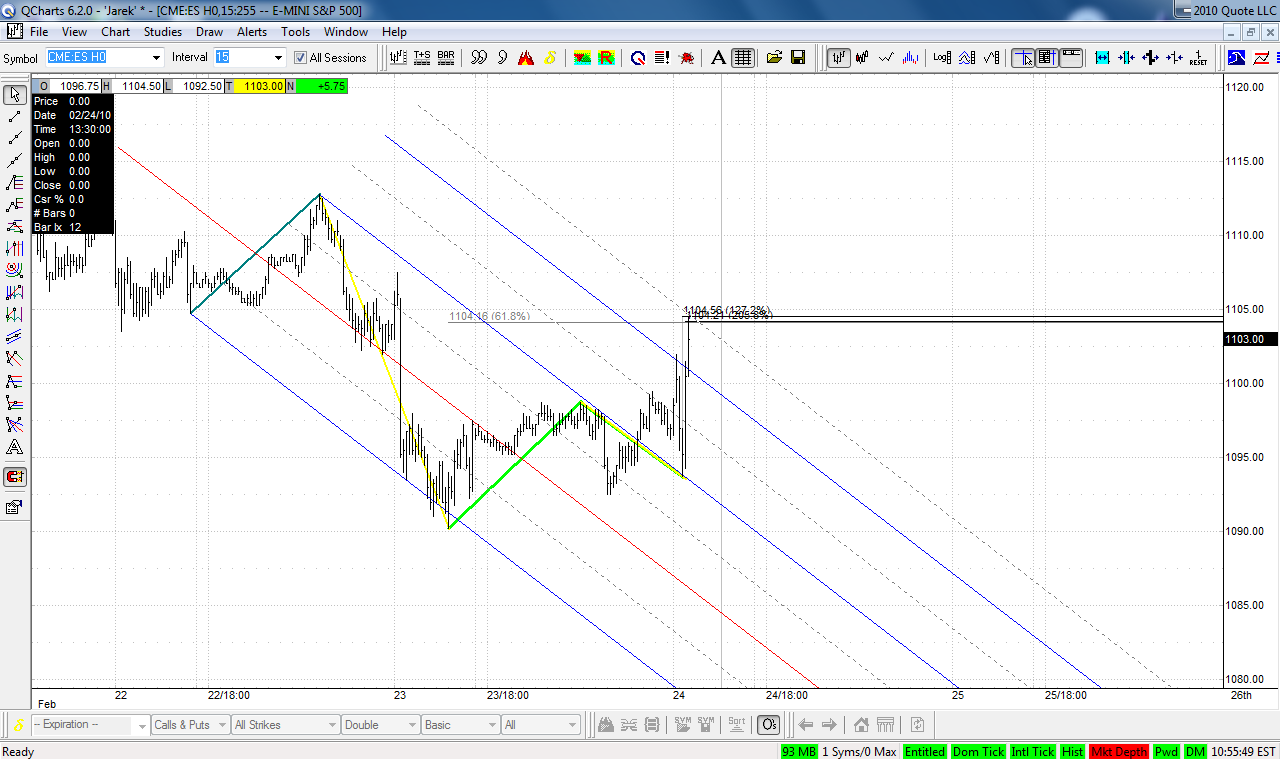
Okay, look at that explosion right off my 'W2' dual converging set lines, up four points in a blink. Very cool. All my mentor students should be able to find these two sets 'with ease'.
JI
jimkane
Rep: 3,058
Posts: 33,089
Push up still going, now over that recent high. This played out exactly as I laid out. Right back to a typical 'W2' area, and then up to new highs. Typical 'W2' in that it was what some traders would call 'a brutal shakeout'. Everyone should study this on 1 and 3-min charts, as it is very important stuff as far as the concepts. And look at how it is right at the upper lines now. Just way, way cool stuff, in my opinion.
JI
jimkane
Rep: 3,058
Posts: 33,089
It possibly could be, jarek, but it is technically 'ugly'. I see that as having an ABCD in the CD leg, a deal-breaker for me. One might push the envelope here and try to see the entire middle of that as a TD ABCD in the BC leg, which, I guess, might be possible. I expect this to break to the upside, as the uptrend continues its march. We'll see.
JI
jimkane
Rep: 3,058
Posts: 33,089
And no sooner did I post that than it breaks to the upside. Watch the 1.272 off this last pullback, just to see what it does there. Also watch this 1.128 it 'sees' at 1105.50, in case that was nothing but a stop gun after all that chop listening to 'Bernquacke' testify.
JI
jimkane
Rep: 3,058
Posts: 33,089
Be very careful in here, they are making it look like they want to dump it... It may be a trick, but it may not be.