Here is the update of some of the long term charts I was presenting here in the last months.
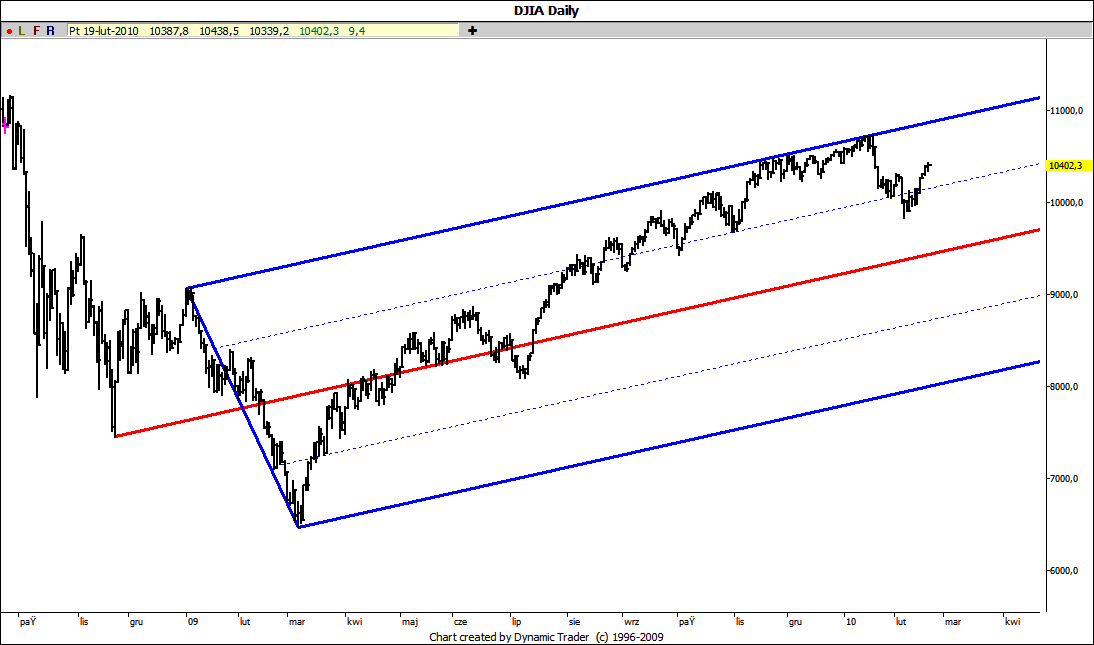
After dozen or so of unsuccessful attempts to overcome the upper ML DJIA has moved decisively into the direction of the main ML. However it didn't reach it and is now hovering around the division line:
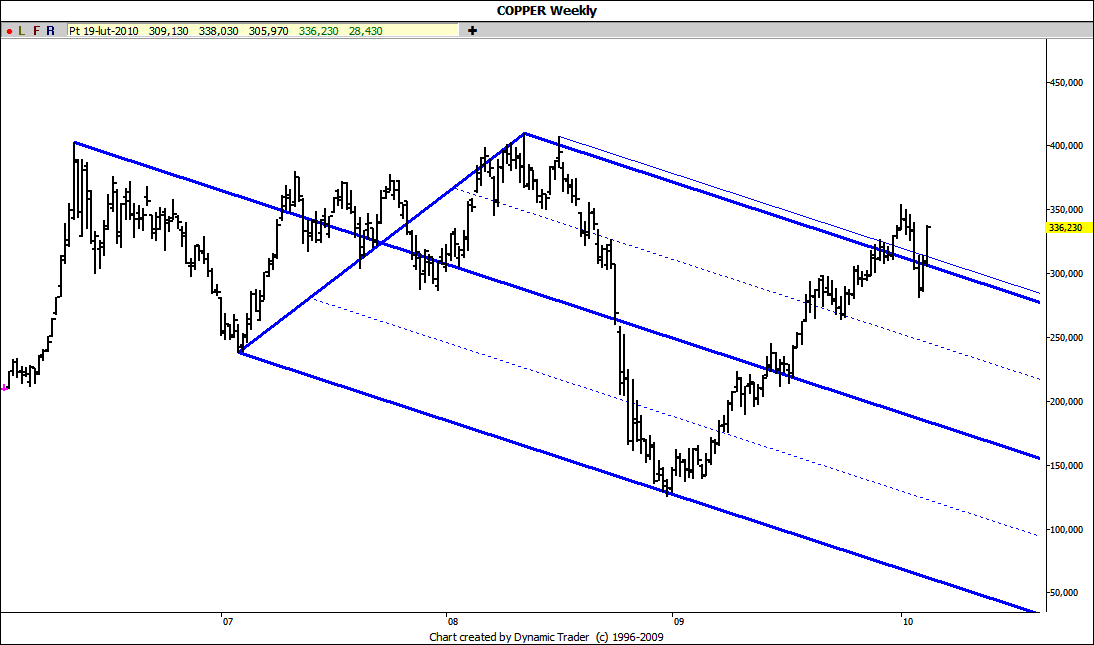
Copper shows no respect at all to its long term natural set moving through its lines back and forth:
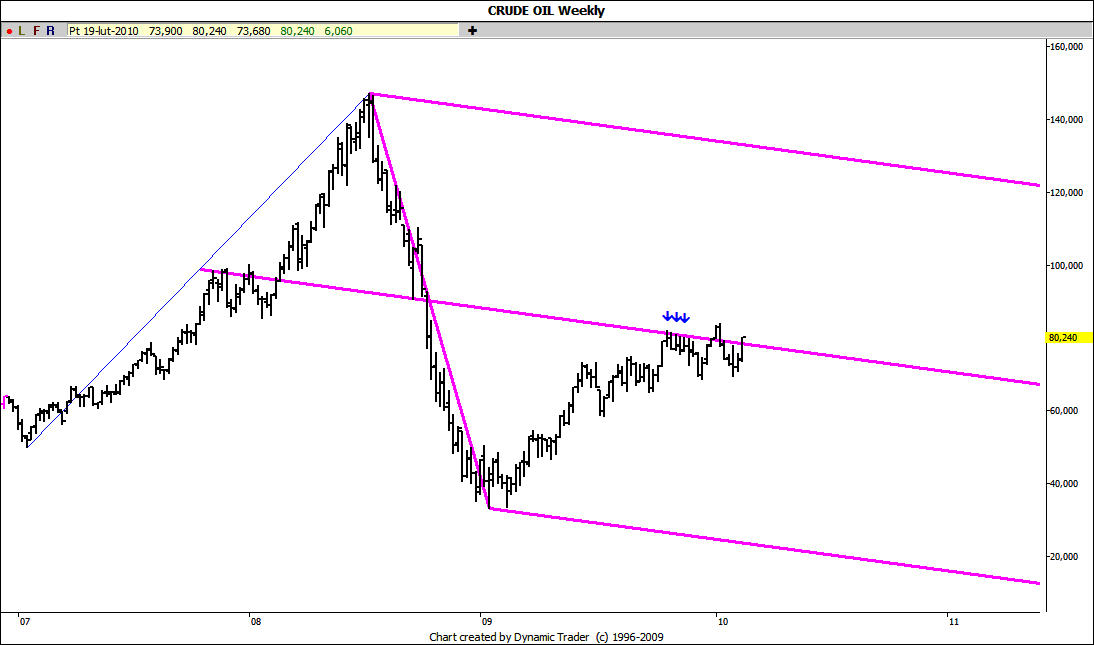
Crude is still hovering around the ML of its long term Schiff set what in my opinion looks more and more like just a pause in its long term upward march:
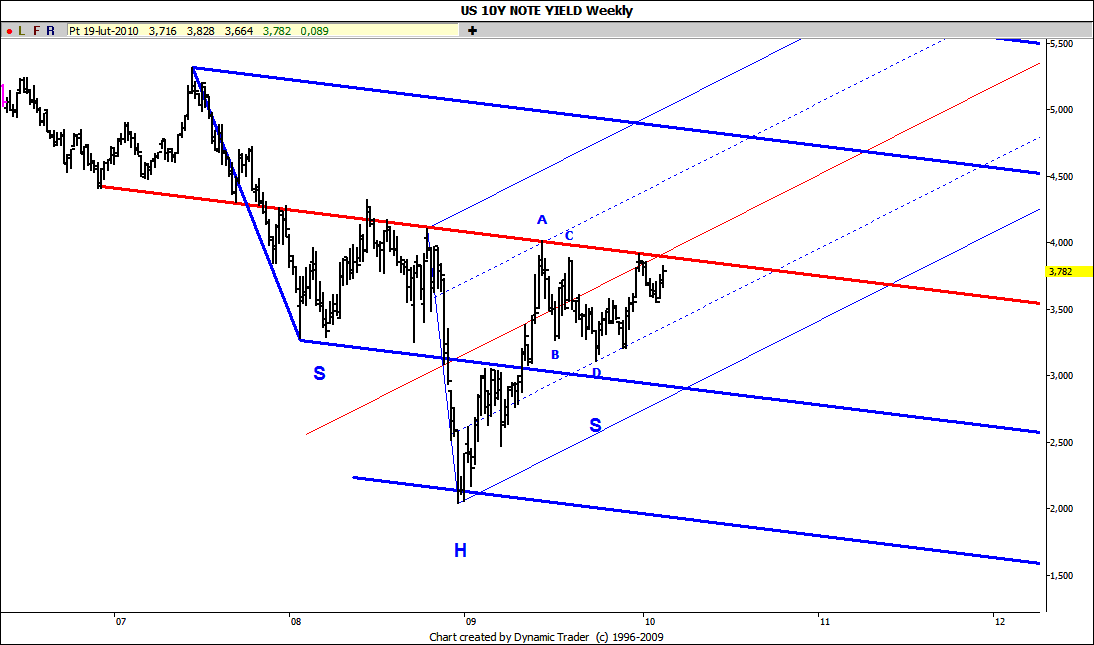
10Y yield is again approaching the potential neckline of its long term inverse head and shoulder pattern. If the rise doesn't stop here we may see much higher rates pretty soon:
JI
jimkane
Rep: 3,058
Posts: 33,089
Got to say, folks, I'm loving this action, loving this methodology today. Not that I don't love it most days, but how nice is all this? Especially when accompanied by my previous comments laying the groundwork, and with jarek's nice chartwork.
JI
jimkane
Rep: 3,058
Posts: 33,089
Okay, the first two small overhead areas were taken out like they didn't exist. That big ABCD is exerting strong influence. So far, just goin' with the flowin', letting nature take its course. The 'big' key area for a checkback is coming up fast, so be ready to watch that closely.
JI
jimkane
Rep: 3,058
Posts: 33,089
WOW, it just illiquidity gapped right up and through that next area! Staying with this. WOW!!!!!!!!!!!!!!
JI
jimkane
Rep: 3,058
Posts: 33,089
Too bad this is a one man show, as this is very, very cool stuff from a learning standpoint.
JI
jimkane
Rep: 3,058
Posts: 33,089
Watch this little tick ABCD for continuation clues. Just giving it room...
JI
jimkane
Rep: 3,058
Posts: 33,089
Everyone sees the major, key line here, right? The most key line at this time of all. It's right here, where it obviously 'sees' it. It may only check it back and then up and over, or it may bring it in for a good-sized correction then back up, or it may roll it. Set up the areas and see what it does at each spot.
JI
jimkane
Rep: 3,058
Posts: 33,089
I sure wish I could show this, live, to everyone. Not only is there the key overhead downsloping lines here, this is also a 'backtest' of my primary upsloping line here that was 'tested' from above many, many times before it gave way. A real 'X marks the spot' here. This is a super-critical juncture. Imagine if this checked it back to an expected area, then up and over to keep this ABCD alive. If the ABCD is not to play out longer-term, this is a key failure spot. This is just soooooo cool.