ES Short Term Trading 5-11-10
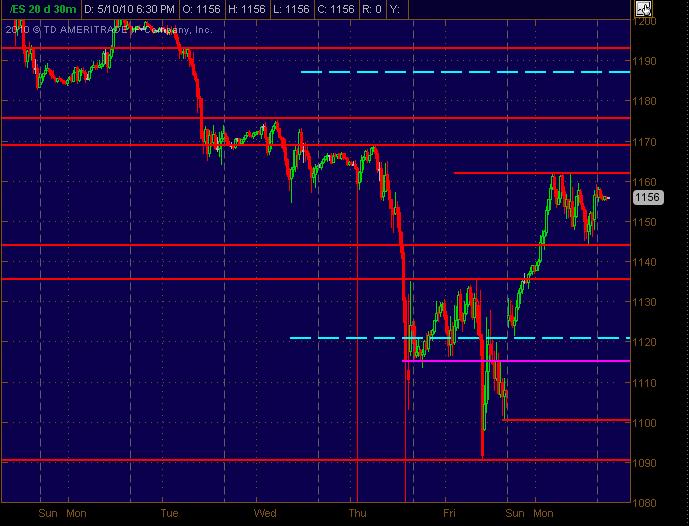
Here's the Price Action Support Resistance levels that I see. With the way the market has acted with all the volatility, they're spaced relatively wide apart ... and should be, as always, taken as "zones" give or take a point or two in this market.
Here's the 30m chart with S/R lines in Red and the Cyan dashed lines are the Wkly pivot prices ... Magenta line is semi-significant. Hope this is a helpful map.
Here's the 30m chart with S/R lines in Red and the Cyan dashed lines are the Wkly pivot prices ... Magenta line is semi-significant. Hope this is a helpful map.
I hadn't connected the two concepts but now I see how that makes sense. Thanks for re- pointing that to my attention....
You mentioned the RTH midpoint and I think that is a viable concept. If we can't hold above a RTH high or low then we will try and test the midpoint of that range...an area to research...thanks!!
You mentioned the RTH midpoint and I think that is a viable concept. If we can't hold above a RTH high or low then we will try and test the midpoint of that range...an area to research...thanks!!
Originally posted by PAUL9
Bruce,
your comment about trading back to the midpoint of the AH (Overnight) of the preceeding day was one of the rudimentary observations I had made weeks ago when I was trying to figure out how in the world to use AH PA, is it predictive?
The charts I showed (AH PA Only, included the 50% retracement level of the >>> previous day's AH activity). my general assumption at the time was that all other things being equal (which they never are!), if 50% of the previous day's AH range acts as support, higher probability for a move to take out current AH H (if 50% of prior day's AH range acts as resistance, higher prob of taking out AH L).
Think about it.
Markets constantly look for re-assurance by retracing moves; in that retracement, the chart pivot point (not floor trader pivots, I'm talking about a swing price point, a swing H or swing L) tells you what price is making buyers or sellers salivate. In order for prices to move, buyers have to more aggressiveness than sellers, or vice versa.
A pure 50% rettracement of the RTH can also have importance.
we have gaps all over the place! several above....and a huge one below. kind of a weird area to trade.
I'm going to be more cautious on buying into the drops as I'm wondering if all the big traders who missed that O/N rally on Sunday just want to push it down to buy into at much lower prices....MUCH lower beyond my comfort zone for fades...
That coupled with the neutral day yesterday could lead to a great trend day....not sure which way yet...
45 - 47 is top dog of volume in O/N....no surprise if we look at Yesterdays lows and how that formed...650 - 670 still huge in YM
That coupled with the neutral day yesterday could lead to a great trend day....not sure which way yet...
45 - 47 is top dog of volume in O/N....no surprise if we look at Yesterdays lows and how that formed...650 - 670 still huge in YM
agree...I'm using the most recent areas which are obviously the O/N numbers...I'm long the 42.50 but only for 44.25 as gap in data there as
Originally posted by TraderF
we have gaps all over the place! several above....and a huge one below. kind of a weird area to trade.
Bruce,
I think your observation about Big Money unwilling to "pay-up" yesterday is right on, and an excellent explanation of the lack of convincing volume yesterday.
I think your observation about Big Money unwilling to "pay-up" yesterday is right on, and an excellent explanation of the lack of convincing volume yesterday.
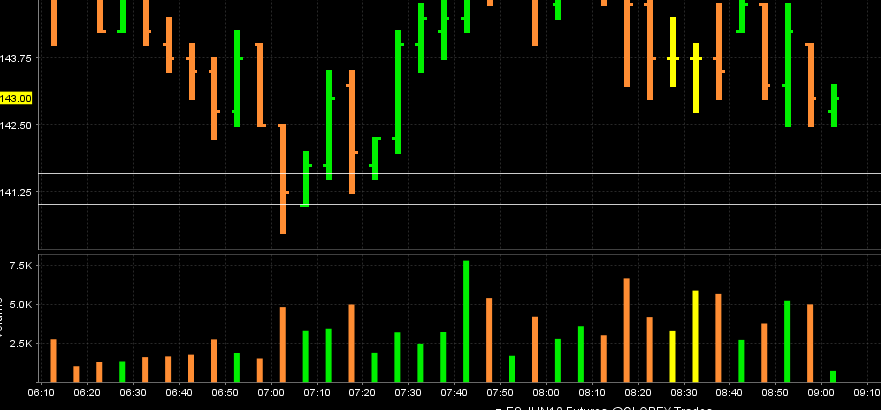
coveed at 45.50...had two...I fiqured with that gap in the data and volume above it would be a magnet to pull price up ..here is a crude chart of the gap...look at 8:50 bar for gap
prefered trades will be on the long side as we will have O/N midpoint and gap fillers looking to get something....below 43.50 to get long would be ideal...so we can use that 46 - 47 area to target...still using caution though
in the back of my mind is the concept of that 51 and how we went up through it and then down as if it wasn't there in O/N.......makes me even more cautious today as they seem to keep going when they do that
air at 46 .50...and O/N midpoint hit
1156-1157 looking more and more significant today.
It is:
- yesterday's VAH and VPOC
- gap fill resistance
- prior support
It is:
- yesterday's VAH and VPOC
- gap fill resistance
- prior support
Originally posted by redsixspeed
Originally posted by feng456
followed my plan to the letter
==================================================================
Hey feng;
Record your trade from time to time. Call the trade as you
see it setting up, record what you say then go back later
listen to what you did right. This may be a good teacher...
You might also want to record what you're up to in the Trading Journals section of the site. Create a new topic for yourself and post what you're up to and when you didn't follow your plan.
Emini Day Trading /
Daily Notes /
Forecast /
Economic Events /
Search /
Terms and Conditions /
Disclaimer /
Books /
Online Books /
Site Map /
Contact /
Privacy Policy /
Links /
About /
Day Trading Forum /
Investment Calculators /
Pivot Point Calculator /
Market Profile Generator /
Fibonacci Calculator /
Mailing List /
Advertise Here /
Articles /
Financial Terms /
Brokers /
Software /
Holidays /
Stock Split Calendar /
Mortgage Calculator /
Donate
Copyright © 2004-2023, MyPivots. All rights reserved.
Copyright © 2004-2023, MyPivots. All rights reserved.

