ES Short Term Trading 5-11-10
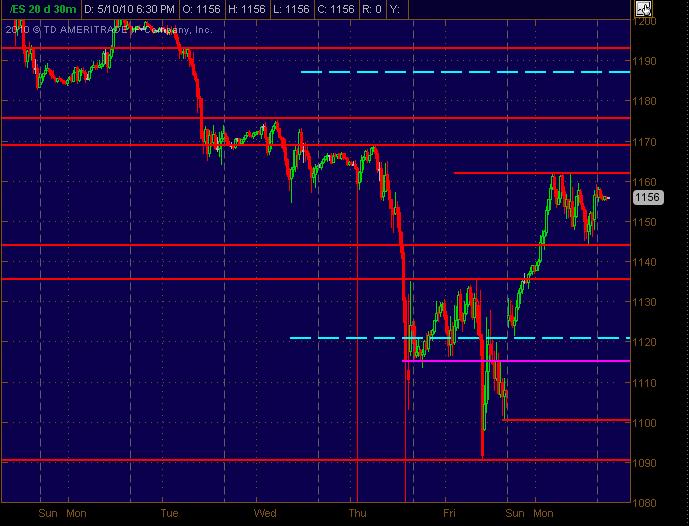
Here's the Price Action Support Resistance levels that I see. With the way the market has acted with all the volatility, they're spaced relatively wide apart ... and should be, as always, taken as "zones" give or take a point or two in this market.
Here's the 30m chart with S/R lines in Red and the Cyan dashed lines are the Wkly pivot prices ... Magenta line is semi-significant. Hope this is a helpful map.
Here's the 30m chart with S/R lines in Red and the Cyan dashed lines are the Wkly pivot prices ... Magenta line is semi-significant. Hope this is a helpful map.
Click image for original size
Click image for original size

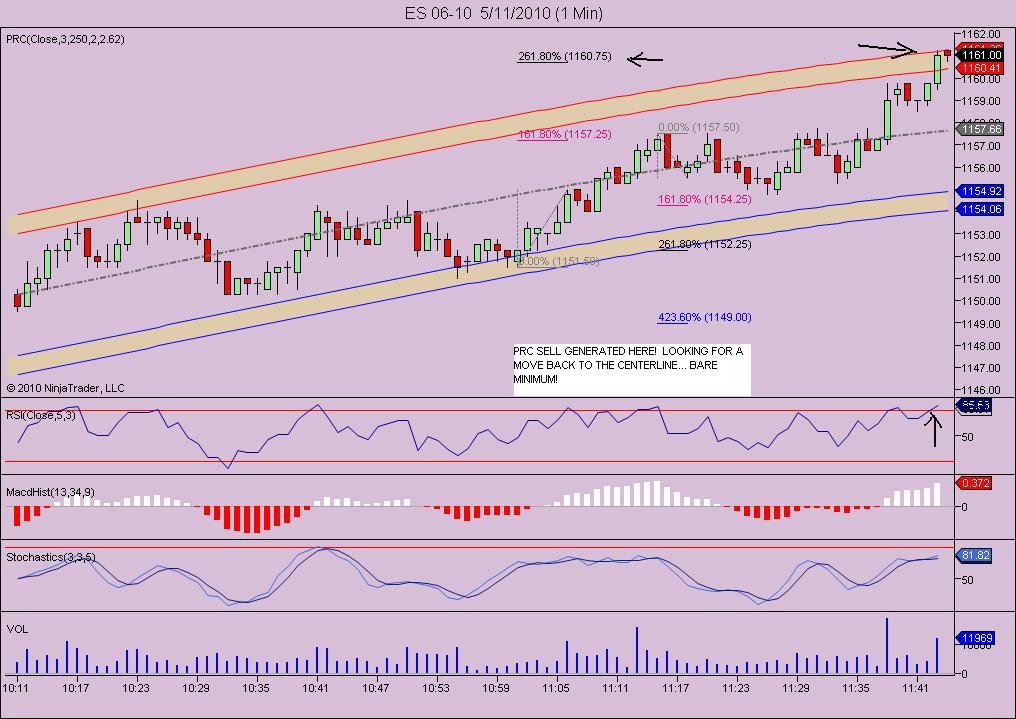
THIS IS A PRC SELL! 1159.50!
The sell zone on the prc is 1159.75-1160.75 and i have a one min proj at 1160.75
I'm on 61.25 and may be way too early for this...air at 58 ..
Thanks Bruce that was helpful. My biggest problem is fear of missing the move and getting in to early. I know this but continue to enter early instead of waiting for crisper entries. I believe that for a longer term trade a test into the 73-75 area is ideal with a close back under the 50 day. Then ride it down trailing a stop.
STOPPED EARLIER AT 58.75 loss of 2 ... Now short 2 at 1159.50....
Click image for original size
..wish me luck!!!
here are my thoughts on where my up bias is coming from.....
we had that huge gap w/ showed clear strength. when i saw it that morning, i knew it would max fill 50% if that.....
See my previous chart...i'm not much into patterns but its a flag pole type pattern (the down channel). So you have clear strength, then profit taking....it builds up strength and then breaks out in a continuation to where the strength originally occurred.
To second my theory......it would be hard to initiate a short and hold it for a while w/ out covering against that clear strength....so those attempts will push it down some, but eventually break that resistance. Once that resistance breaks, there will be a lot more bottled up strength to push it up much further.
i guess we will see. My plan was to go long and bet on that theory....i should have walked away once in and set alerts. i wasn't able to pick up enough contracts as my minimum order only got filled. my original first target was 57....and really wanted to see if 72 hit but would have had to use runners which i didn't get.....before you say it....i agree 72 is a reach....but crazier stuff has happened....now the question is will it happen today....tomorrow....or at all?
traders with longs will put stops at 54.75 so that is target for runners IF ( a big if)we caught the high for now...that would be above peak volume and that retest of the hour high from before
sure would have liked to see plus 1400 ticks break yesterdays highs...still a probability....they took the overnight...so I agree Kool that the O/N high and YD RTH high is a good zone to have on the radar for sells
funny bruce....i was just looking for a re-entry point for the long side.....
since it's in to resistance now....it might give a pullback....the 51-53 area is possibly a good area to pullback to if this thing wants to continue up and have renewed strength.
since it's in to resistance now....it might give a pullback....the 51-53 area is possibly a good area to pullback to if this thing wants to continue up and have renewed strength.
Originally posted by redsixspeed
Originally posted by feng456
followed my plan to the letter
==================================================================
Hey feng;
Record your trade from time to time. Call the trade as you
see it setting up, record what you say then go back later
listen to what you did right. This may be a good teacher...
You might also want to record what you're up to in the Trading Journals section of the site. Create a new topic for yourself and post what you're up to and when you didn't follow your plan.
Emini Day Trading /
Daily Notes /
Forecast /
Economic Events /
Search /
Terms and Conditions /
Disclaimer /
Books /
Online Books /
Site Map /
Contact /
Privacy Policy /
Links /
About /
Day Trading Forum /
Investment Calculators /
Pivot Point Calculator /
Market Profile Generator /
Fibonacci Calculator /
Mailing List /
Advertise Here /
Articles /
Financial Terms /
Brokers /
Software /
Holidays /
Stock Split Calendar /
Mortgage Calculator /
Donate
Copyright © 2004-2023, MyPivots. All rights reserved.
Copyright © 2004-2023, MyPivots. All rights reserved.