ES Short Term Trading 5-11-10
Here's the Price Action Support Resistance levels that I see. With the way the market has acted with all the volatility, they're spaced relatively wide apart ... and should be, as always, taken as "zones" give or take a point or two in this market.
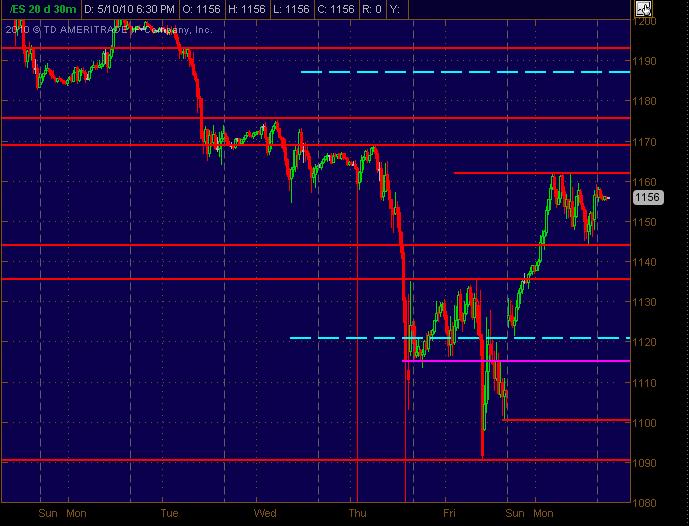
Here's the 30m chart with S/R lines in Red and the Cyan dashed lines are the Wkly pivot prices ... Magenta line is semi-significant. Hope this is a helpful map.
Here's the 30m chart with S/R lines in Red and the Cyan dashed lines are the Wkly pivot prices ... Magenta line is semi-significant. Hope this is a helpful map.
Click image for original size
here is the last two days combined because we spent time consolidating....note the volume shelf in the 57 - 58 area off the histogram.....cool number...no more trades for me for today
Click image for original size
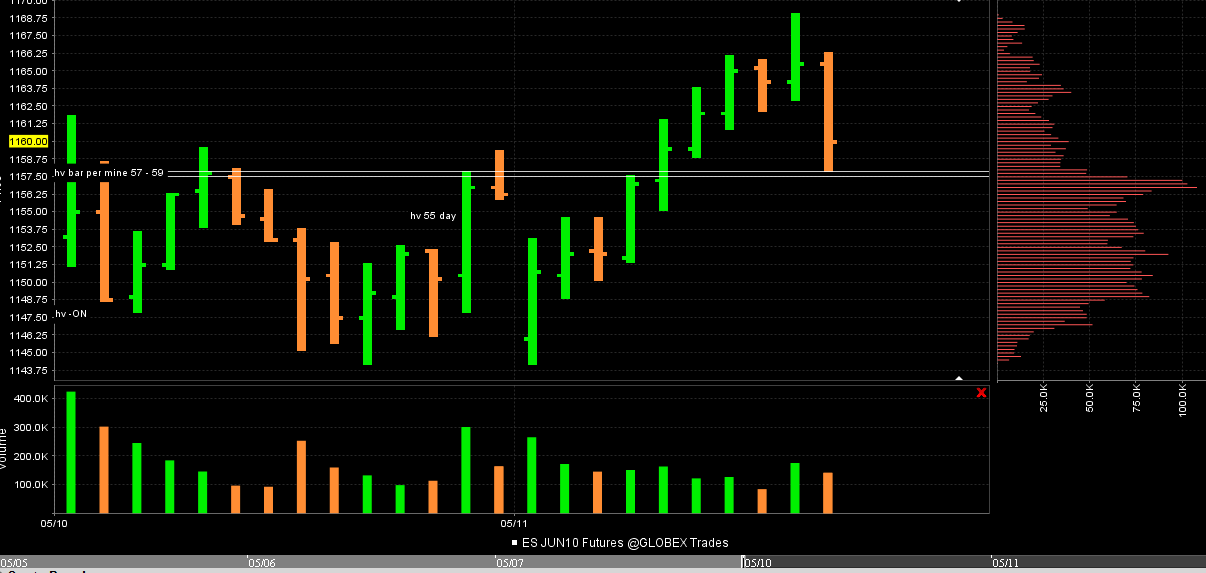
all markets below their peak volume prices so buying is risky IMHO
Originally posted by phileo
1156-1157 looking more and more significant today.
It is:
- yesterday's VAH and VPOC
- gap fill resistance
- prior support
long 1156 2/2 stop/target
Originally posted by phileo
Originally posted by phileo
1156-1157 looking more and more significant today.
It is:
- yesterday's VAH and VPOC
- gap fill resistance
- prior support
long 1156 2/2 stop/target
out 1157, only +1, could be more, but don't want to get greedy, plus it's still kind of volatile here.
there goes 1158... oh well...
1156.5 was yesterday's close, so bullish if we close above 1157 today
1156.5 was yesterday's close, so bullish if we close above 1157 today
That looks likeone Tick of air we have at 54.75 if my data i correct..as per 5 minute but histogram isn't showing....so that is the area you mentioned Kool...will be interesting...just babbling now...seems like we will fill 61 - 52
the buyers certainly don't want to close inside th e60 minute range...so that air is also 60 minute high and critical for bulls to keep above
and nice call KOOL...or should I call u Eagle eye???
That was a good fade Phileo...didn't want you to think I didn't notice...ballsy but very cool!!
That was a good fade Phileo...didn't want you to think I didn't notice...ballsy but very cool!!
Originally posted by BruceMthat was also air on your 30 min chart! from 57.50-58.50
last one off at 58.50...that was a Low Volume spot........COOL stuff...
look at your histogram before it fills in some more
To put things in perspective....
Click image for original size

Originally posted by redsixspeed
Originally posted by feng456
followed my plan to the letter
==================================================================
Hey feng;
Record your trade from time to time. Call the trade as you
see it setting up, record what you say then go back later
listen to what you did right. This may be a good teacher...
You might also want to record what you're up to in the Trading Journals section of the site. Create a new topic for yourself and post what you're up to and when you didn't follow your plan.
Emini Day Trading /
Daily Notes /
Forecast /
Economic Events /
Search /
Terms and Conditions /
Disclaimer /
Books /
Online Books /
Site Map /
Contact /
Privacy Policy /
Links /
About /
Day Trading Forum /
Investment Calculators /
Pivot Point Calculator /
Market Profile Generator /
Fibonacci Calculator /
Mailing List /
Advertise Here /
Articles /
Financial Terms /
Brokers /
Software /
Holidays /
Stock Split Calendar /
Mortgage Calculator /
Donate
Copyright © 2004-2023, MyPivots. All rights reserved.
Copyright © 2004-2023, MyPivots. All rights reserved.