ES short term trading 5-14-10
Click image for original size
Click image for original size
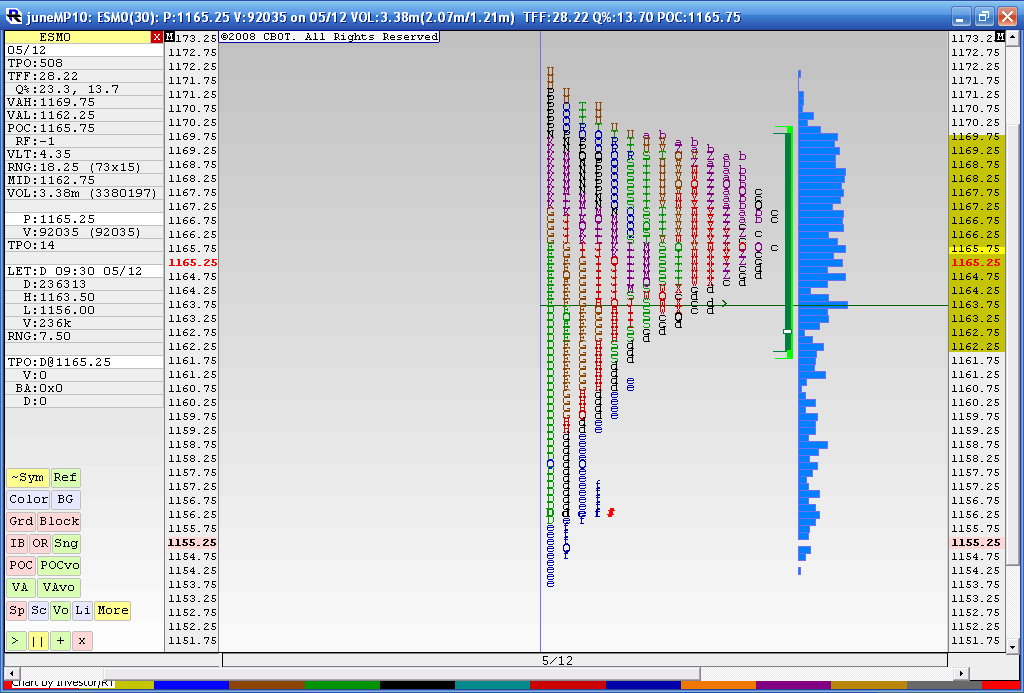
I've had to create zones for Friday as there are just too many numbers lining up. So here they are:
67 - 70 Lots of volume, Peak and R1 up here
61 - 62 Single prints (air), Pivot point and Va Low ****
51 - 49 Volume cluster , gap , buying tail from Tuesday
41 -43 current major support, S2 and that begins the gap all the way down to 32.50....
Here is a two day combined profile since we overlapped the past two days...obviously lots of volume with a peak at 64 that is also closing VWAP today..
Click image for original size
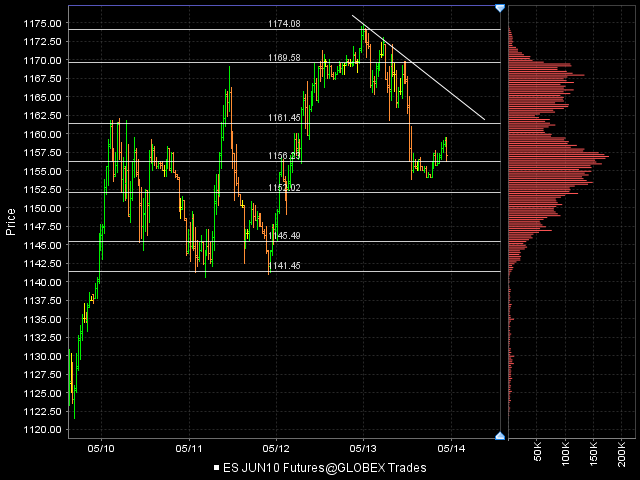
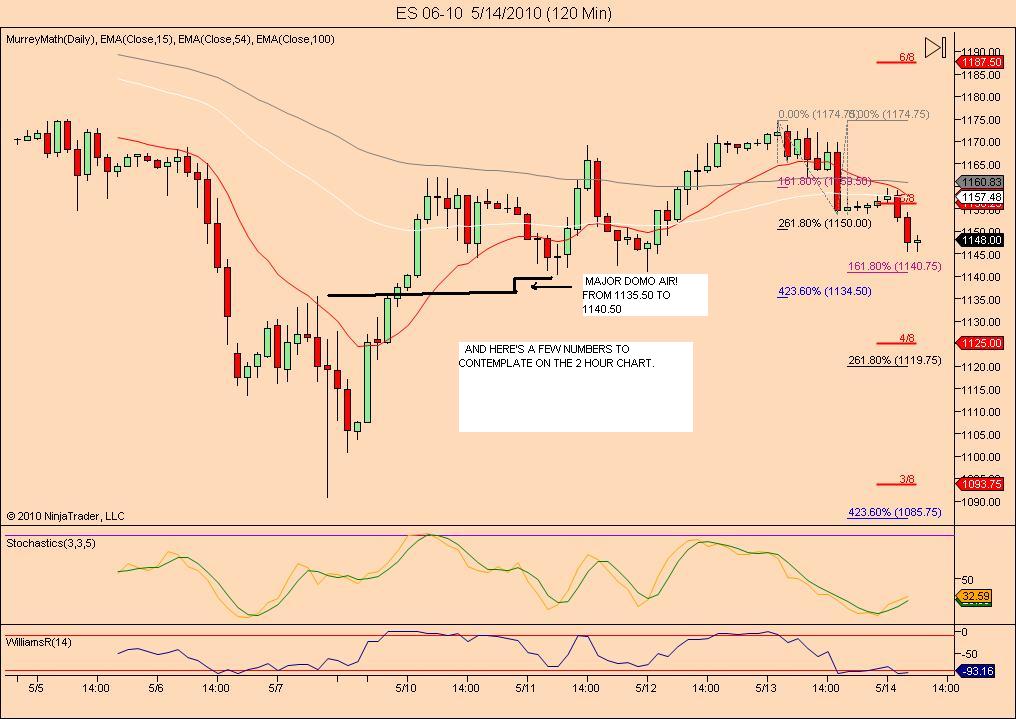
This thing should have some follow through. Outside bar on the daily after testing the 50 day. Likely going to test that 40-45 area. I feel the market needs to stay above that area if it's going to push higher, shorts should be pushing in that direction. Some news tmrw that could move the market either way. Gonna try building a short position at 62. Looking for good news to be discounted. If that's the case I'm gonna be looking to short any strength. The market will do whatever frustrates the most amount of people. It seems to be doing that as of late
Click image for original size
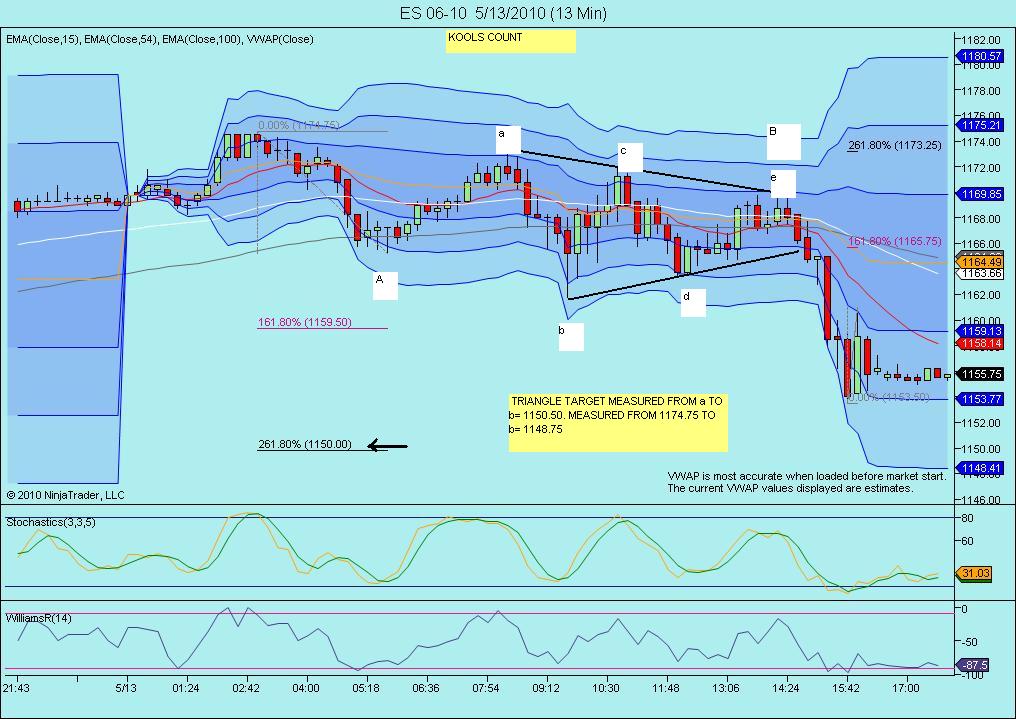
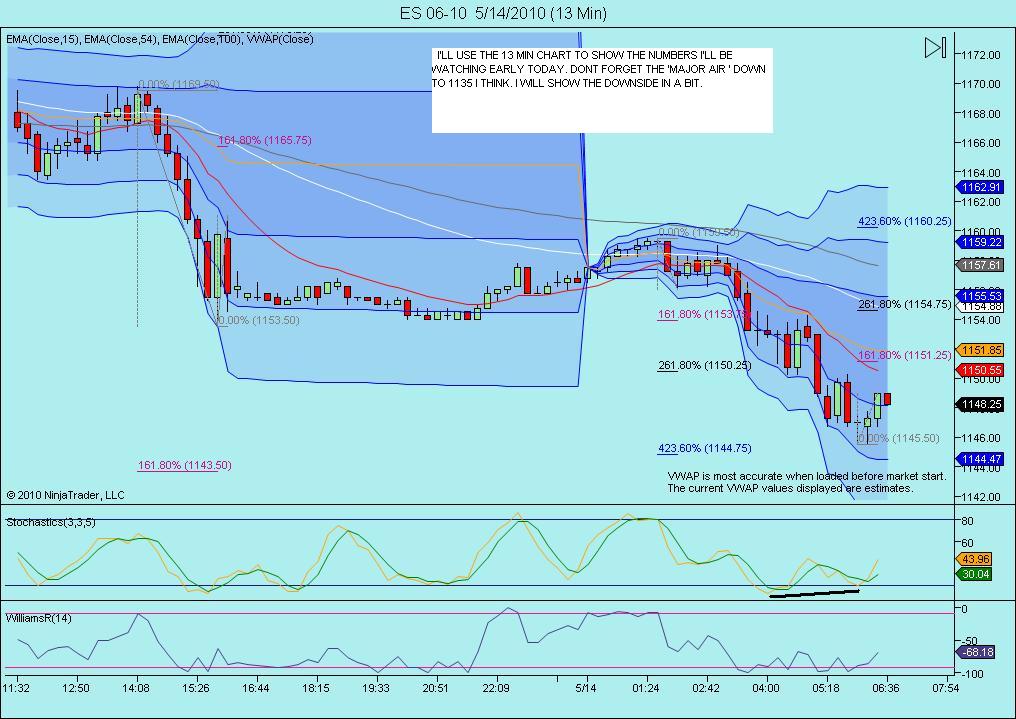
here are my numbers for tomorrow:
1169-71: R1, 2 consecutive VPOC's, prior close, prior RTH hi + today's VAH + 20d EMA + 50d SMA
1161-62.5: composite LVN + daily PP + reaction area monday & today
1156-57: composite HVN + today's close + yesterday's o/n and today's reaction area + POC 5d SMA
1151-53: unfilled gap from Tues. + naked VPOC + this week's starting point of breakouts/breakdowns
1145-46: RTH low for this week.
1141-43: GLOBEX low for this week.
Given how SPY daily chart is bumping against the 20d/50d MA ceilings, I'm not expecting 1169-71 to be broken tomorrow, and will be biased looking for shorts.
You called that 71 yesterday pretty nice. I thought it would retest the ONH. Nickel diming the market again. good setups after 2pm to get short. 15 minute chart you get a nice outside bar followed by a three bar formation. Too choked after not taking the PDH.
Good morning. just had a nice little buy scalp from 1146.50-1148.75. ...
Click image for original size
Click image for original size
Few traders on 54.50 in O/N so that is my magnet price for longs
starting small longs at 47.50...50 is first target.....as I am the worlds worst buyer of the market
I have been studying AH PA.
I work from the perspective of "how far" the rubber band of price can stretch before it has to retrace some.
One thing I have noticed is that (AH prices only) when AH price today reaches the Previous day's AH L minus (the previous day's AH range *2) (call it a 200% extension down)
it has been followed by some violent RTH volatility.
See list below of AH sessions when previous day's AH L - (2*previous day's AH range) were hit in the Pre-market.
Dates are the date for the RTH session that followed the 200% extensions down.
Monday, 4/19/10
Wednesday, 4/28/10
Friday, 5/7/10
and price has hit the 200% extension down for the current AH
Originally posted by redsixspeed
Originally posted by BruceM
so it seems my histogram on IB may be wrong...anyone else have a High Volume Histogram price up at 37 that is higher than the volume node at 30 or 31?
===================================================================
Bruce,
Seems your right @ 37.00...I don't use vwap...I know kool says
load it just before open...I forget to load it...LOL
====================================================================
I loaded vwap just before market close = 1136.00
Emini Day Trading /
Daily Notes /
Forecast /
Economic Events /
Search /
Terms and Conditions /
Disclaimer /
Books /
Online Books /
Site Map /
Contact /
Privacy Policy /
Links /
About /
Day Trading Forum /
Investment Calculators /
Pivot Point Calculator /
Market Profile Generator /
Fibonacci Calculator /
Mailing List /
Advertise Here /
Articles /
Financial Terms /
Brokers /
Software /
Holidays /
Stock Split Calendar /
Mortgage Calculator /
Donate
Copyright © 2004-2023, MyPivots. All rights reserved.
Copyright © 2004-2023, MyPivots. All rights reserved.