ES Short Term Trading 7-16-10
A Monkey’s Ramblings on a map to somewhere
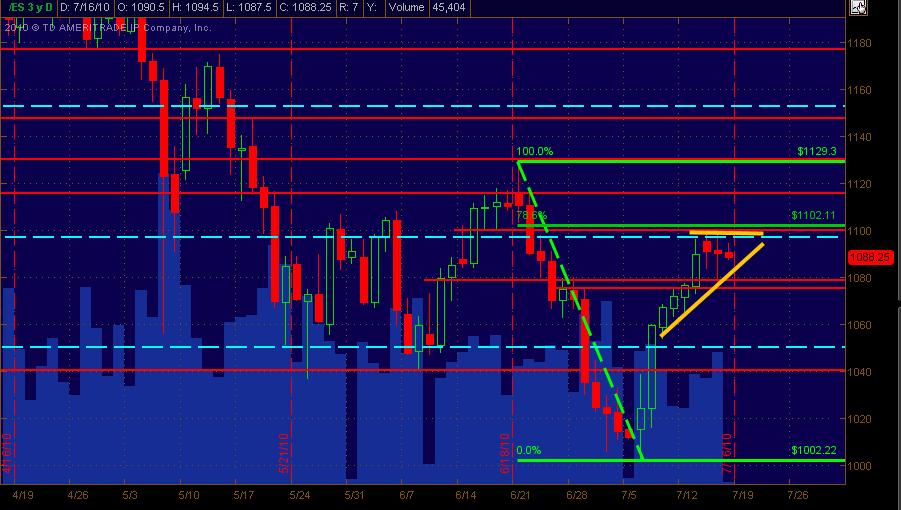
*Red Lines are Price Action Support/Resistance lines
*Cyan Dashed Lines are Weekly Pivot lines
*Fib Retracement of 786 is shown with Green line(s)
*Yellow(ish) lines are a Pattern showing both a small ascending triangle BUT more importantly, some range contraction of sideways trading for a few days
*Volume bars are displayed as lighter Blue across the horizontal axis (overlapping some of the other components of the chart)
So, that’s the layout.
Yeppers, it’s option expiry Friday, which always can toss a monkey wrench into “normal” expectations.
1080-1100 seems to be a current significant range boundary. What’s more important to my view is, after a decent magnitude run up during the past week and a half or so, the market’s challenged and still challenging the 1100 price with daily bars of market contraction. This 1100 zone/level coincides not only with a PASR level I’ve got, but also with a 786 Fib retracement for those that follow fibs, and this Weekly R1 @ 1097. Daily R1 is 1101 for Friday fwiw.
After reviewing a bunch of individual stock charts, most of them are over extended to the long side or have a messy bullish pattern setup at best. Three that I ran across that looked only semi-decent were: AZO, NFLX and BIDU. The Russell-2000 was weaker than the other major indices for what it’s worth. As for volume, the rally’s been anemic as every dog and his brother has been intimating on their website and blogs. Don’t forget that we’re entering the Summer slow down though.
ES price is trading between the 50 and 200 sma and slightly above a down trend line (none of which are on the chart … it’s got more than enough lines and pretty colors to confuse me). So those “indicators” are mixed and messy.
Anyway, look to Bruce and Kool and others for intraday MP mapping etc. And hope this is helpful to some extent. Depending upon the overnight trading and the open, I'm looking at a potential straddle or strangle on the SPY.
*Red Lines are Price Action Support/Resistance lines
*Cyan Dashed Lines are Weekly Pivot lines
*Fib Retracement of 786 is shown with Green line(s)
*Yellow(ish) lines are a Pattern showing both a small ascending triangle BUT more importantly, some range contraction of sideways trading for a few days
*Volume bars are displayed as lighter Blue across the horizontal axis (overlapping some of the other components of the chart)
Click image for original size
So, that’s the layout.
Yeppers, it’s option expiry Friday, which always can toss a monkey wrench into “normal” expectations.
1080-1100 seems to be a current significant range boundary. What’s more important to my view is, after a decent magnitude run up during the past week and a half or so, the market’s challenged and still challenging the 1100 price with daily bars of market contraction. This 1100 zone/level coincides not only with a PASR level I’ve got, but also with a 786 Fib retracement for those that follow fibs, and this Weekly R1 @ 1097. Daily R1 is 1101 for Friday fwiw.
After reviewing a bunch of individual stock charts, most of them are over extended to the long side or have a messy bullish pattern setup at best. Three that I ran across that looked only semi-decent were: AZO, NFLX and BIDU. The Russell-2000 was weaker than the other major indices for what it’s worth. As for volume, the rally’s been anemic as every dog and his brother has been intimating on their website and blogs. Don’t forget that we’re entering the Summer slow down though.
ES price is trading between the 50 and 200 sma and slightly above a down trend line (none of which are on the chart … it’s got more than enough lines and pretty colors to confuse me). So those “indicators” are mixed and messy.
Anyway, look to Bruce and Kool and others for intraday MP mapping etc. And hope this is helpful to some extent. Depending upon the overnight trading and the open, I'm looking at a potential straddle or strangle on the SPY.
Here we go...+303 on tick.
I'd say if $tick can't reasonably change its negative bias the bears will maintain control.
I'd say if $tick can't reasonably change its negative bias the bears will maintain control.
that was 8 bars down and 9 is max extreme!!
for me, 75 is critical switch line of week. (switchline because was resistance, then became support, now it's resistance again)
Monday resistance 75-77, but then on Tuesday, price gapped above resistance and never tested it that day, came back to it yesterday and produced huge one last time squeeze the shorts, and now for upside it is critical level. If price comes back up to it (75-77.25)and then fails again, downside potential for test of L of week at 1066, weekly pivot has not been printed this week, Weekly pivot is near 1054, could be in play if bulls puke (I doubt pukage, but who knows).
Monday resistance 75-77, but then on Tuesday, price gapped above resistance and never tested it that day, came back to it yesterday and produced huge one last time squeeze the shorts, and now for upside it is critical level. If price comes back up to it (75-77.25)and then fails again, downside potential for test of L of week at 1066, weekly pivot has not been printed this week, Weekly pivot is near 1054, could be in play if bulls puke (I doubt pukage, but who knows).
gonna go above 75 and higher....more like 76 - 77
Agreed on the importance of 1075. If prices can't reasonably rally above this number 1050 should be in the cards sometime in the not to distant future.
Originally posted by PAUL9
for me, 75 is critical switch line of week. (switchline because was resistance, then became support, now it's resistance again)
Monday resistance 75-77, but then on Tuesday, price gapped above resistance and never tested it that day, came back to it yesterday and produced huge one last time squeeze the shorts, and now for upside it is critical level. If price comes back up to it (75-77.25)and then fails again, downside potential for test of L of week at 1066, weekly pivot has not been printed this week, Weekly pivot is near 1054, could be in play if bulls puke (I doubt pukage, but who knows).
Originally posted by phileo
Originally posted by phileo
unless price can get above YDay's Lows, I'm going to call this a trend day down now.
NQ new lows
No long setups for me.
reasons:
1) no gap fill. normally 4pt gap down should not be a problem.
2) preMkt bias was down, and opening 5min. was an opening drive down.
3) price is running away from a declining VWAP.
4) 2pt shallow retraces so far.
5) broken below expected support levels, YDay's low being the most significant one.
just exited my short 1074.5, wanted to protect profits.
My thesis on trend day down is wrong if price breaks above 1076 on this current +ve tick sequence
Its obvious 1074-75 area is recognized by traders with this current up/down sideways action.
Volume building at 1074. Interesting.
Volume building at 1074. Interesting.
1070.50 is the range based S1 based on Dr. Brett's formula.
1064.75 would be S2.
1064.75 would be S2.
this morning session is looking an awful lot like yesterday's morning.
However, i think the ending will be different this time around.
What's really important is to see how the Pro's trade the afternoon close.
YDay's lows still a key level for me.
However, i think the ending will be different this time around.
What's really important is to see how the Pro's trade the afternoon close.
YDay's lows still a key level for me.
2 more off at 75.25.....holding 3.....look at that low range 15 minute bar after that trend....they will watch that low and if they can get below that they should try for the hour lows...
we saw the same thing YD...big trend down and then nothing for hours...
trying to get to 77.25 on next contract if that low holds...
we saw the same thing YD...big trend down and then nothing for hours...
trying to get to 77.25 on next contract if that low holds...
I'm using continuous day trading volume not just RTH volume....fyi.
Emini Day Trading /
Daily Notes /
Forecast /
Economic Events /
Search /
Terms and Conditions /
Disclaimer /
Books /
Online Books /
Site Map /
Contact /
Privacy Policy /
Links /
About /
Day Trading Forum /
Investment Calculators /
Pivot Point Calculator /
Market Profile Generator /
Fibonacci Calculator /
Mailing List /
Advertise Here /
Articles /
Financial Terms /
Brokers /
Software /
Holidays /
Stock Split Calendar /
Mortgage Calculator /
Donate
Copyright © 2004-2023, MyPivots. All rights reserved.
Copyright © 2004-2023, MyPivots. All rights reserved.