ES Short Term Trading 7-16-10
A Monkey’s Ramblings on a map to somewhere
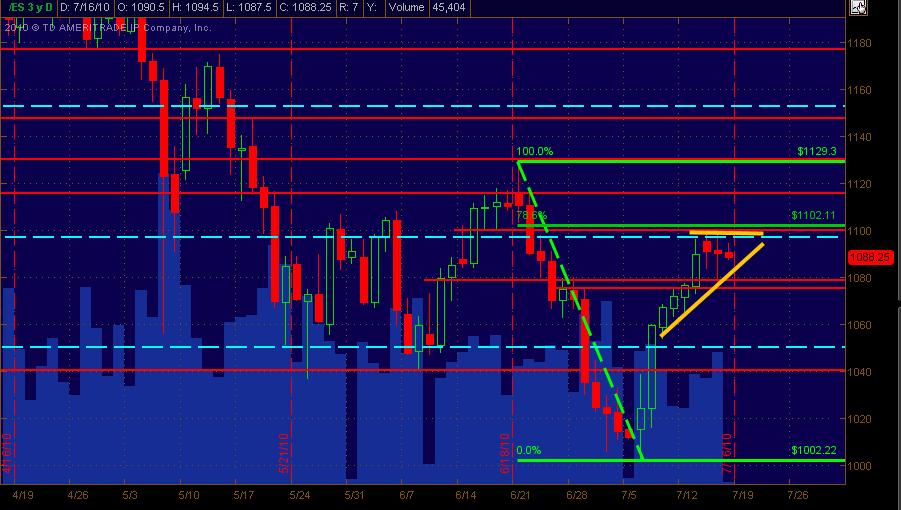
*Red Lines are Price Action Support/Resistance lines
*Cyan Dashed Lines are Weekly Pivot lines
*Fib Retracement of 786 is shown with Green line(s)
*Yellow(ish) lines are a Pattern showing both a small ascending triangle BUT more importantly, some range contraction of sideways trading for a few days
*Volume bars are displayed as lighter Blue across the horizontal axis (overlapping some of the other components of the chart)
So, that’s the layout.
Yeppers, it’s option expiry Friday, which always can toss a monkey wrench into “normal” expectations.
1080-1100 seems to be a current significant range boundary. What’s more important to my view is, after a decent magnitude run up during the past week and a half or so, the market’s challenged and still challenging the 1100 price with daily bars of market contraction. This 1100 zone/level coincides not only with a PASR level I’ve got, but also with a 786 Fib retracement for those that follow fibs, and this Weekly R1 @ 1097. Daily R1 is 1101 for Friday fwiw.
After reviewing a bunch of individual stock charts, most of them are over extended to the long side or have a messy bullish pattern setup at best. Three that I ran across that looked only semi-decent were: AZO, NFLX and BIDU. The Russell-2000 was weaker than the other major indices for what it’s worth. As for volume, the rally’s been anemic as every dog and his brother has been intimating on their website and blogs. Don’t forget that we’re entering the Summer slow down though.
ES price is trading between the 50 and 200 sma and slightly above a down trend line (none of which are on the chart … it’s got more than enough lines and pretty colors to confuse me). So those “indicators” are mixed and messy.
Anyway, look to Bruce and Kool and others for intraday MP mapping etc. And hope this is helpful to some extent. Depending upon the overnight trading and the open, I'm looking at a potential straddle or strangle on the SPY.
*Red Lines are Price Action Support/Resistance lines
*Cyan Dashed Lines are Weekly Pivot lines
*Fib Retracement of 786 is shown with Green line(s)
*Yellow(ish) lines are a Pattern showing both a small ascending triangle BUT more importantly, some range contraction of sideways trading for a few days
*Volume bars are displayed as lighter Blue across the horizontal axis (overlapping some of the other components of the chart)
Click image for original size
So, that’s the layout.
Yeppers, it’s option expiry Friday, which always can toss a monkey wrench into “normal” expectations.
1080-1100 seems to be a current significant range boundary. What’s more important to my view is, after a decent magnitude run up during the past week and a half or so, the market’s challenged and still challenging the 1100 price with daily bars of market contraction. This 1100 zone/level coincides not only with a PASR level I’ve got, but also with a 786 Fib retracement for those that follow fibs, and this Weekly R1 @ 1097. Daily R1 is 1101 for Friday fwiw.
After reviewing a bunch of individual stock charts, most of them are over extended to the long side or have a messy bullish pattern setup at best. Three that I ran across that looked only semi-decent were: AZO, NFLX and BIDU. The Russell-2000 was weaker than the other major indices for what it’s worth. As for volume, the rally’s been anemic as every dog and his brother has been intimating on their website and blogs. Don’t forget that we’re entering the Summer slow down though.
ES price is trading between the 50 and 200 sma and slightly above a down trend line (none of which are on the chart … it’s got more than enough lines and pretty colors to confuse me). So those “indicators” are mixed and messy.
Anyway, look to Bruce and Kool and others for intraday MP mapping etc. And hope this is helpful to some extent. Depending upon the overnight trading and the open, I'm looking at a potential straddle or strangle on the SPY.
Here is the chart and I goofed up on the projection. 1063.50.
Click image for original size

long 1066.5 targetting KoolBlue's 1069.5, stop just under LoD.
1067 is support lvl, and we have -ve TICK extreme on a higher low
1067 is support lvl, and we have -ve TICK extreme on a higher low
Originally posted by phileo
long 1066.5 targetting KoolBlue's 1069.5, stop just under LoD.
1067 is support lvl, and we have -ve TICK extreme on a higher low
stopped out, -1.25pt loss
the little lift that the markets just had coincided with a cnbc report about AAPL's Jobs giving away jackets for the Iphone (corrects reception problems)
now what
Lorn's analysis projects to 63.50
I see 64.50-62.50 as 30 minute air from 7-8-10
the monthly pivot point is 1059.00
on days like this (big down and Friday), even though rebounds can be sudden and rip higher like a solid fuel rocket, it is so dangerous to try to pick bottoms in a downtrending market like this.
One potentially good thing, if this is trend day down, then Monday will be MATD.
Agreed. Better to use all these projections as areas of interest and act accordingly.
Originally posted by PAUL9
on days like this (big down and Friday), even though rebounds can be sudden and rip higher like a solid fuel rocket, it is so dangerous to try to pick bottoms in a downtrending market like this.
Paul, trend day or no means nothing to me ... if i know a bounce up..or down is coming at a certain price, thats all that matters to me!... the DIRECTION of the daily trend on any given day ,however is very important. Todays ,of course is down. That means for me , any 'countertrend trade must be quick, and with a tight stop. I would tend to let any trade on the downside have a little more room to run tho. At least thats how i look at it. My long for instance ,from 1066.50 bounced 2.5 handles to 1069.00, before my stop at 65 was hit, giving me a breakeven trade.
hey Paul...that would be range air but not price overlap air as I define it....That 61 - 62 is a biggie but more important should be when we tradeback to 1039 - 1041.....that is thee key breakout for this upleg...
2:30pm-3:00pm approaches.
As Bruce says...I don't trust this time zone.
As Bruce says...I don't trust this time zone.
great!!! looks like they are using it too!! nice number so far
Originally posted by Lorn
1070.50 is the range based S1 based on Dr. Brett's formula.
1064.75 would be S2.
Fascinating. According to my data feed we haven't had a + or - 1000 $TICK read since that 10:08 bottom spike even with all this pressure to the downside.
Plotted on a 1 min chart it looks like a floor just above -1000.
Plotted on a 1 min chart it looks like a floor just above -1000.
I'm using continuous day trading volume not just RTH volume....fyi.
Emini Day Trading /
Daily Notes /
Forecast /
Economic Events /
Search /
Terms and Conditions /
Disclaimer /
Books /
Online Books /
Site Map /
Contact /
Privacy Policy /
Links /
About /
Day Trading Forum /
Investment Calculators /
Pivot Point Calculator /
Market Profile Generator /
Fibonacci Calculator /
Mailing List /
Advertise Here /
Articles /
Financial Terms /
Brokers /
Software /
Holidays /
Stock Split Calendar /
Mortgage Calculator /
Donate
Copyright © 2004-2023, MyPivots. All rights reserved.
Copyright © 2004-2023, MyPivots. All rights reserved.