ES S/R Map for 11-1-10
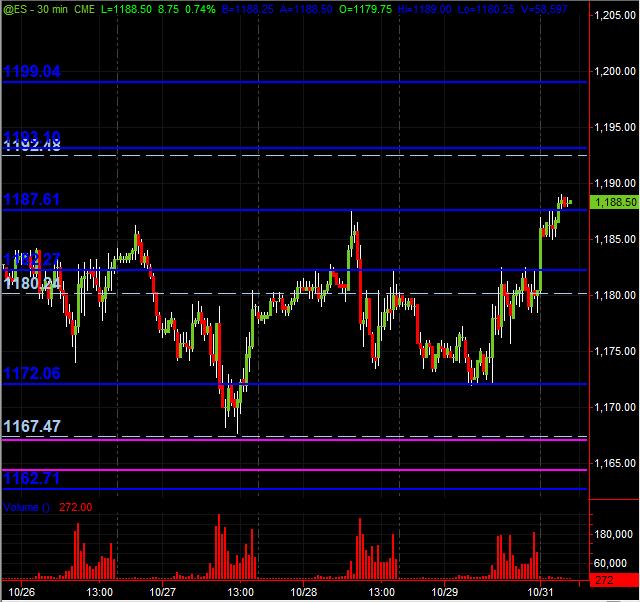
Here's what I've got coming into Monday. The Blue lines are potential S/R price levels derived from Price Action ... Magenta lines are potential semi-significant levels. The thinner Light Blue dashed lines are the Weekly Pivots. Drew these in on Saturday after consulting the 5min/Daily/&30min charts ... looking at both RTH sessions and also ATH.
Would appreciate any feedback, but more importantly, other folks' charts (or price levels accompanied by analysis) to get a "collective" of a variety of approaches and "eyes" viewing the upcoming trading session.
So far tonight, the ES opened and pushed up to, then paused, and finally punched beyond 87.50 from 10/28's high.
The 92-94 zone is a PASR level that also includes a Wkly Pvt ... and also (for fib traders) two price projections of what might be called potential "exhaustion" fall inside that same zone. To the downside, as of price right now, 85 (very minor) and 80-82 zone are potential Support levels as displayed on the chart.
Hope this is helpful to some and look forward to other posts!
The Funky Monkey
Would appreciate any feedback, but more importantly, other folks' charts (or price levels accompanied by analysis) to get a "collective" of a variety of approaches and "eyes" viewing the upcoming trading session.
So far tonight, the ES opened and pushed up to, then paused, and finally punched beyond 87.50 from 10/28's high.
Click image for original size
The 92-94 zone is a PASR level that also includes a Wkly Pvt ... and also (for fib traders) two price projections of what might be called potential "exhaustion" fall inside that same zone. To the downside, as of price right now, 85 (very minor) and 80-82 zone are potential Support levels as displayed on the chart.
Hope this is helpful to some and look forward to other posts!
The Funky Monkey
Although it didn't register on the mypivots "notes" for the ES ... the RTH of both the ES and SPY were NR4/ID's on Friday. Something to keep in mind.
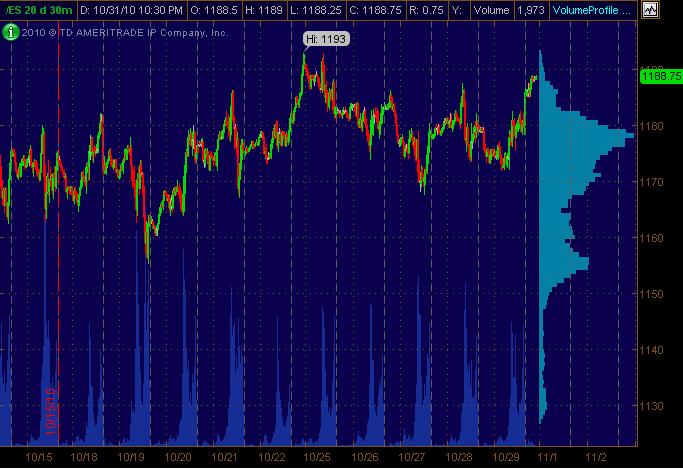
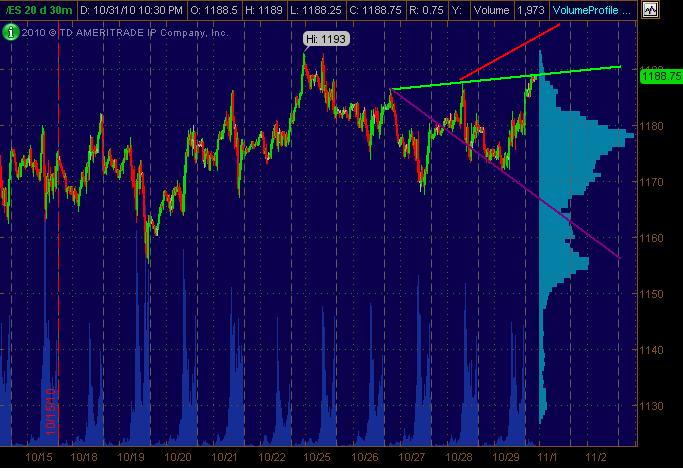
So here's another chart that's simply another "look" at the ES 30min of the past 20 days with Volume at Price plotted on the right vertical axis. Just another "view" from my TOS software showing the bulk of volume trading between 76 and 80. I don't have any additional input/analysis that I can pick up from this but would appreciate anyone elses break-down of what it might be showing for anticipating potential price magnet zones and rejection levels.
So here's another chart that's simply another "look" at the ES 30min of the past 20 days with Volume at Price plotted on the right vertical axis. Just another "view" from my TOS software showing the bulk of volume trading between 76 and 80. I don't have any additional input/analysis that I can pick up from this but would appreciate anyone elses break-down of what it might be showing for anticipating potential price magnet zones and rejection levels.
Click image for original size
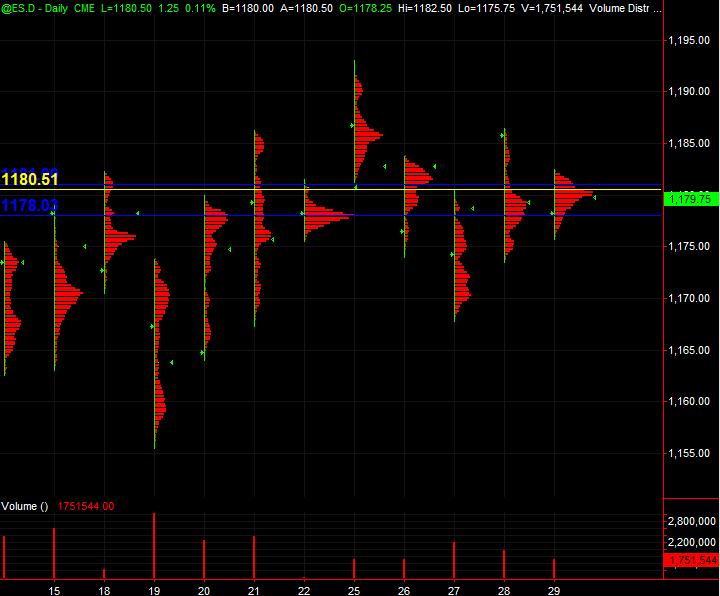
And from TradeStation again, here's a Daily chart thru Friday with their "volume distribution" displayed for each RTH session for apprx. 3 weeks where I've snapped in the lines for Friday's VAH and VAL in Blue with POC in Yellow.
Just trying to put out a variety of different angles and ways to view and analyse where things are and what it might point towards to characterize the trading day coming into Monday.
Just trying to put out a variety of different angles and ways to view and analyse where things are and what it might point towards to characterize the trading day coming into Monday.
Click image for original size
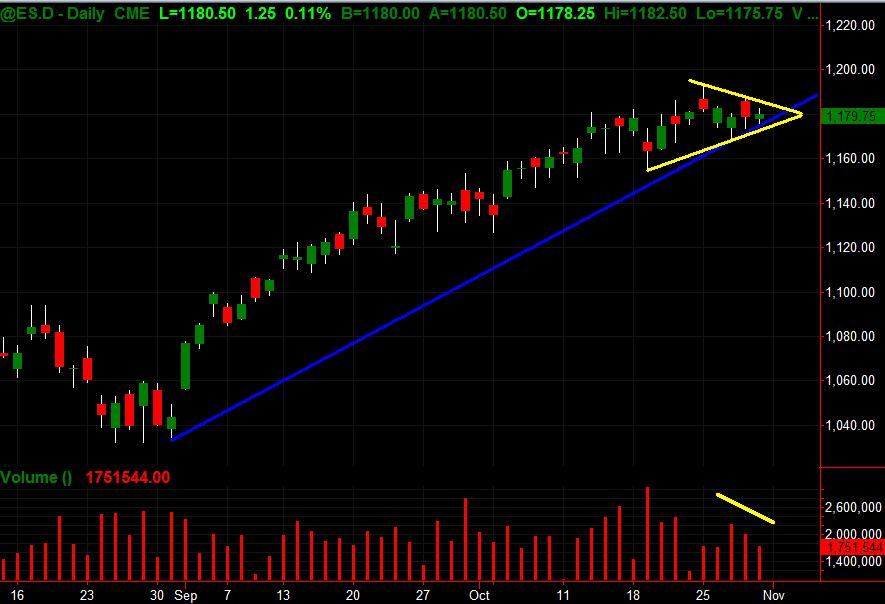
And a back-to-the-basics Daily chart in the spirit of Edwards and Magee ... upward sloping Trendline in Blue ... Yellow consolidating/contraction "Triangle" ... and Yellow line depicting decreasing Volume.
Didn't find any Wolfe Waves ... but would love to see some MP analysis and anything else. ALL LURKERS are cordially invited to join in with "first posts" as well. Paul, Lorn etc. ... anyone out there?
Click image for original size
Didn't find any Wolfe Waves ... but would love to see some MP analysis and anything else. ALL LURKERS are cordially invited to join in with "first posts" as well. Paul, Lorn etc. ... anyone out there?
The big kahuna as per volume has been the 79.50 area so today we should see mean reversion strategies still being used. I have a low volume area up at 89.50 and that is also near O/N high so an obvious key hurdle for bulls to take over in the day session.
Shorts are preferred with a gap open higher ( if we get a gap higher open). Market is up 6.5 points in O/N as I type. Nice work on the charts.
Shorts are preferred with a gap open higher ( if we get a gap higher open). Market is up 6.5 points in O/N as I type. Nice work on the charts.
15 minutes before RTH and here is the footprint chart. Obvious quads there at the 1189.75 top but its in O/N so not sure how much weight to give it.
The thing which stands out most to me is the sell off back under VWAP into the 8:30 news with multiple challenges of VWAP from the underside but no follow through as of yet. Volume overall is light as compared to 5-day average and of course with Elections tomorrow and FED day on Wed. I'm on my toes for small range days in waiting mode.
The thing which stands out most to me is the sell off back under VWAP into the 8:30 news with multiple challenges of VWAP from the underside but no follow through as of yet. Volume overall is light as compared to 5-day average and of course with Elections tomorrow and FED day on Wed. I'm on my toes for small range days in waiting mode.
Click image for original size
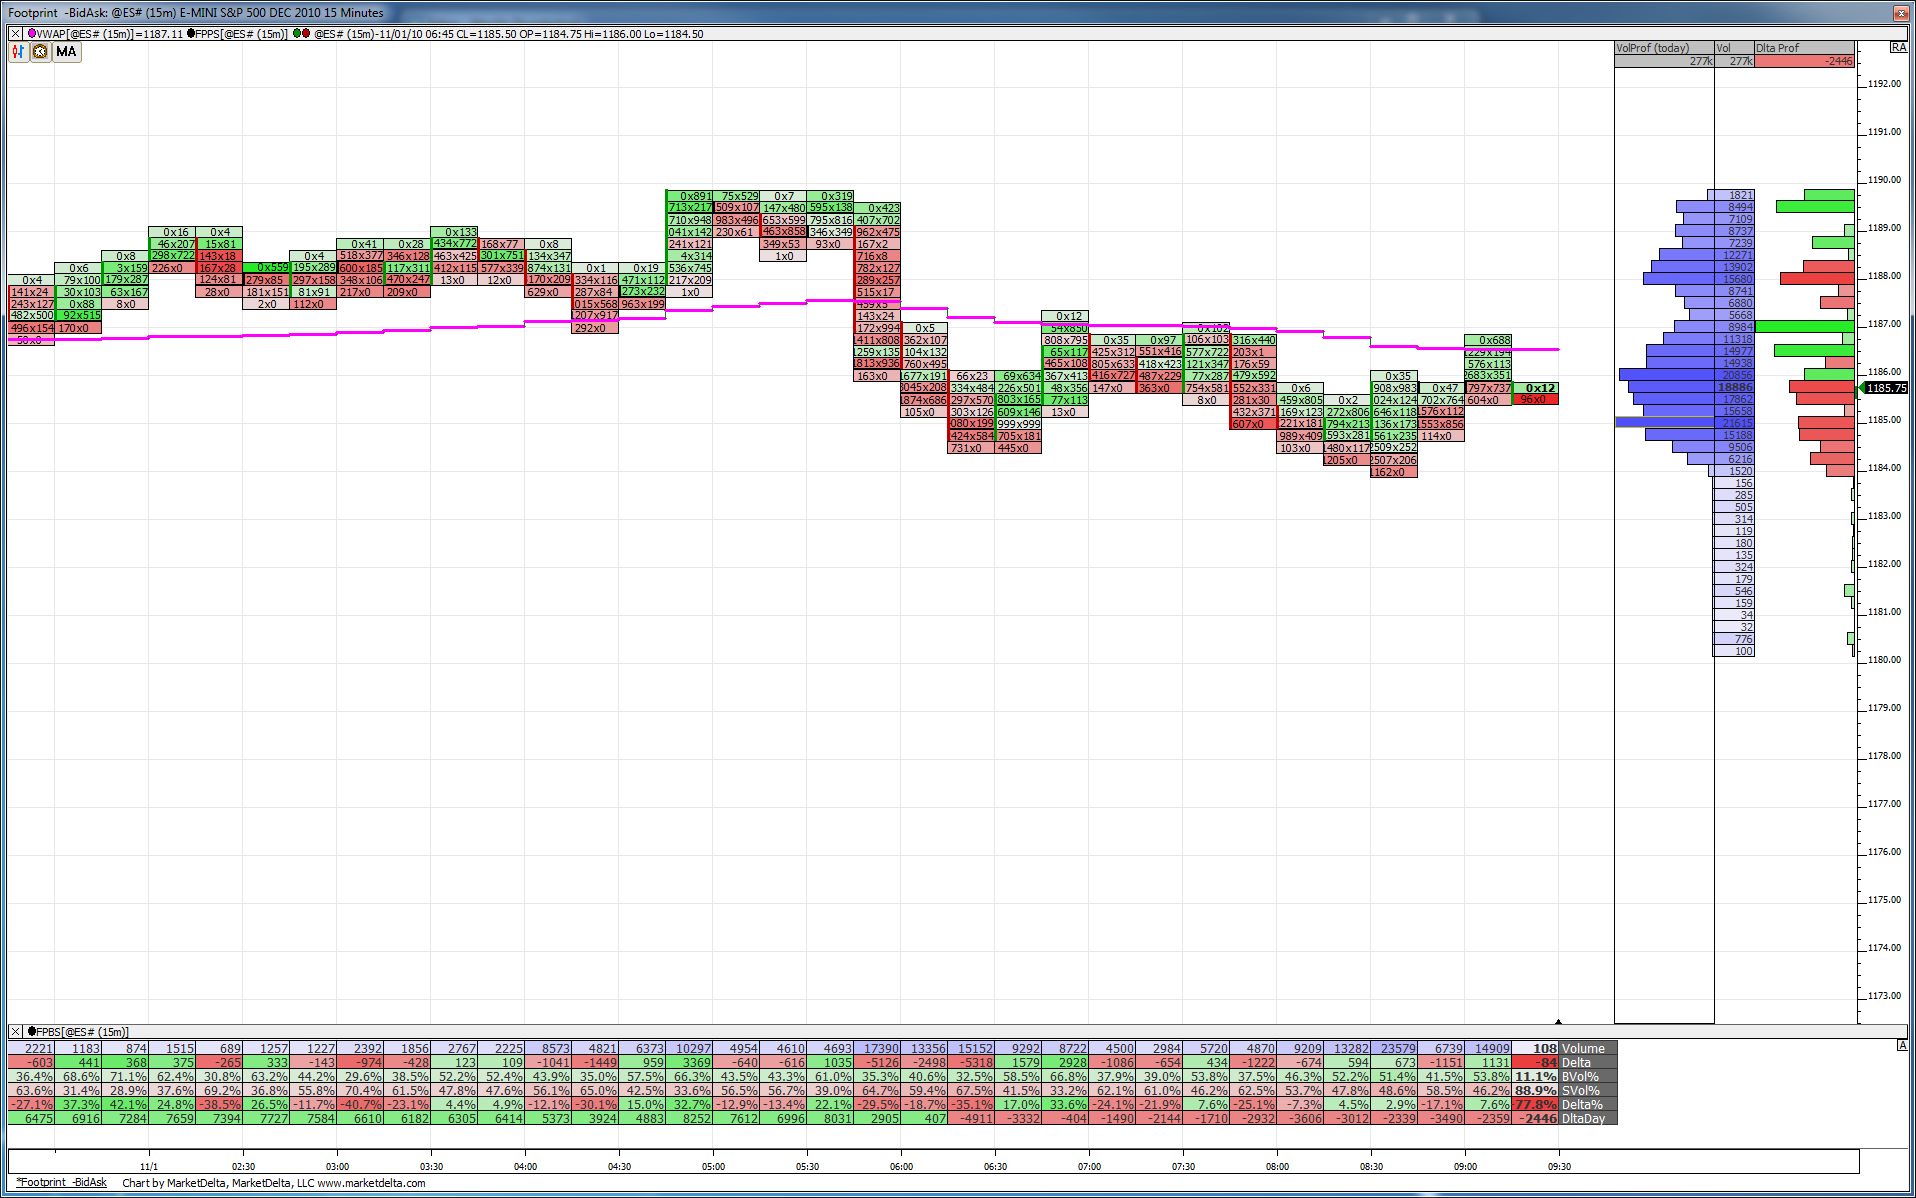
92.50 is secondary extreme of composite....look for 89.75 at least to be retested......lets not get too bullish with a 6 point move off the open...LOL
Good eye Bill. Thanks. I think all the charts I was looking at were eating my brain by the time I surfed for WW's. The 1-3 line and 2-4 converge too which was a plus ... dropped down some from point 5 before the RTH open ran price up into the 92-94 resistance zone.
Originally posted by BHReach
I see a WW forming on your 30 min chart.
Anyone get a short off in that 92+ zone ... there was also AIR a couple of points below on the 5min?
Is anybody trading out there ... or at least sim trading / learning / looking for new ideas etc. ... are any of these posts useful/helpful??? A lot of views (300+) but no new folks with ideas / interaction / feedback. Not bitching - just wondering.
MM
MM
Originally posted by i1hunter
Beautiful calls there guys!
MonkeyM, Lorn, BillHR. BruceM. Great posts and charts, thanks for taking your time and effort.!
I didn't trade today, not always day trade. The info here is very valuable because it comes from real traders. I know what you mean MonkeyM. We should have a "eliite" traders page, if people want to see what's posted there, well, they most pay a monthly fee. End of month, best poster gets a price that comes from the fees. Webmaster should keep some too.
As Bruce also pointed out last time, 1400 hits a day +- and not even a freaking thank you! It takes a lot of effort to post and still keep focus on your trading.
Or, for important info. we can use e-mail between people that are trading,, and just post the basic staff.......
I agree it's tough to post while trading. i am barely able to pop on and read while trading! LOL!
I have been more of a swing trader but have learned a GREAT deal about intraday from the posters here. Thank you very much!
Good luck to all.
Emini Day Trading /
Daily Notes /
Forecast /
Economic Events /
Search /
Terms and Conditions /
Disclaimer /
Books /
Online Books /
Site Map /
Contact /
Privacy Policy /
Links /
About /
Day Trading Forum /
Investment Calculators /
Pivot Point Calculator /
Market Profile Generator /
Fibonacci Calculator /
Mailing List /
Advertise Here /
Articles /
Financial Terms /
Brokers /
Software /
Holidays /
Stock Split Calendar /
Mortgage Calculator /
Donate
Copyright © 2004-2023, MyPivots. All rights reserved.
Copyright © 2004-2023, MyPivots. All rights reserved.