MyPivots
Sign In
JA
jarek
Rep: 94
Posts: 3,474
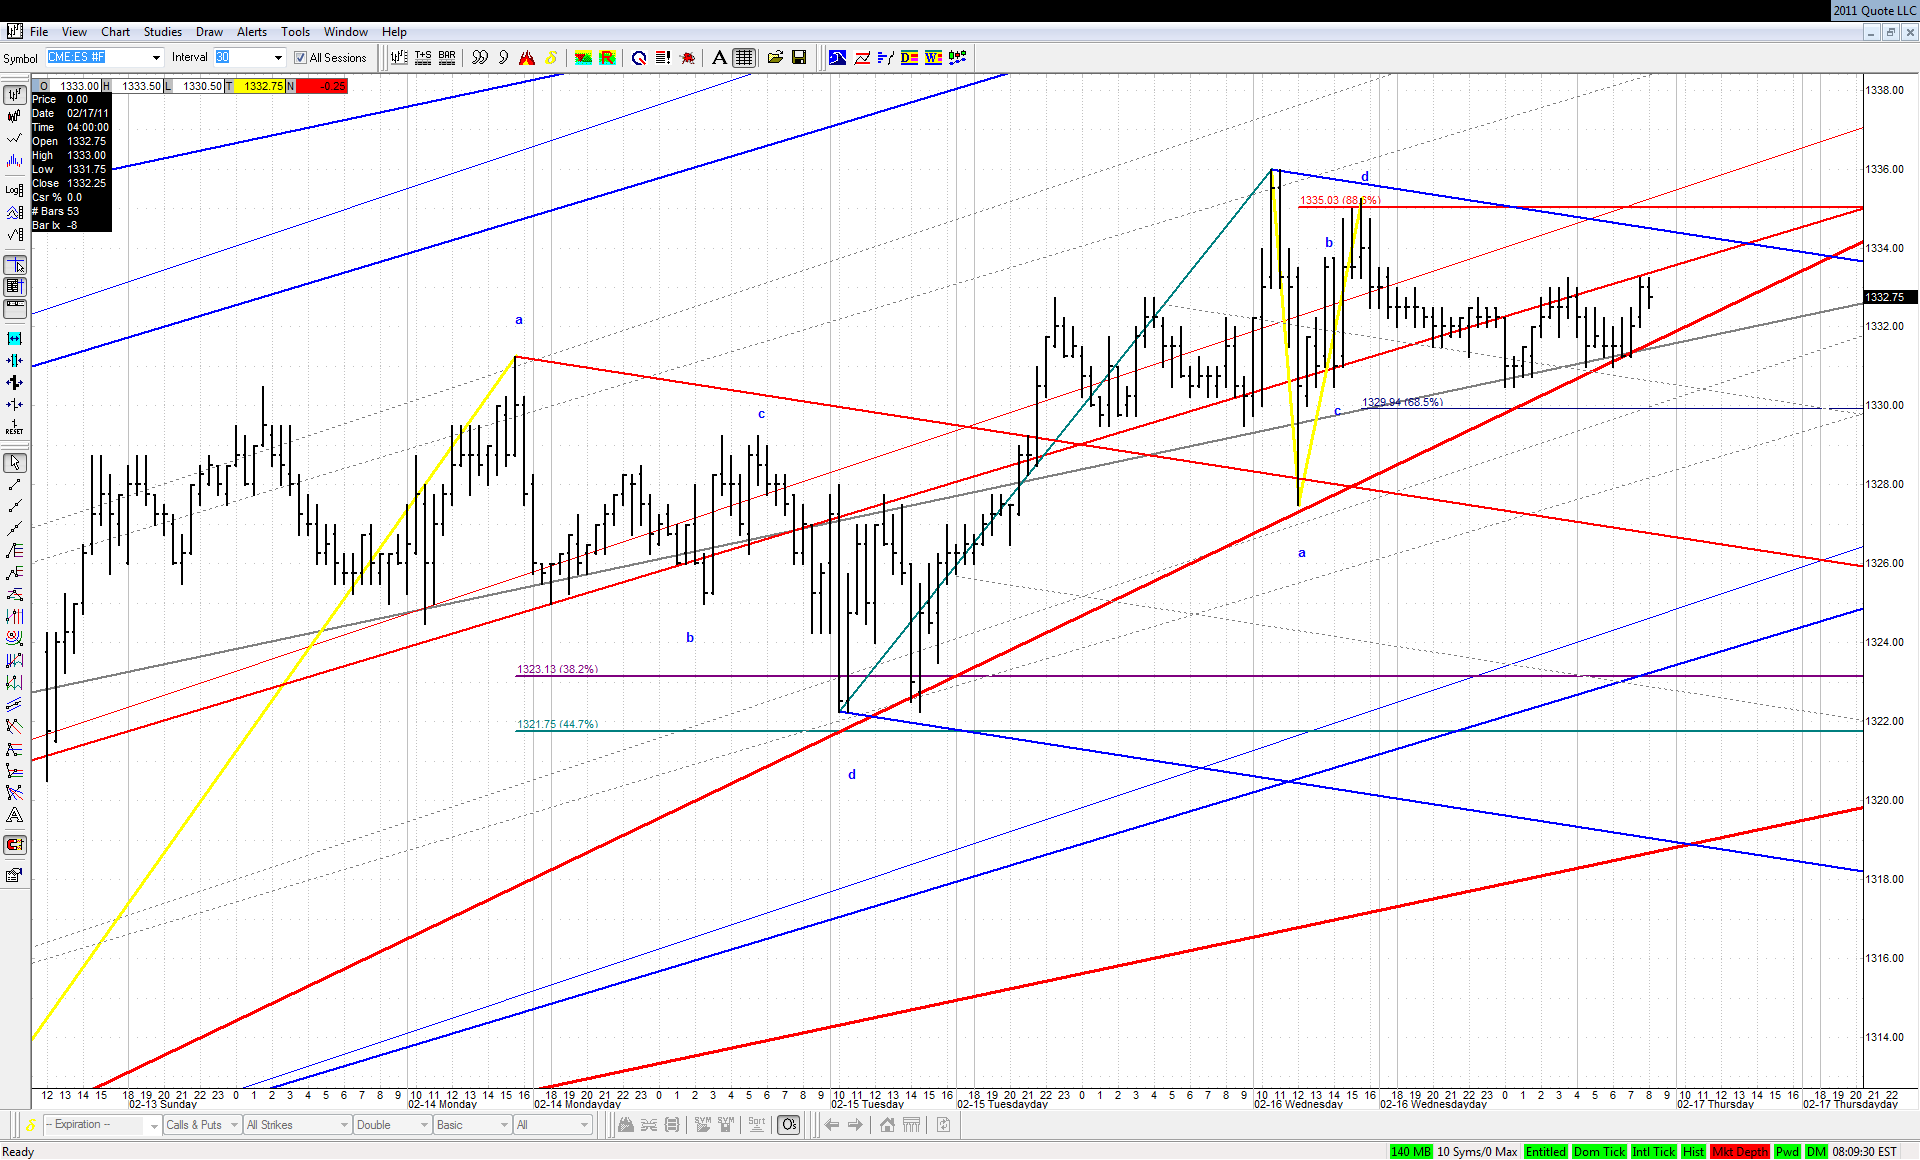
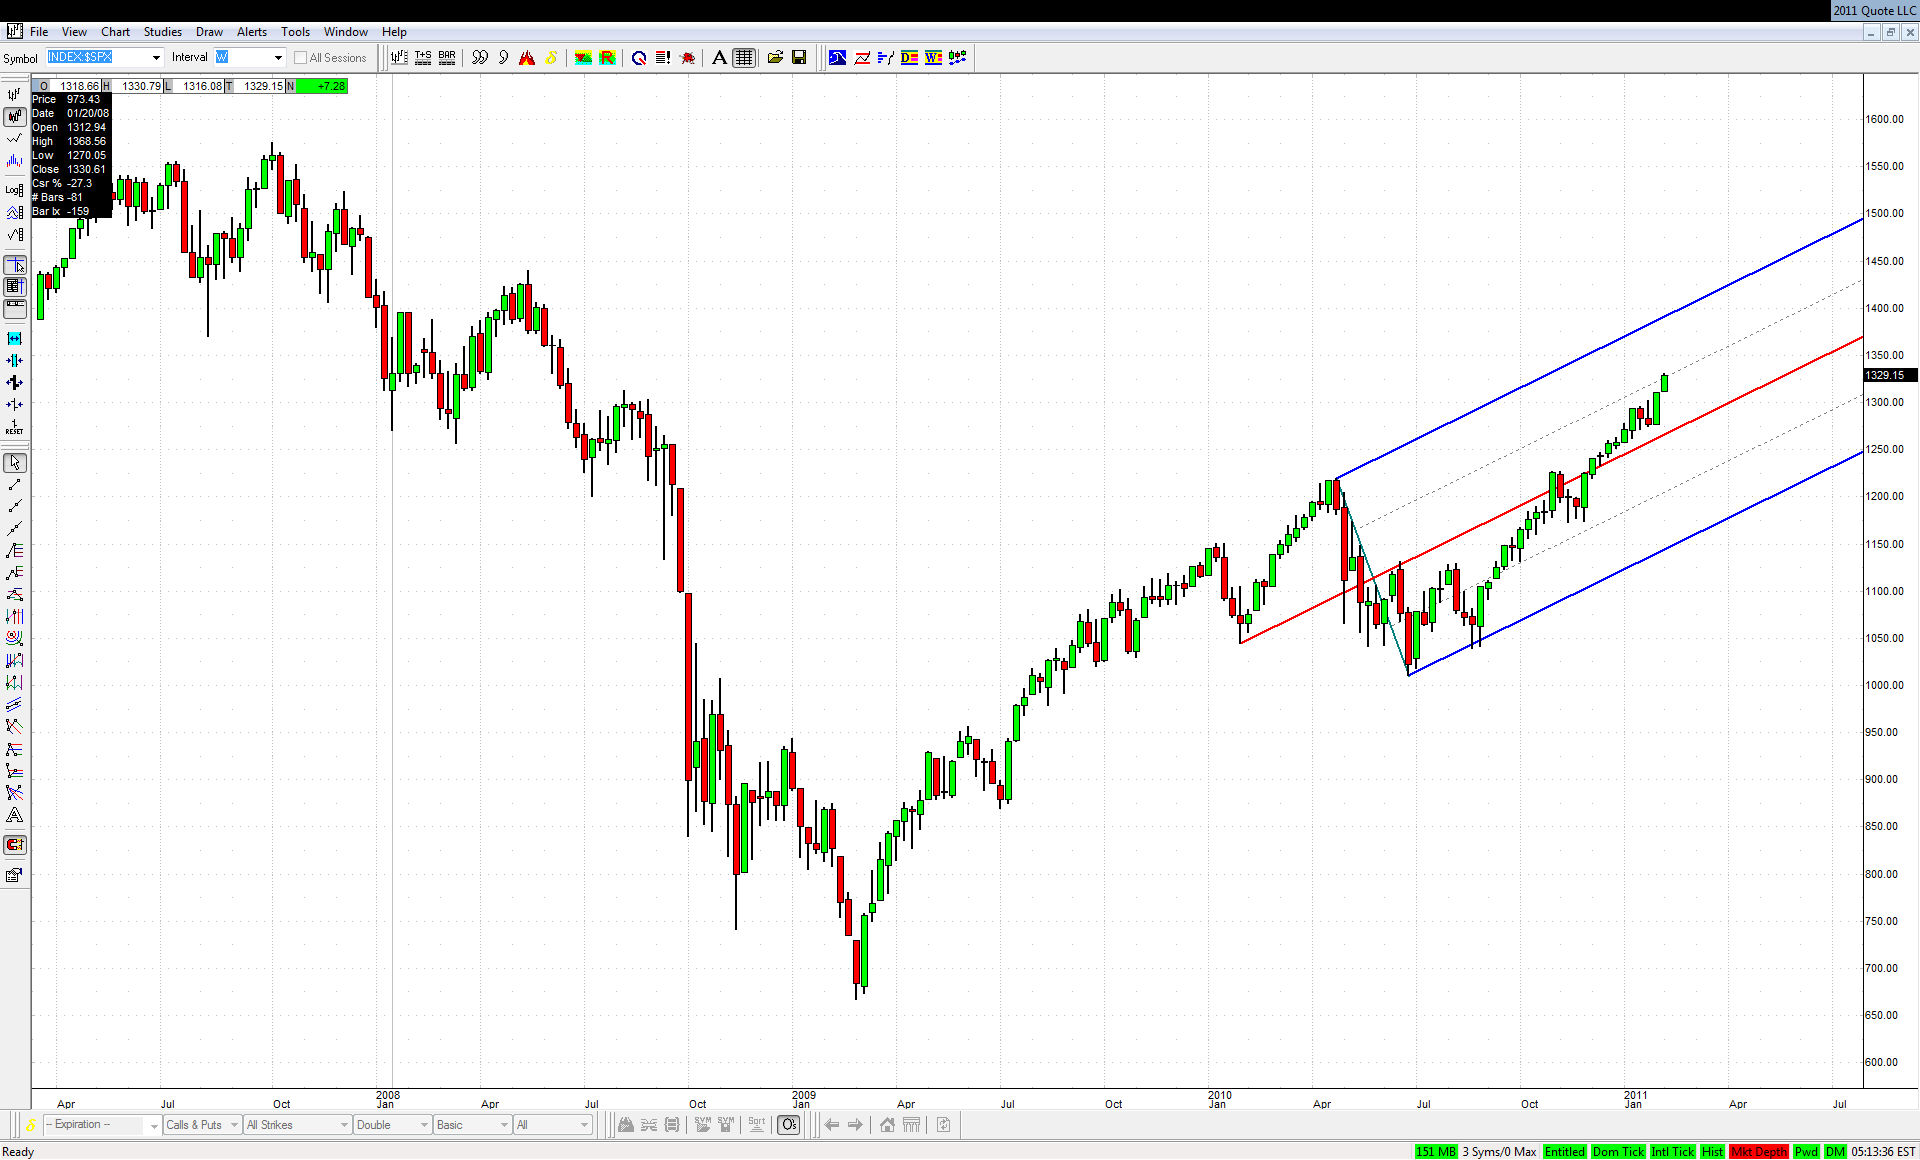
Is the move up that began on Friday a final acceleration to the 1330 area mentioned here couple of times? Or is it a start of something even bigger to the upside to finally convince everybody that this thing is never ever going to drop again? We'll have to wait to know the answer to this question. My personal opinion is closer to the second alternative, but of course I might be wrong. Some people say that the drop from May 2008 to the final 2009 bottom was an extended 5th wave. Such waves are usually fully retraced, and in such case the upper ML of the recent set needs to be met:


Click image for original size
JI
jimkane
Rep: 3,058
Posts: 33,089
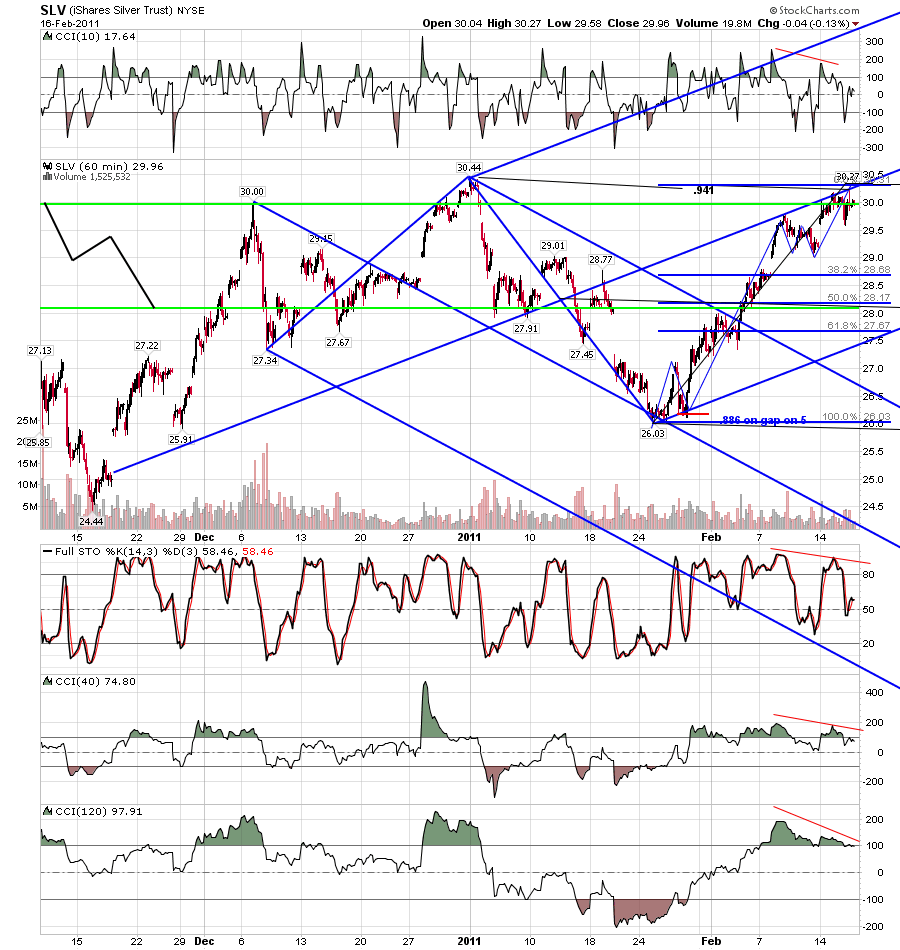
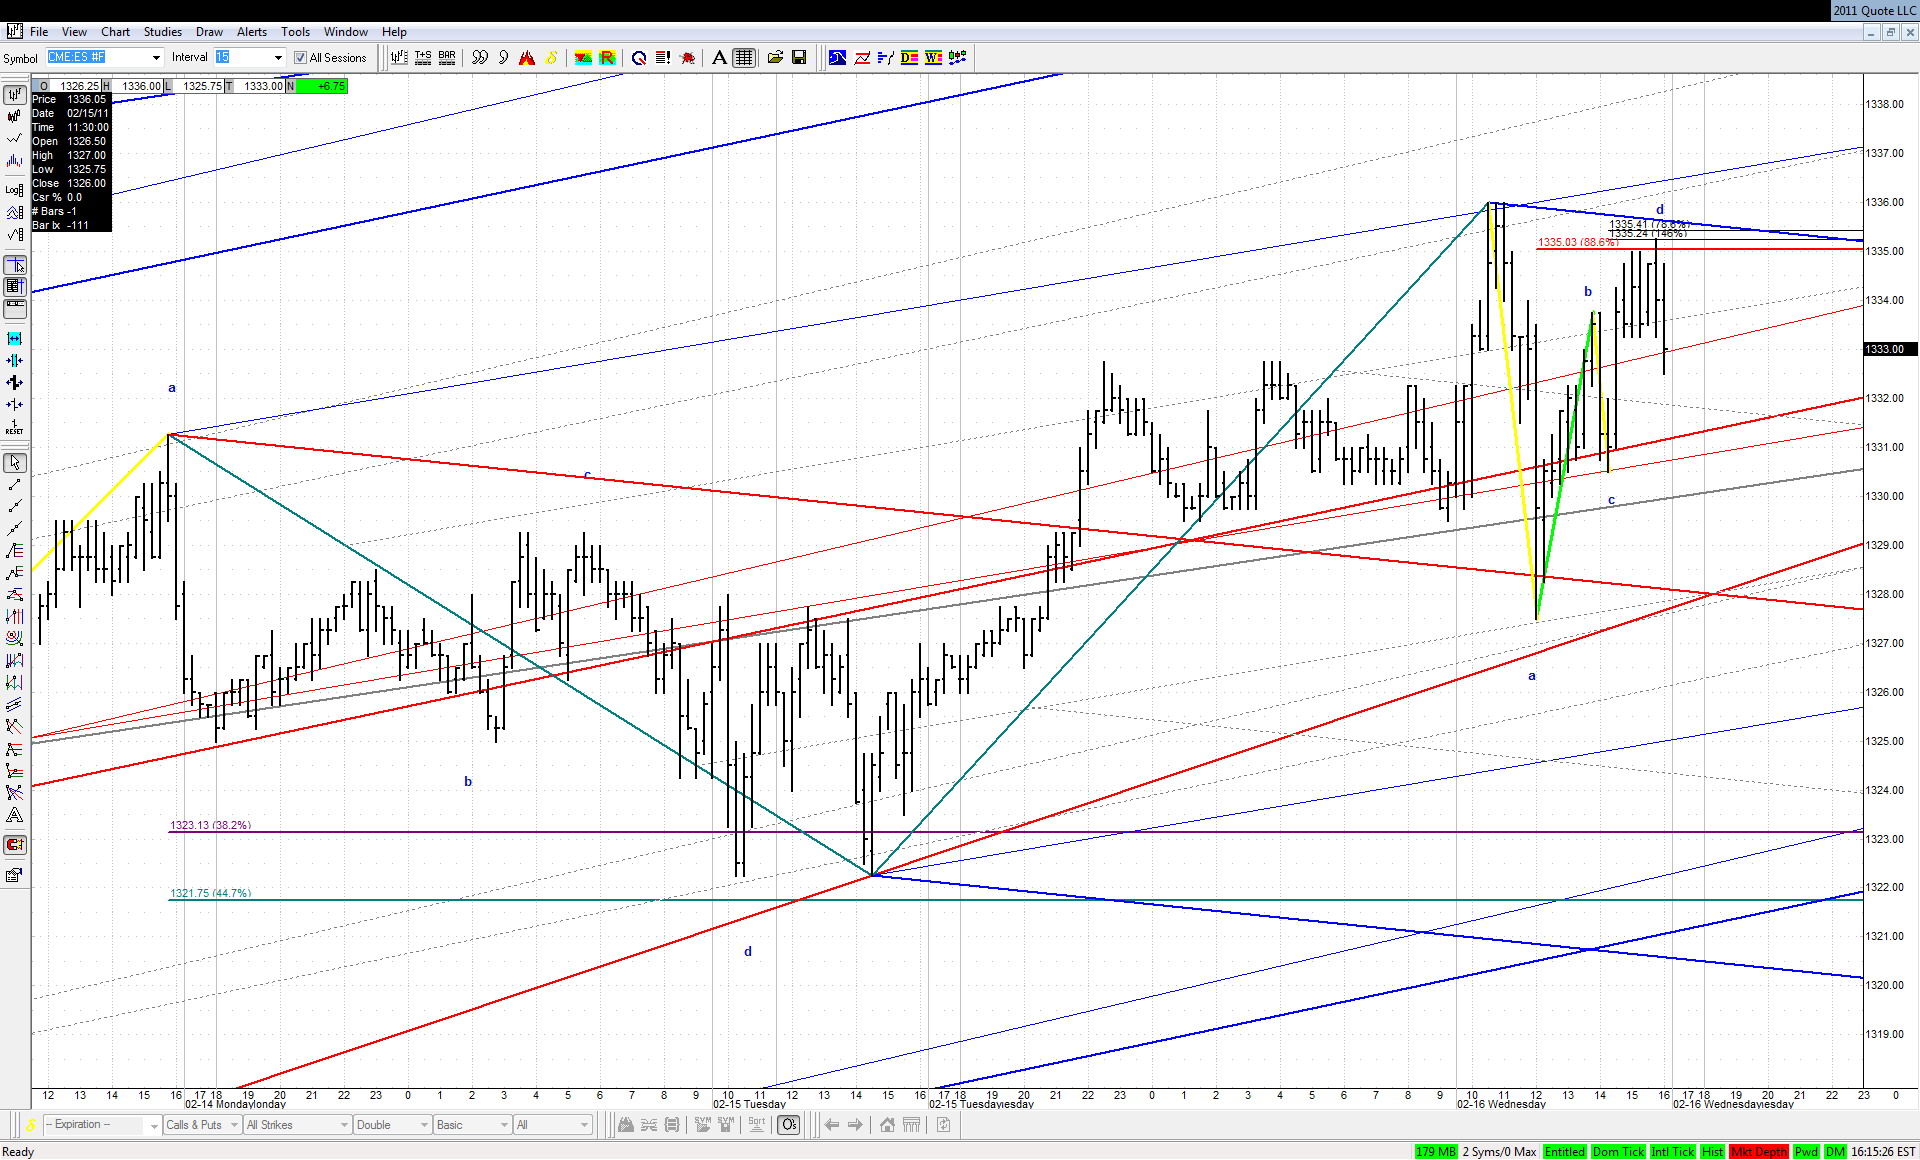
I find it rather curious how my area of patience stopped this dead, where it traded in a tight range for about an hour and a half, closing there. Hmmm, I wonder if that implies it is an important area? Recall my 'close at a key area' theory. And, isn't a funny coincidence that I posted that note right there, mentioning that I plan to see what it does from that exact spot? Coincidence? You all know how Jim feels about most coincidences... Just some food for thought.


Originally posted by jimkane

Nobody minds, do they, if I'm just patient in here, waiting with my long side bias, to see how they resolve this from this spot?
JA
jarek
Rep: 94
Posts: 3,474
Yep - it stopped its rise in rather interesting spot:

Click image for original size


But I won't risk saying that it was a W2 from the top. These times are gone forever
RO
roofer
Rep: 3,689
Posts: 3,574
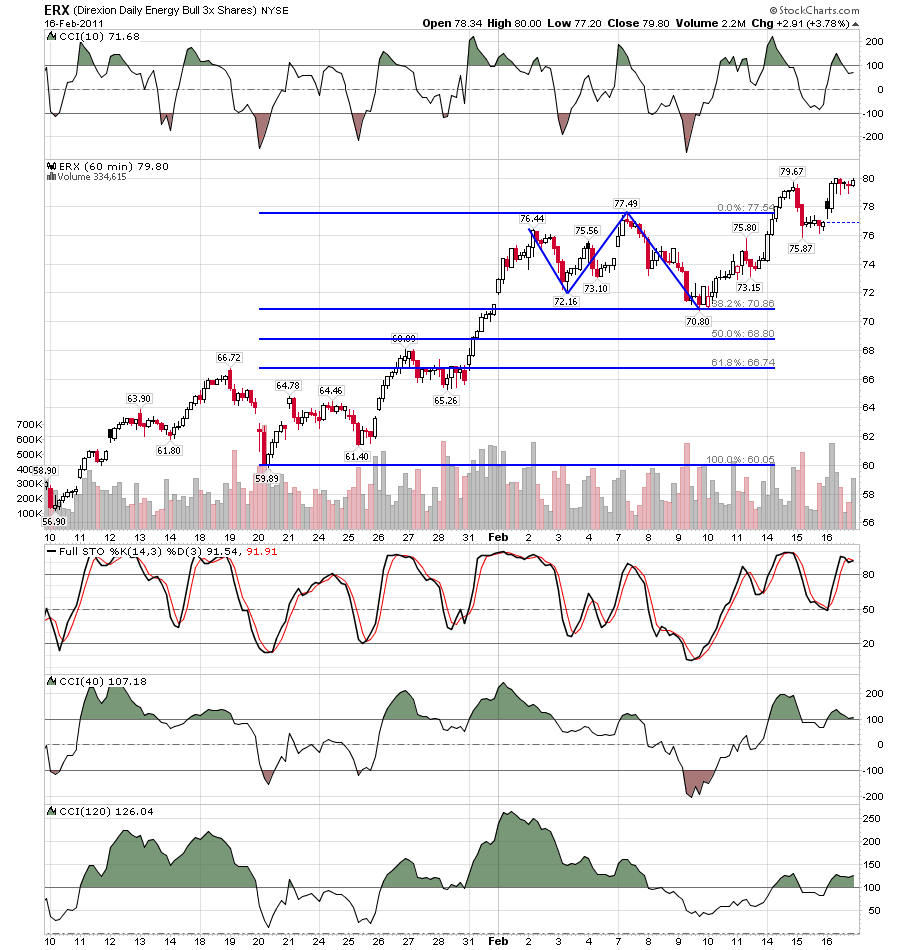
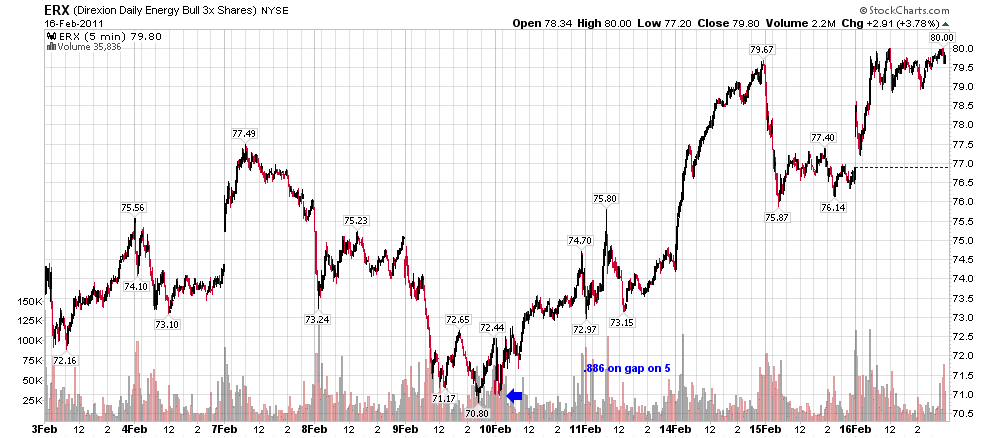
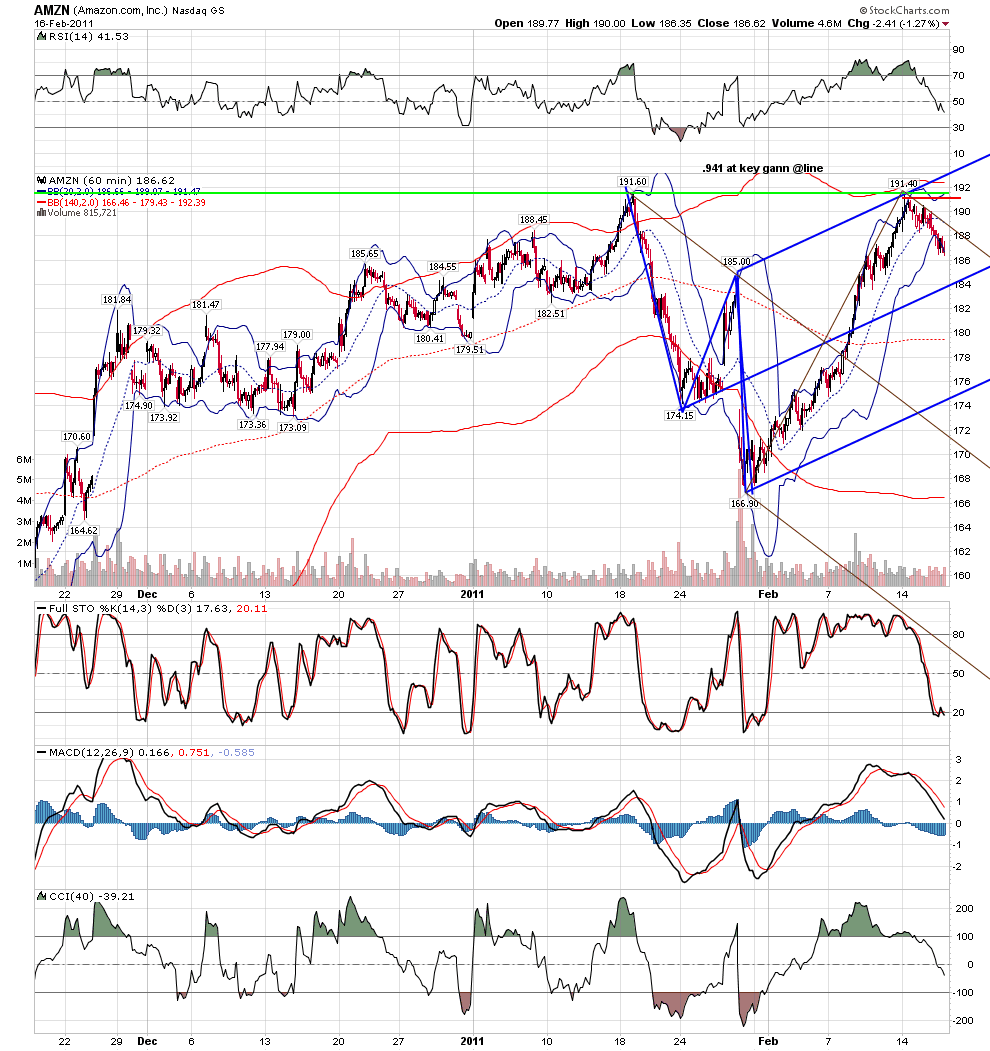
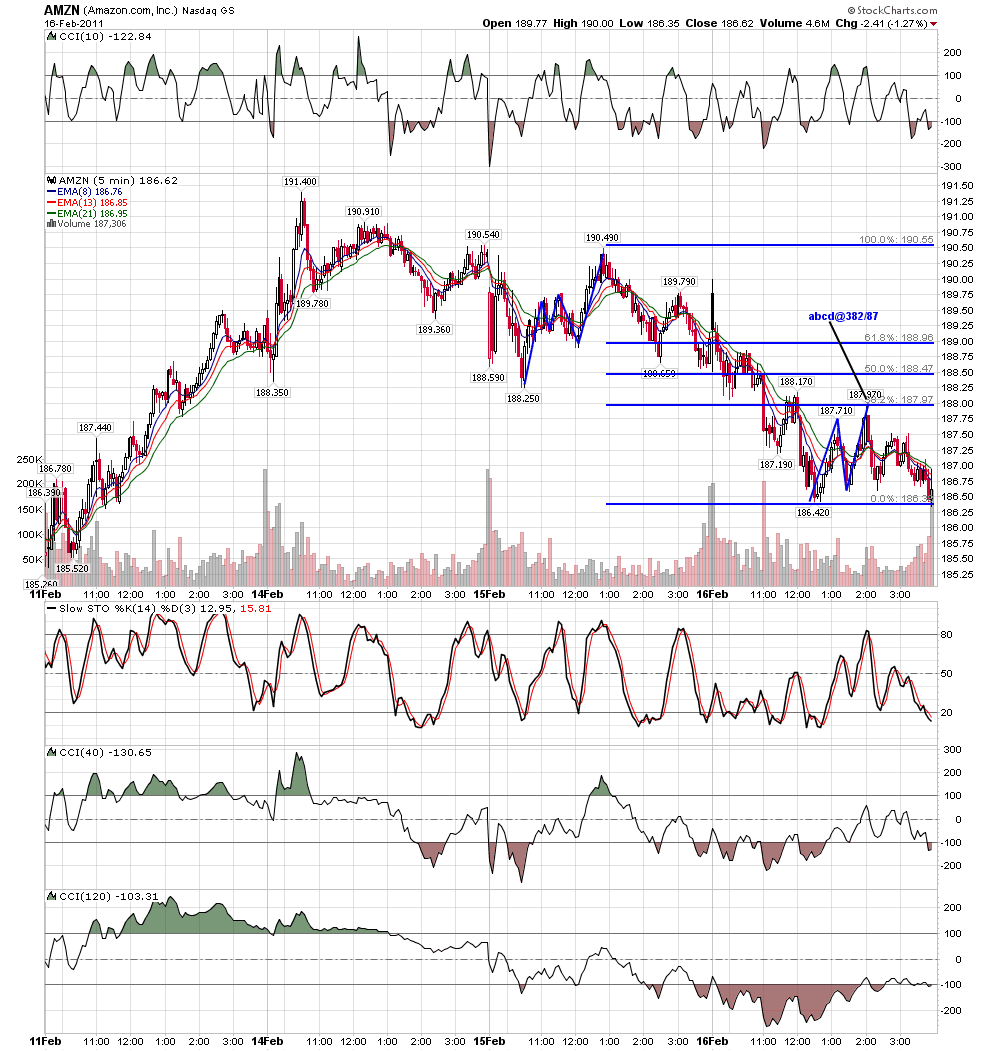
if joed, jim and roofer were ever to write a book,,, these charts would be perfect....joed would explain how THERE CAN BE NO GEOMETRY WITHOUT TIME. and then explain indicators as time.. jim would explain the importance of abcd's and the .382... and i would chime in with my abcd's that complete at .382 and the importance of .886 on gap launching move.....
Click image for original size

Click image for original size
JI
jimkane
Rep: 3,058
Posts: 33,089
That is rather beautiful, I will admit. Like I've said many times before, charts are the most beautiful artwork I've ever seen. So much so that I have some on my walls in my trading room. Great post, roofer.
RO
roofer
Rep: 3,689
Posts: 3,574
crossroads
Click image for original size

Click image for original size

Click image for original size
JA
jarek
Rep: 94
Posts: 3,474
As long as same rising TL contains any decline, bulls might feel safe:


Click image for original size
RO
roofer
Rep: 3,689
Posts: 3,574
as a kane trader would expect... expecting big things tp the downside...ches i hopeyou enjoy it here
Click image for original size

Click image for original size
JA
jarek
Rep: 94
Posts: 3,474
Originally posted by jarek

As long as same rising TL contains any decline, bulls might feel safe:
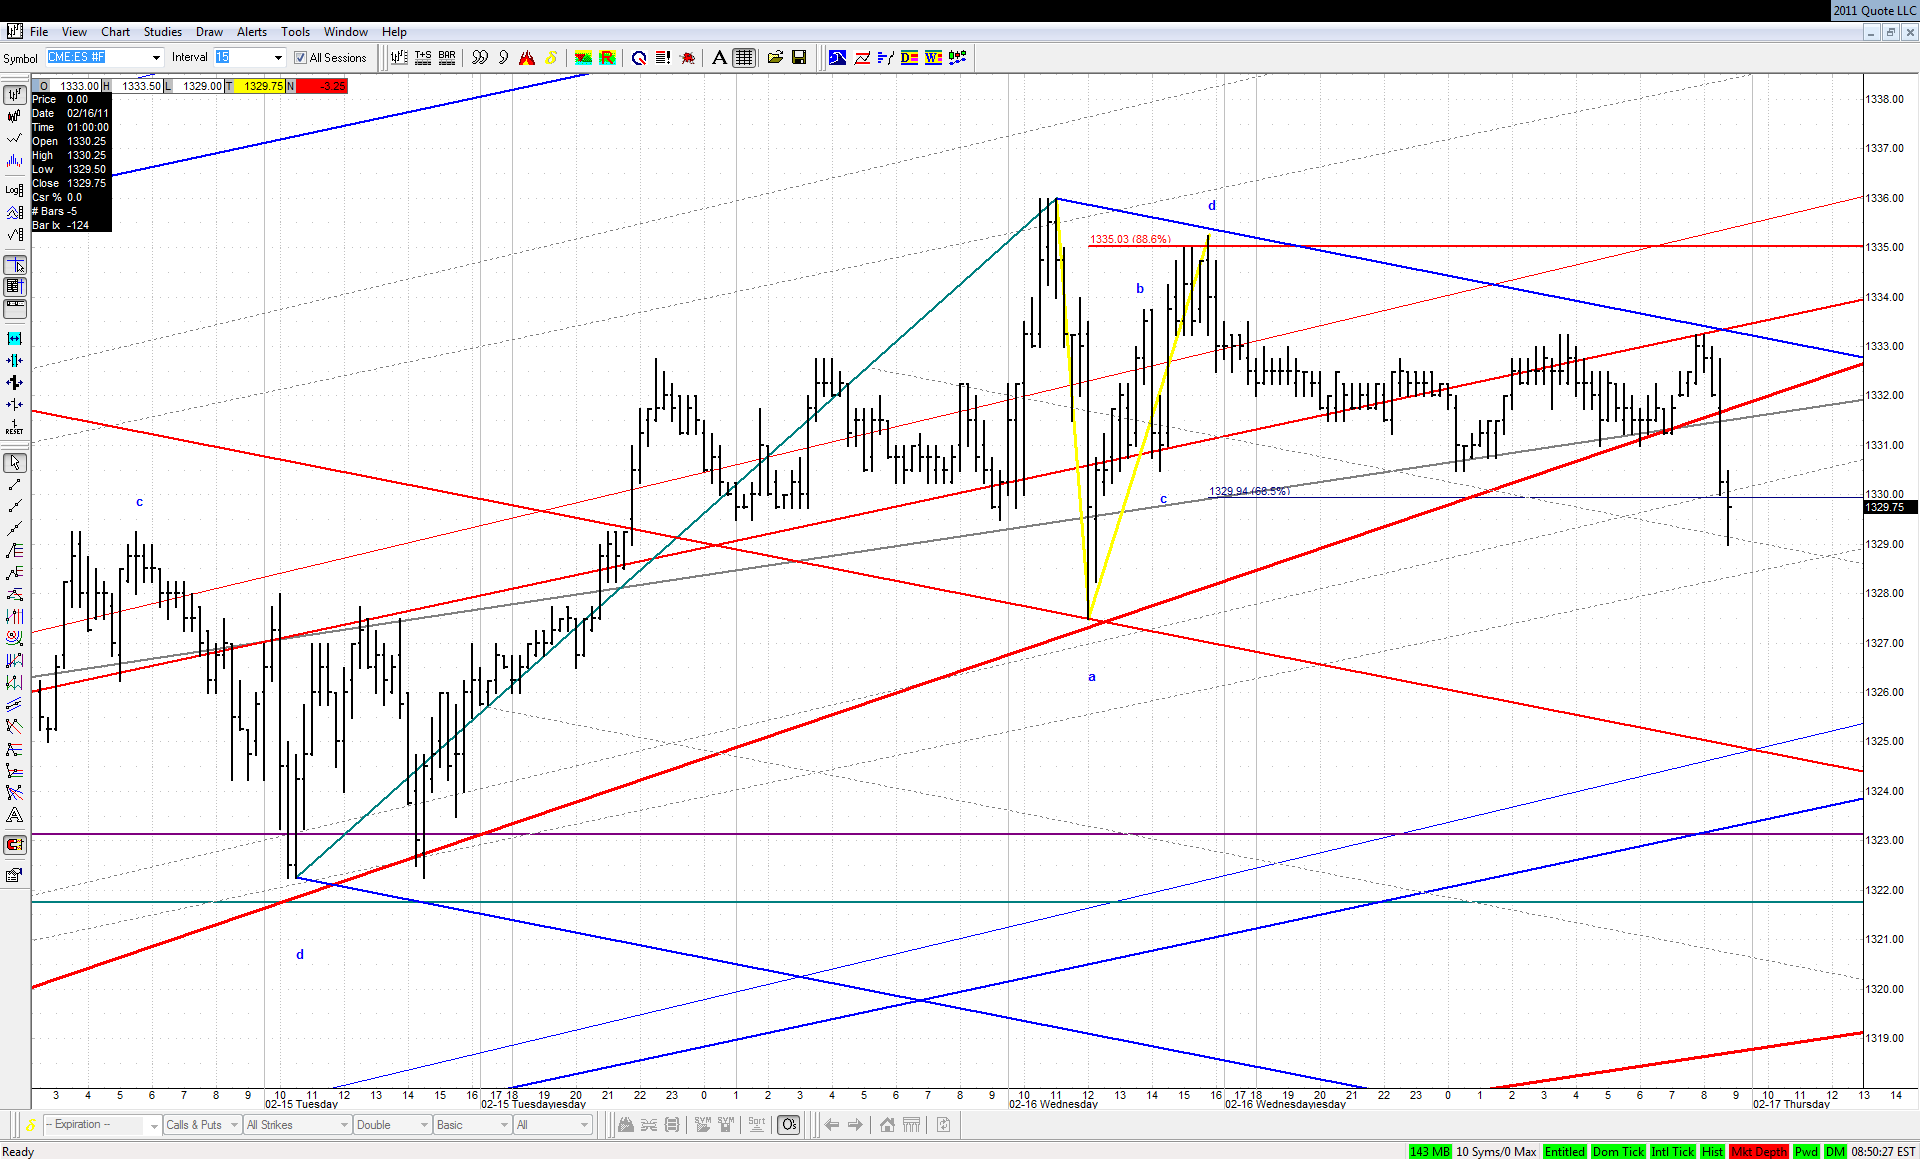

...which is no longer the case:

Click image for original size


Time for a well deserved correction?
JA
jarek
Rep: 94
Posts: 3,474
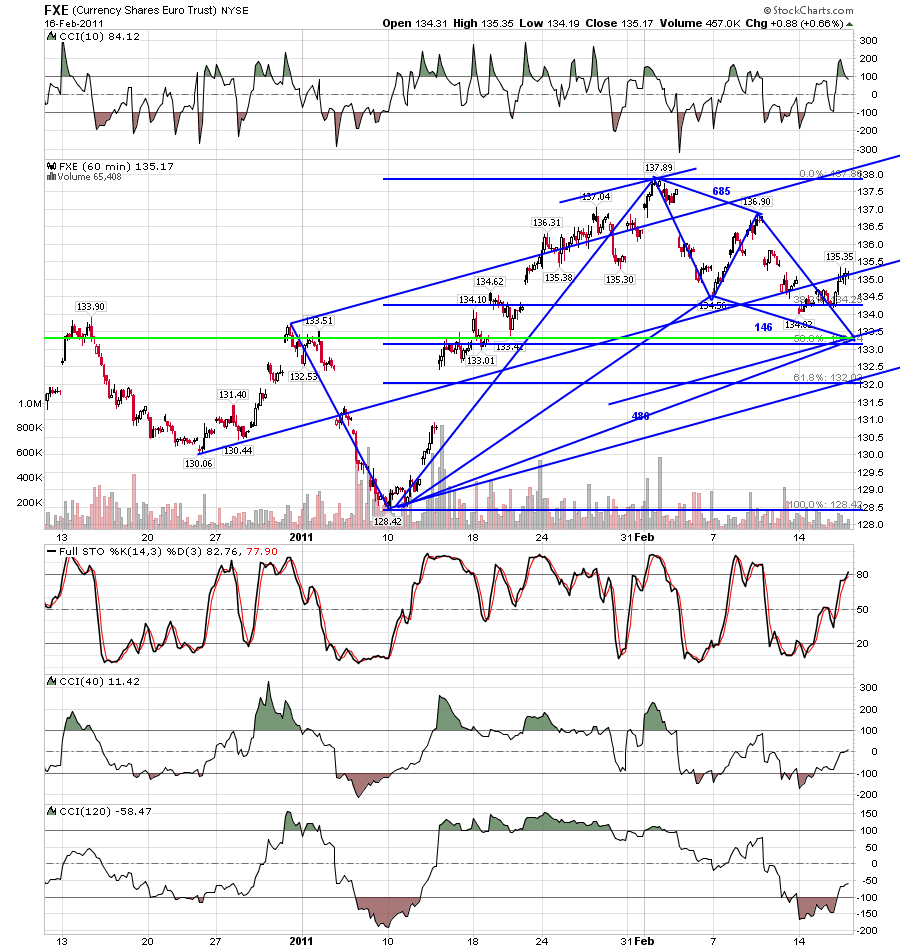
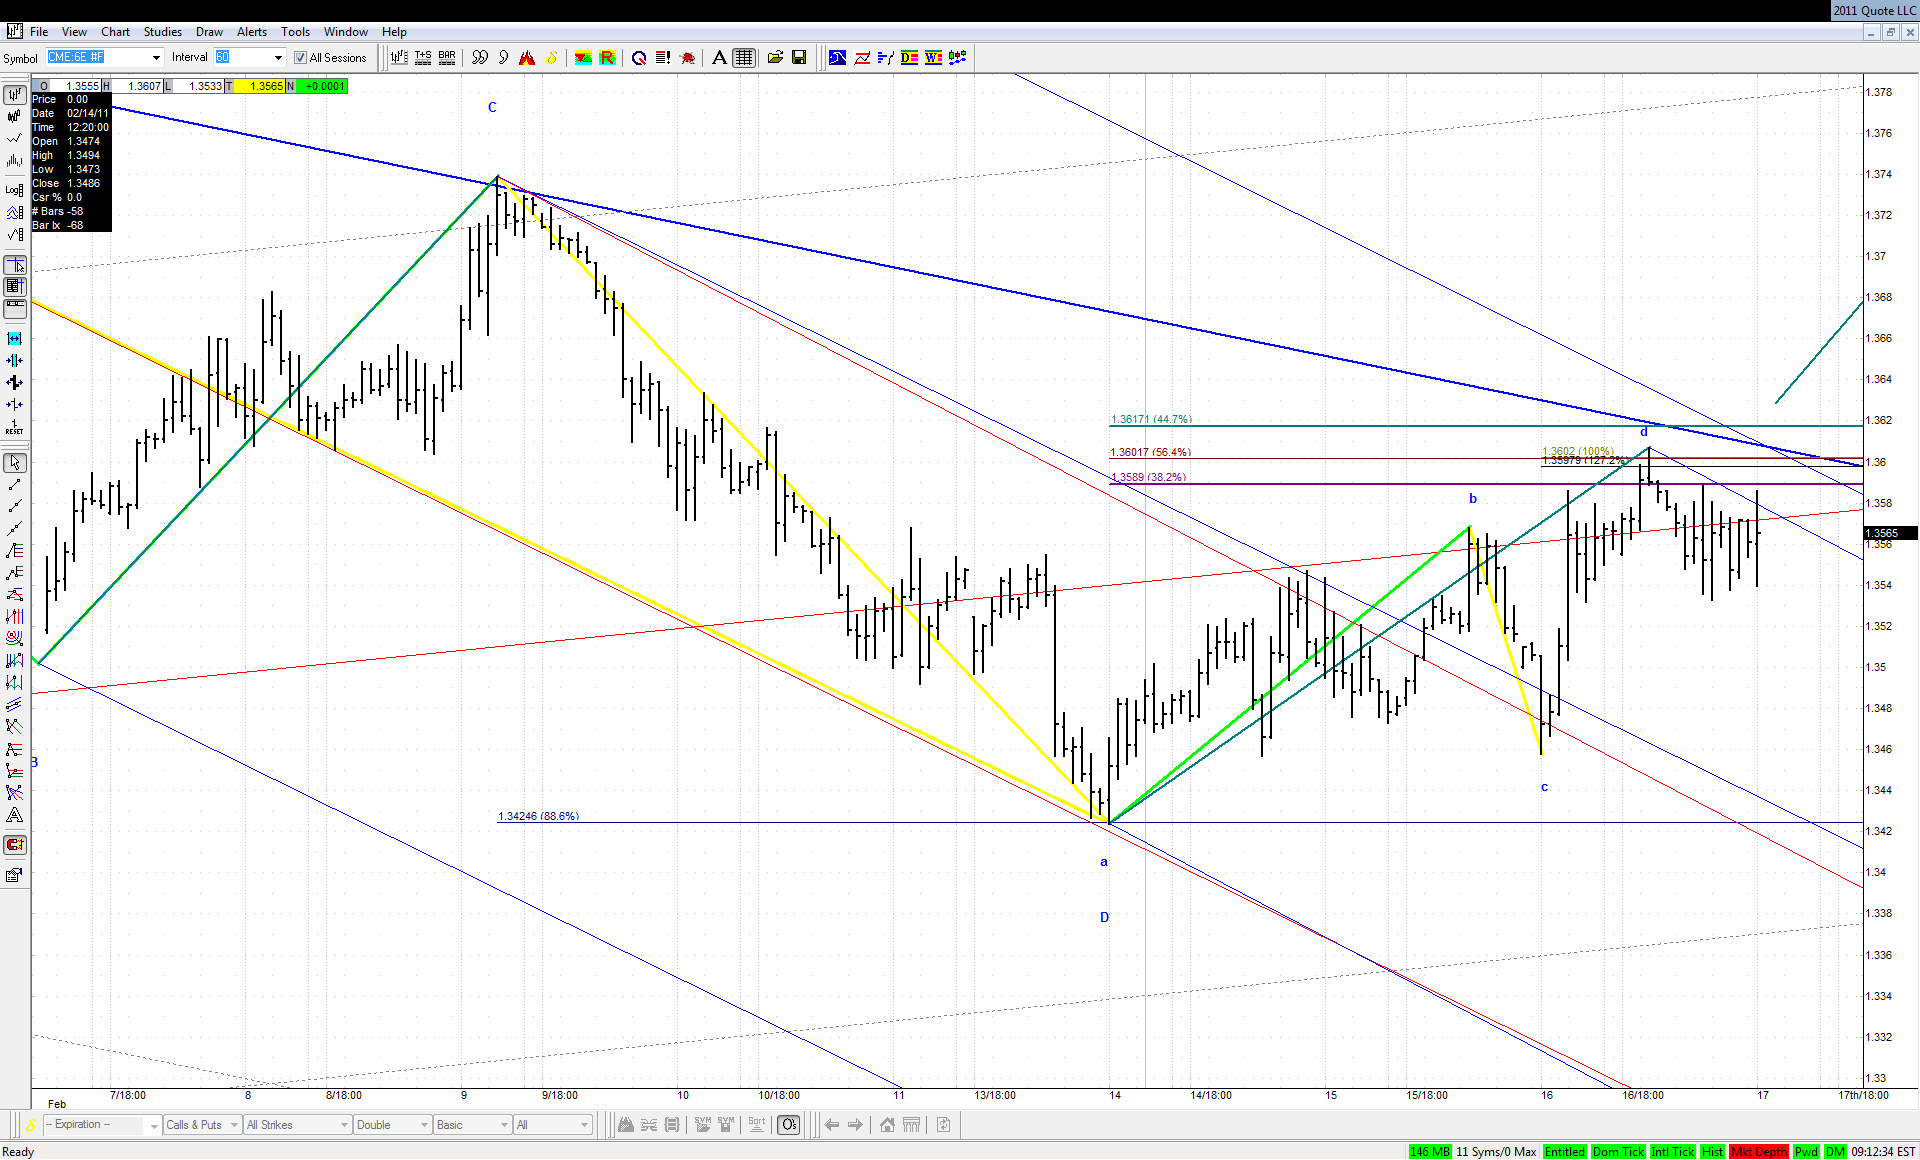
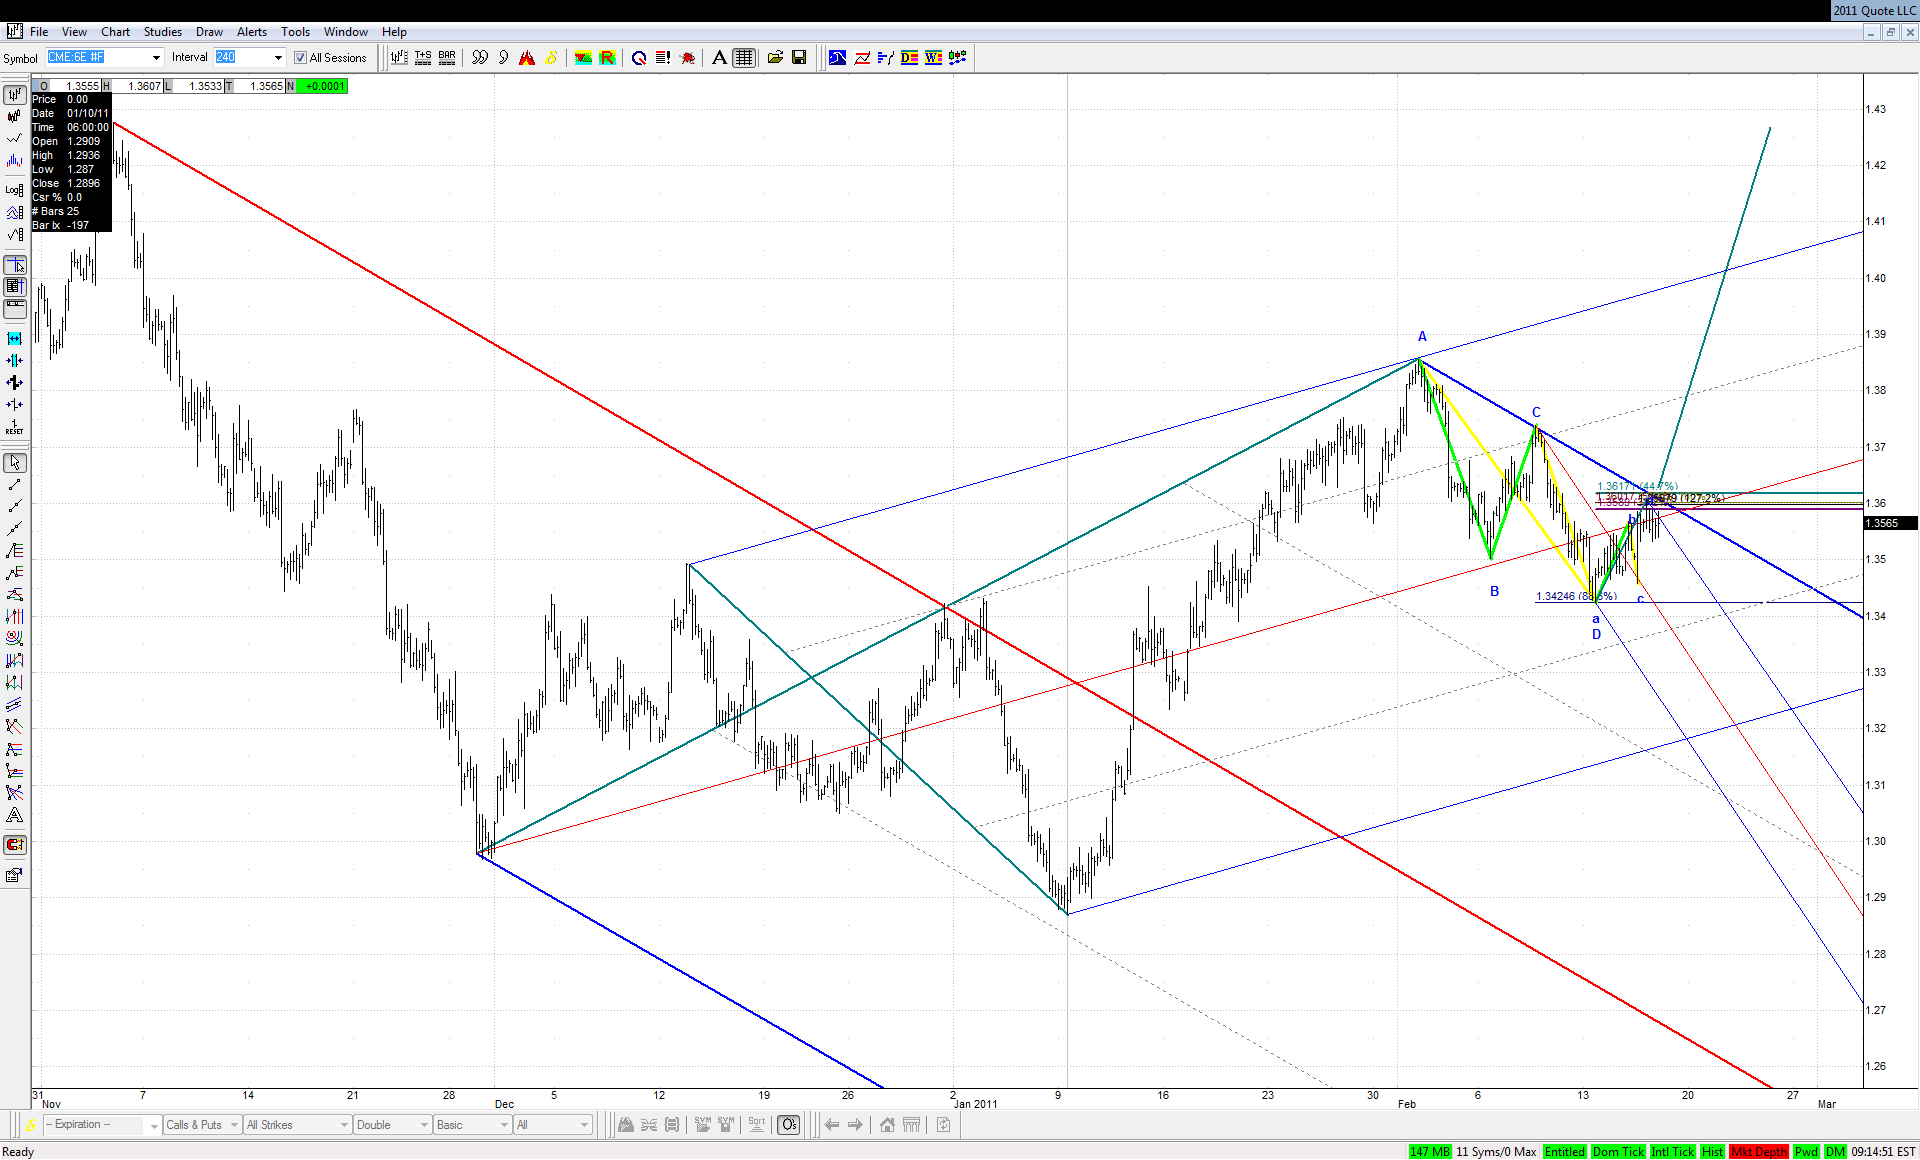
Very interesting development in Euro - bearish KZ ABCD looks as completed and now we have a possible test and retest to start the move off it:

Click image for original size


If a small test and retest would confirm the bigger one, that would really be something remarkable:


Click image for original size
JA
jarek
Rep: 94
Posts: 3,474
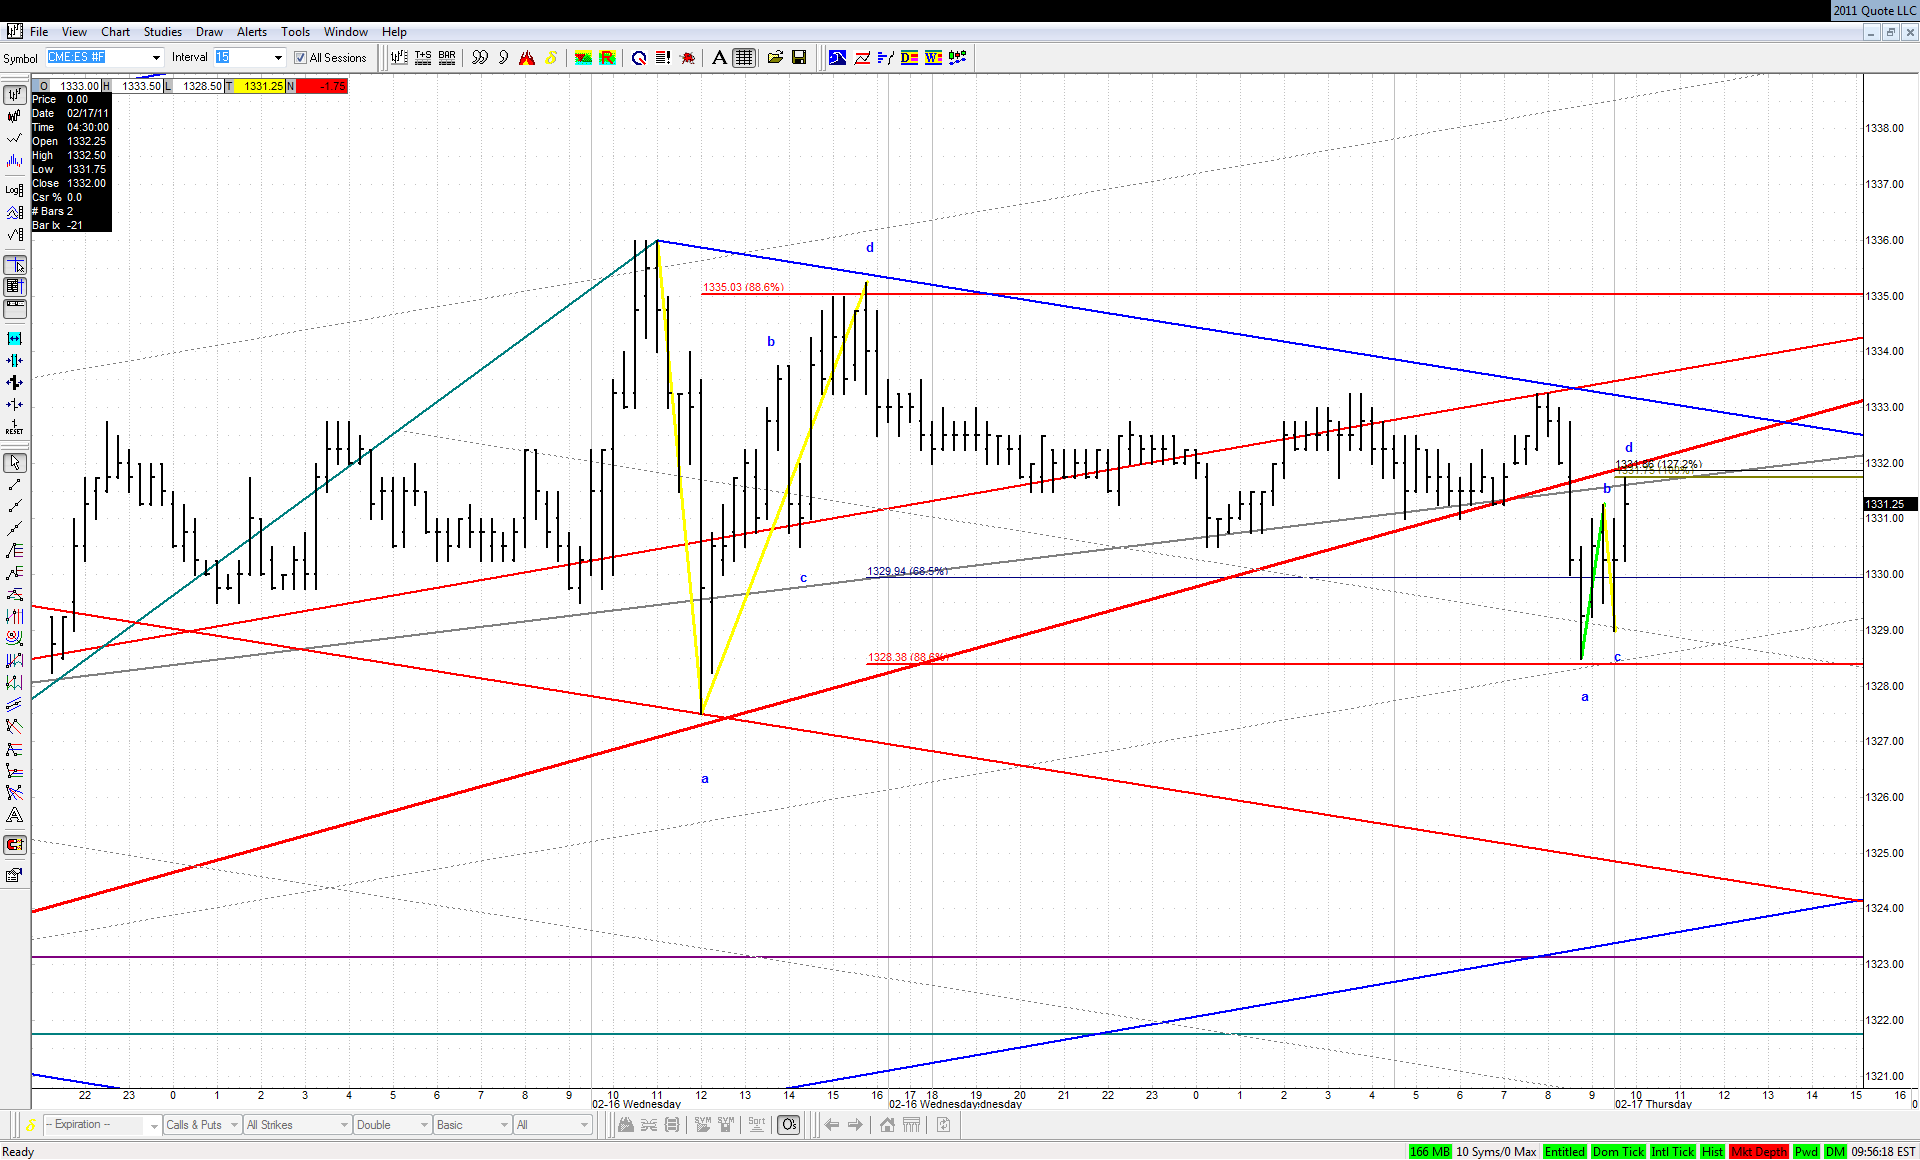
Failure of this small 1.000 bearish ABCD would most probably mean that this downside breakout of the TL was a fake one:

Click image for original size
RO
roofer
Rep: 3,689
Posts: 3,574
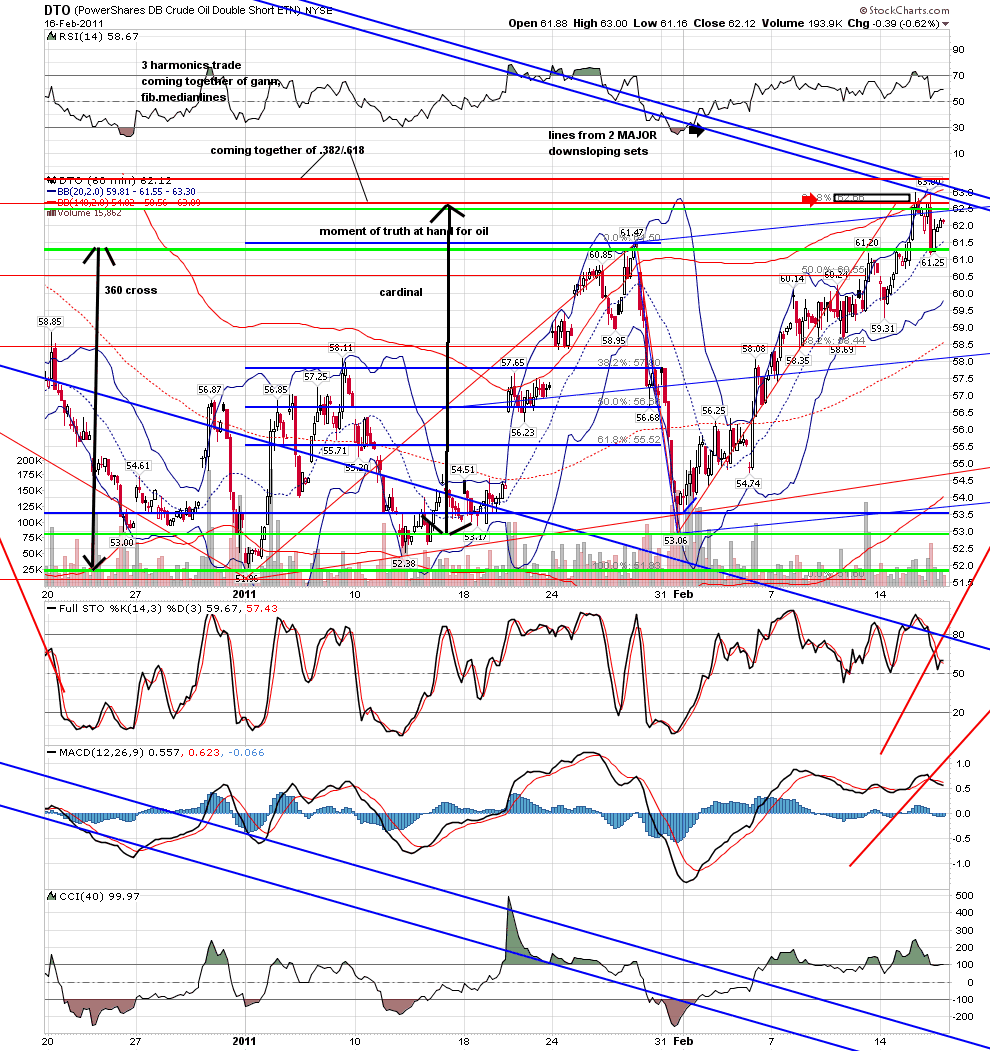
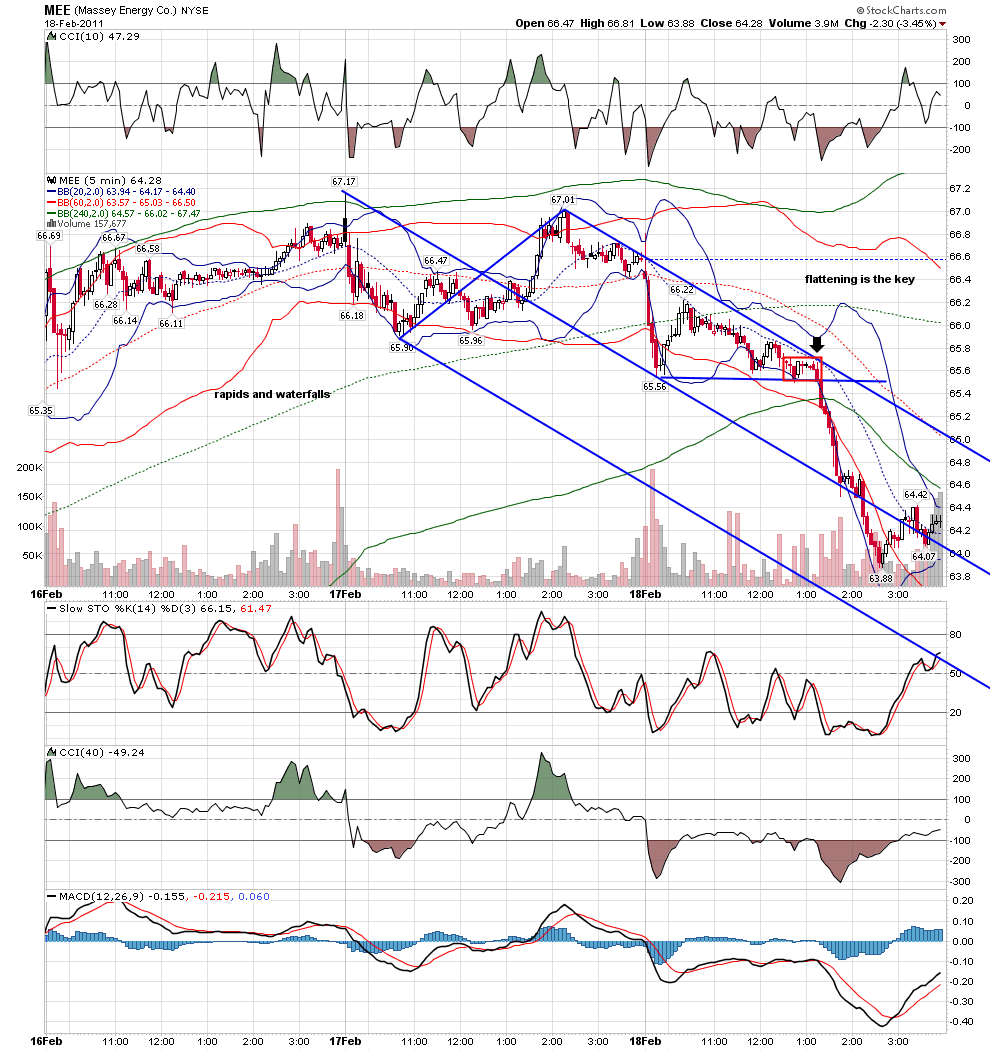
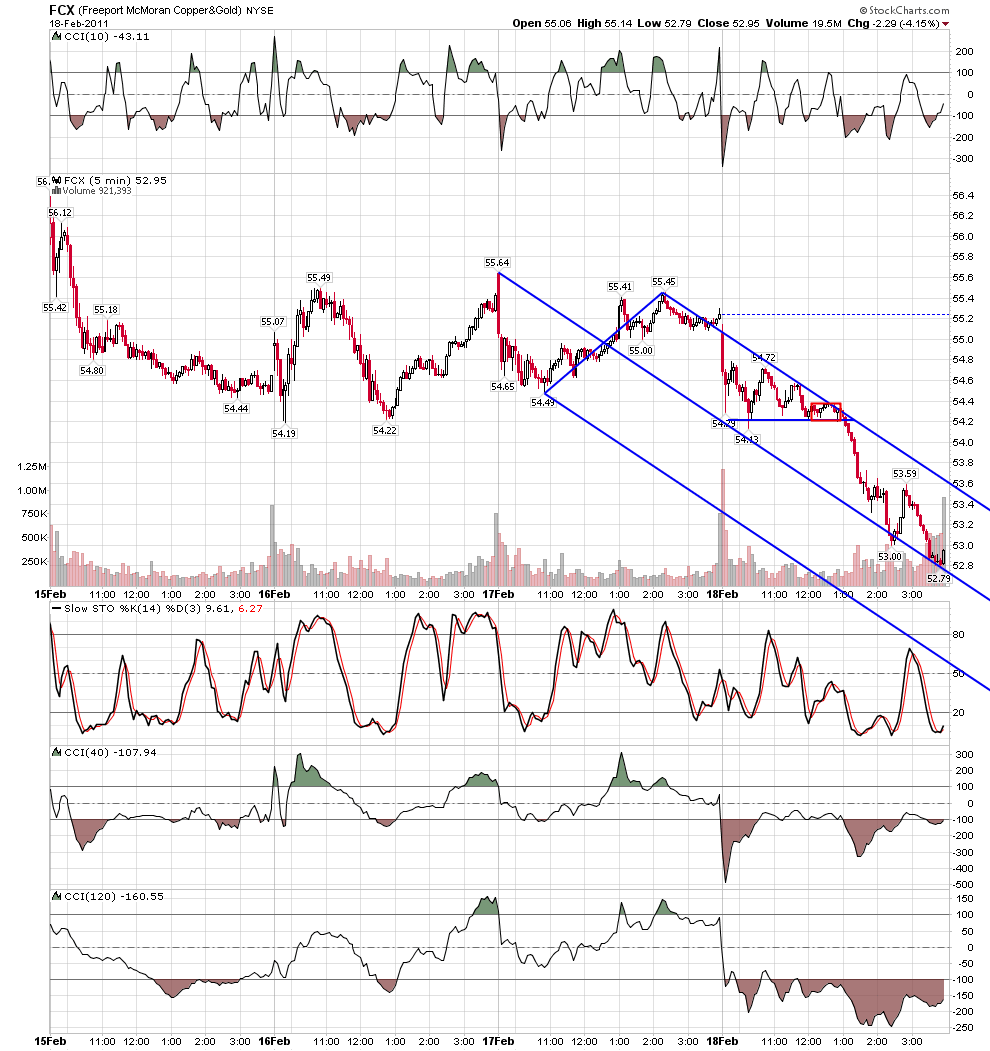
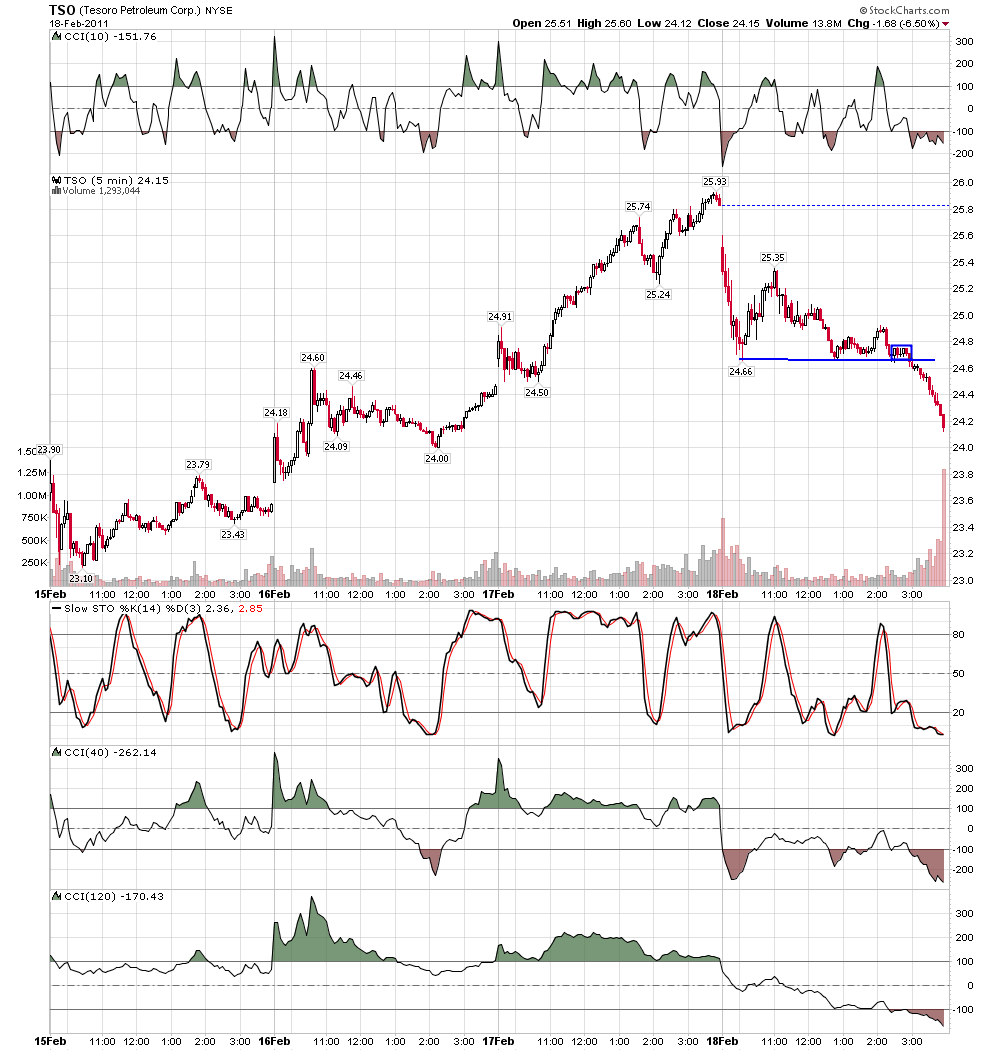
rat 89 will remember this one....it is a rare day when i will short into oversold.... but the pattern repeats over and over.....rapids and waterfall... the key is the flattening right before price goes..under the cover of opex, the computers were using the patterns to get price to the correct strike.... something else.... i feel a wave four triangle of some degree just ahead... the down in many stocks can be seen as the ab leg of abcd's that i think the c will setup just as the triangle leg is set to go....
Click image for original size

Click image for original size

Click image for original size