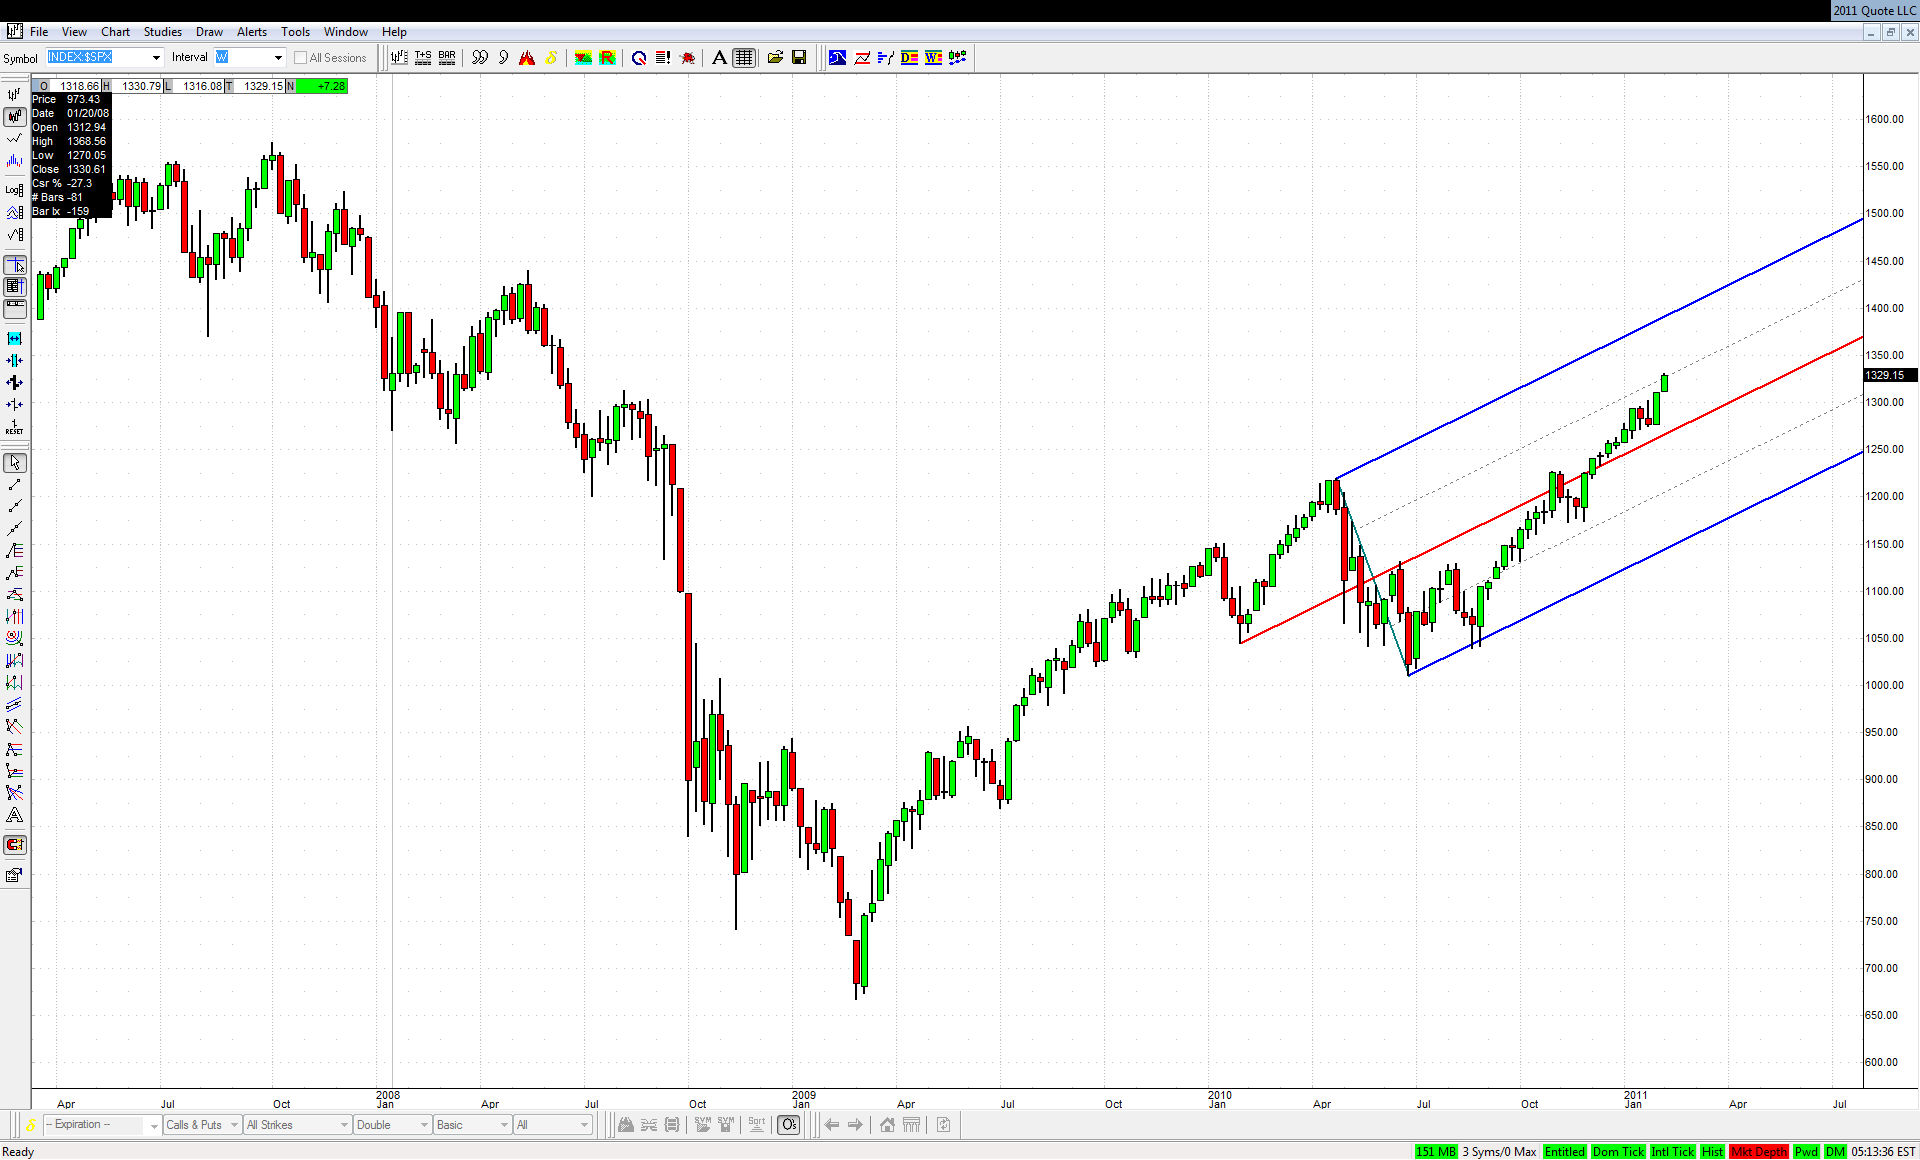
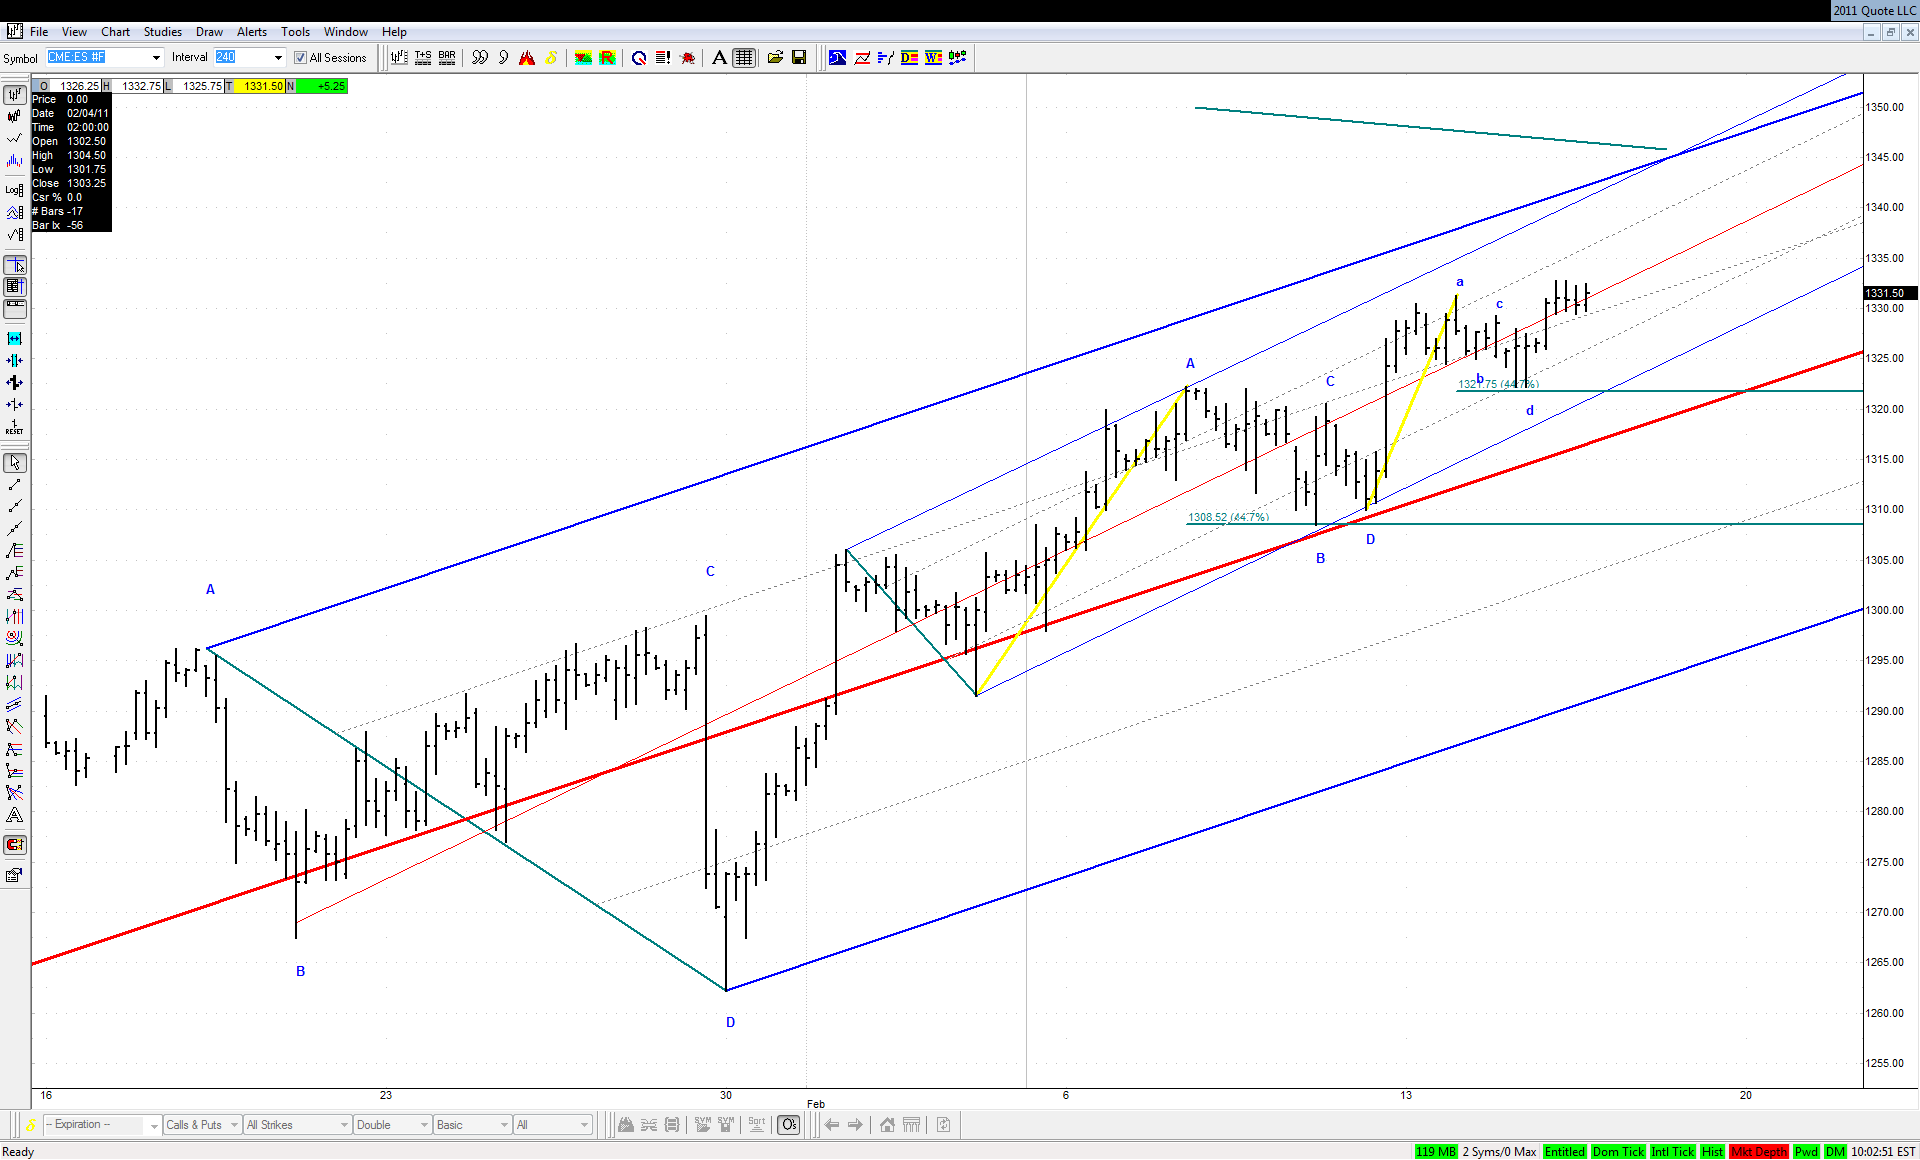
Is the move up that began on Friday a final acceleration to the 1330 area mentioned here couple of times? Or is it a start of something even bigger to the upside to finally convince everybody that this thing is never ever going to drop again? We'll have to wait to know the answer to this question. My personal opinion is closer to the second alternative, but of course I might be wrong. Some people say that the drop from May 2008 to the final 2009 bottom was an extended 5th wave. Such waves are usually fully retraced, and in such case the upper ML of the recent set needs to be met:
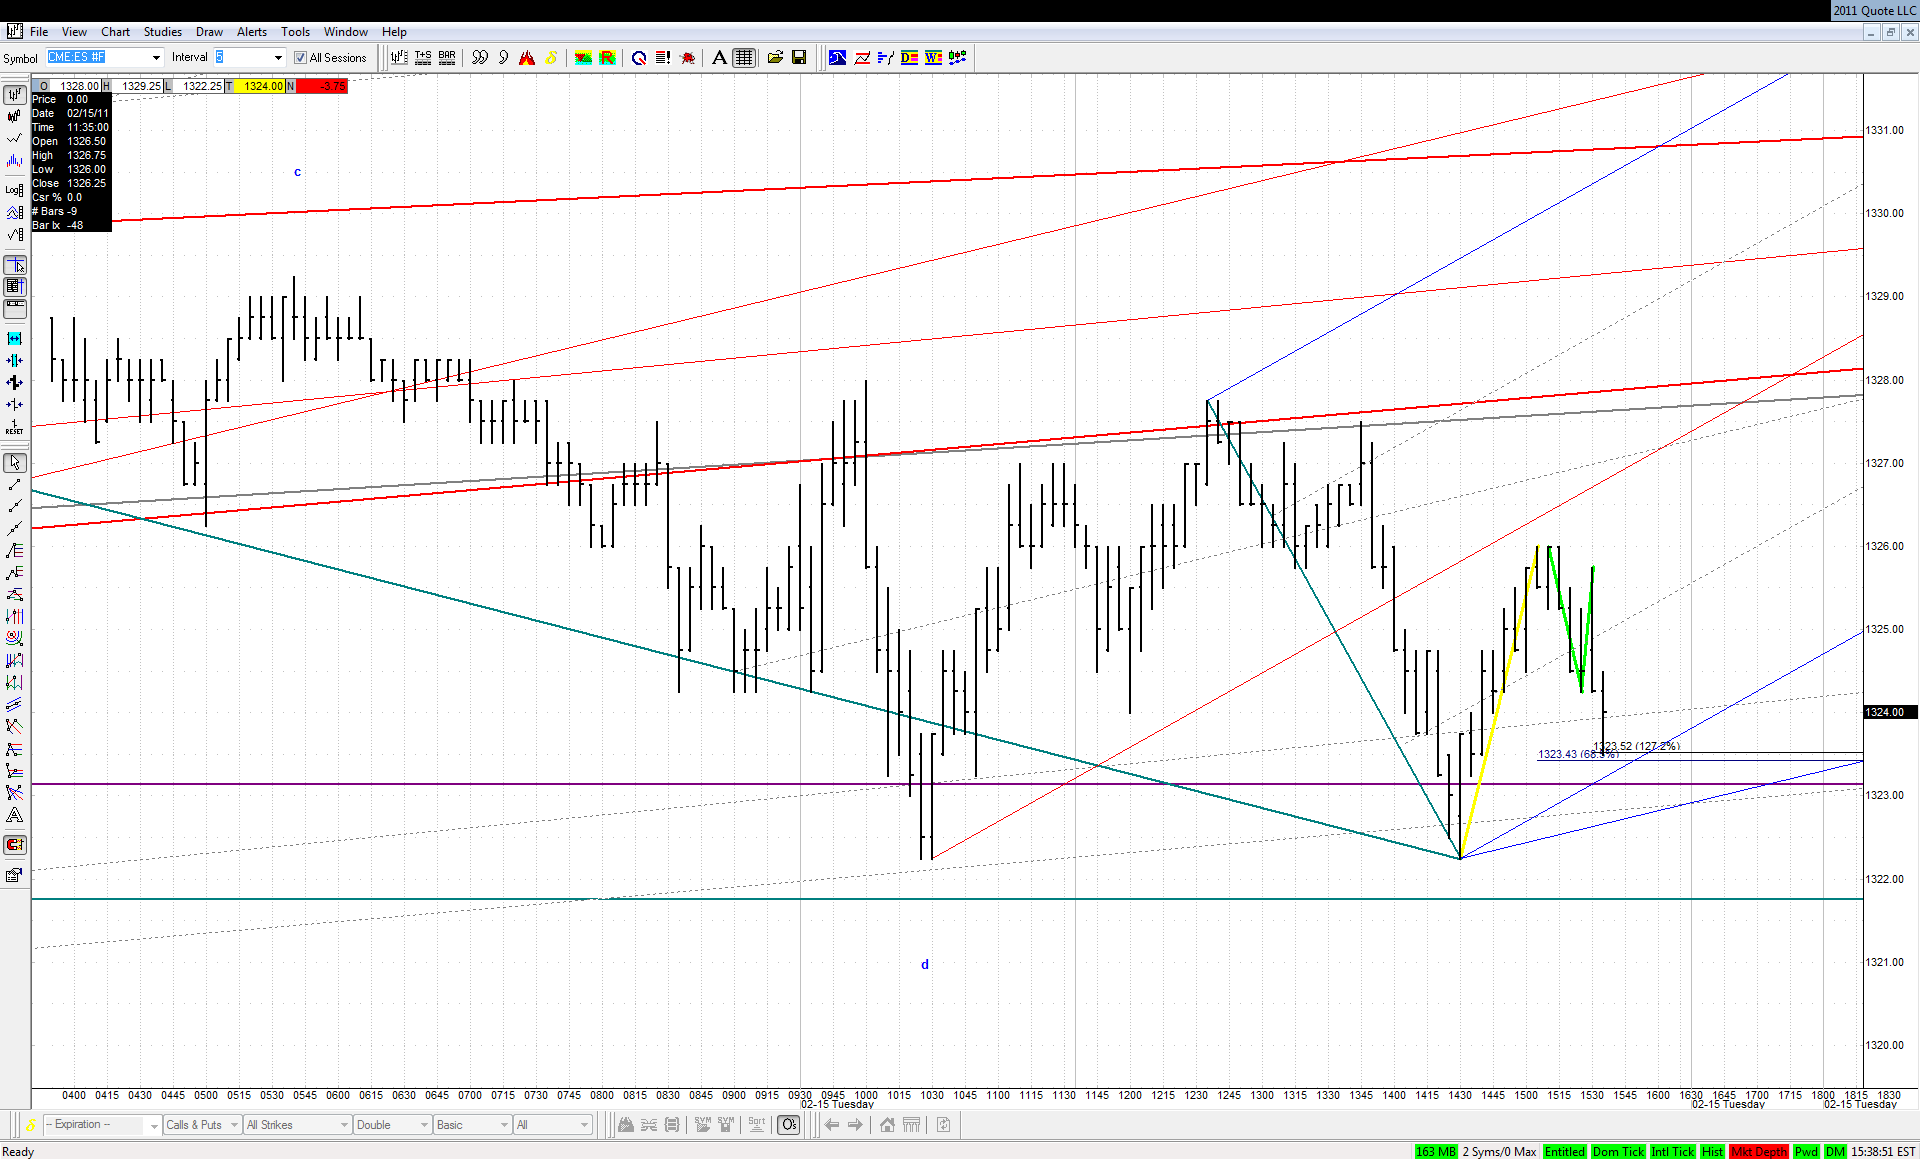
Either bull has some problems or somebody is pretending nicely:
Click image for original size
JI
jimkane
Rep: 3,058
Posts: 33,089
1
I was looking at 26.00 as a high, for a rollover resumption. There is my best key line dead there to the tick (and the line has a proven frequency), with a .685 in the area. Surely something to consider, and that sent it down into that ABCD you showed.
Originally posted by jarek
Originally posted by jimkane
26.00 was that next level...
Was there something more than the Kane Zone of the whole drop?
JA
jarek
Rep: 94
Posts: 3,474
1
(Edited )
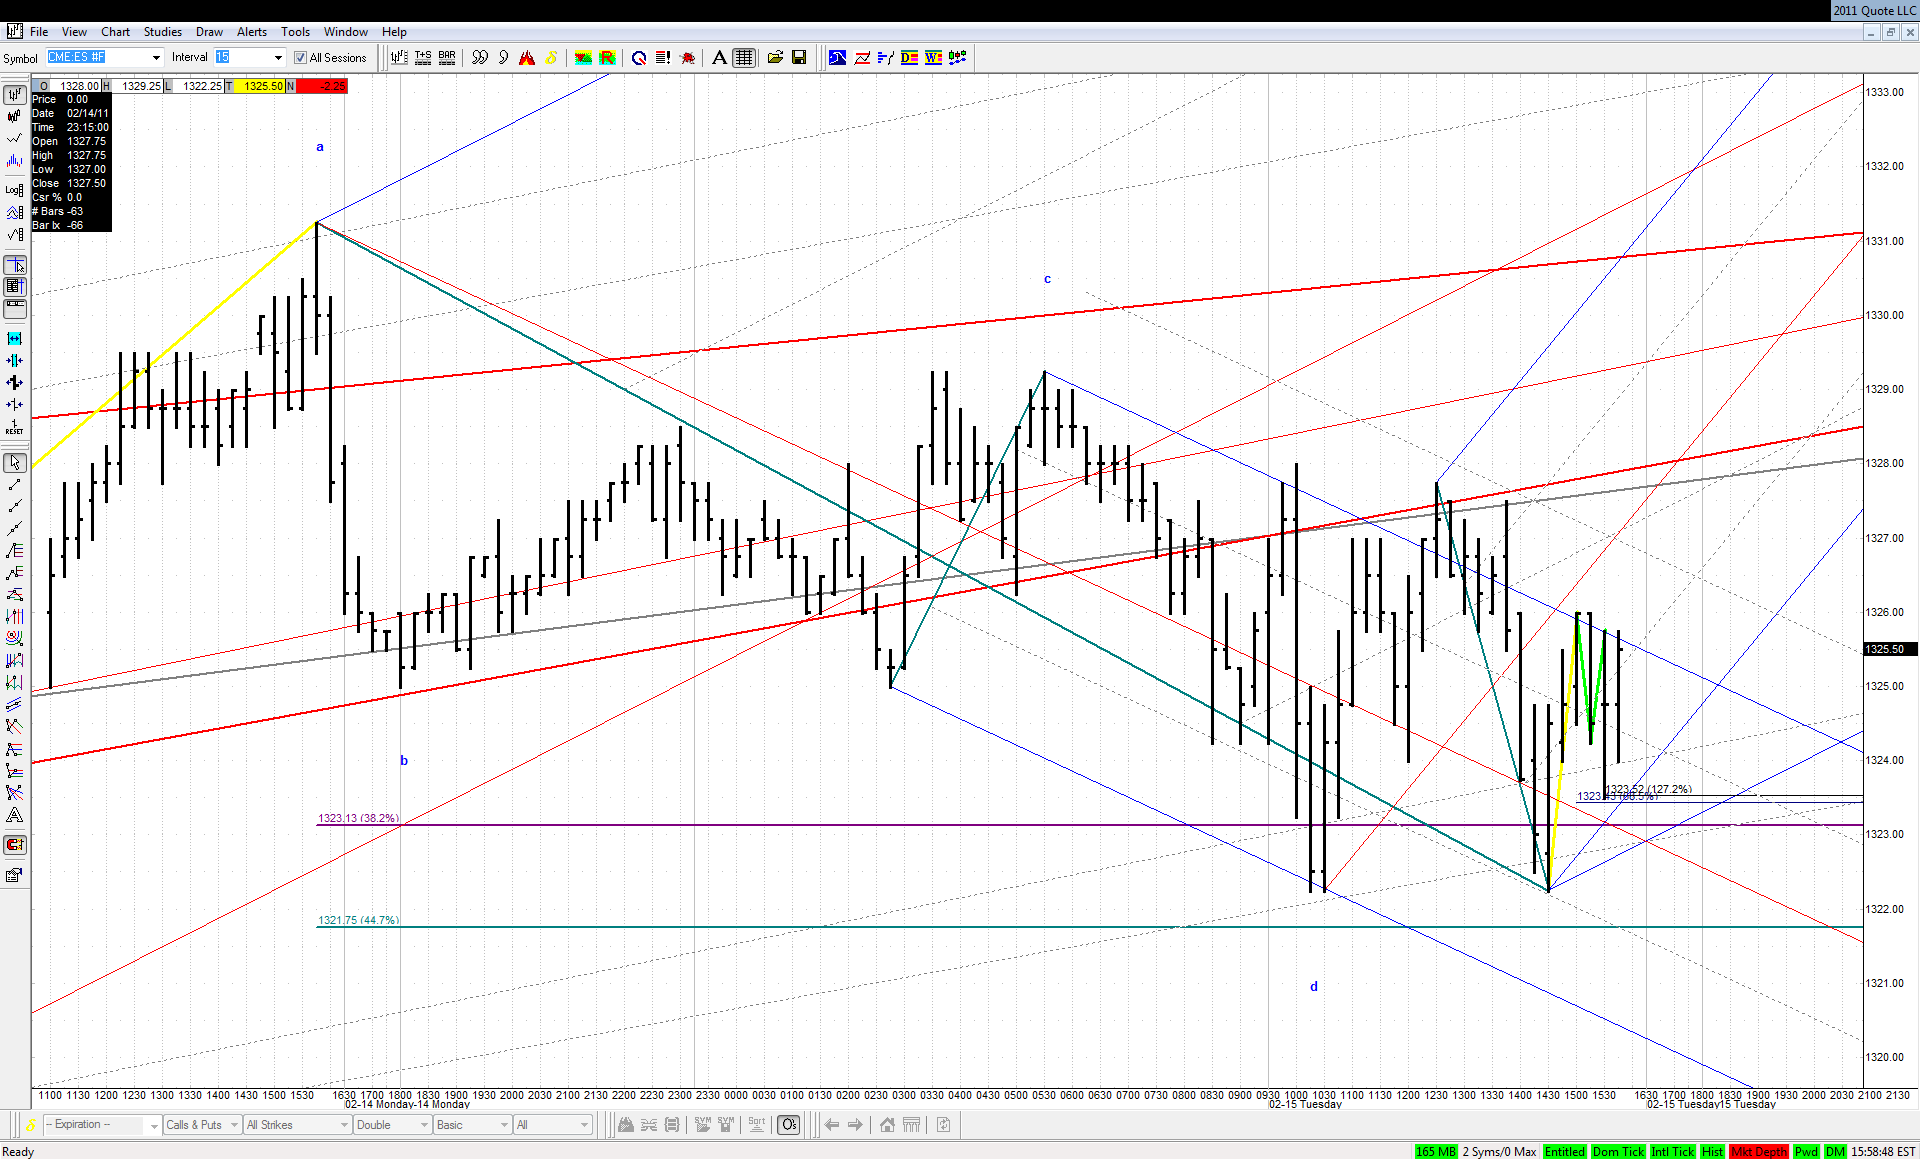
OK - I found it. I was so fixed on the upside that I was not putting enough downsloping sets on the chart:
Click image for original size
... which is a mistake, of course...
JI
jimkane
Rep: 3,058
Posts: 33,089
2
Nice little push up here on the DELL earnings. Super blowout EPS, on light renevue. How do you blow out EPS by like over 40% over expectations on light revenue? Too funny, the accounting nowadays. So, ES is back to the key price flow, for a close in a super-critical area. Can't wait to see how this plays out. In the meantime, DELL must be suspended, as I see no trades right now. Can't wait to see how that goes, too.
Notice my note from yesterday, where I mentioned FDX being down on warning on earnings going forward, and I said 'for how long?'. They gapped up this AM and closed up over 2% higher, at a new high for the recent move, and about a buck from a new high for the entire 'bullsh#%&' market. Hmmm, after a big warning on earnings going forward. Do I have to do the surprised look thing again???
RO
roofer
Rep: 3,689
Posts: 3,574
2
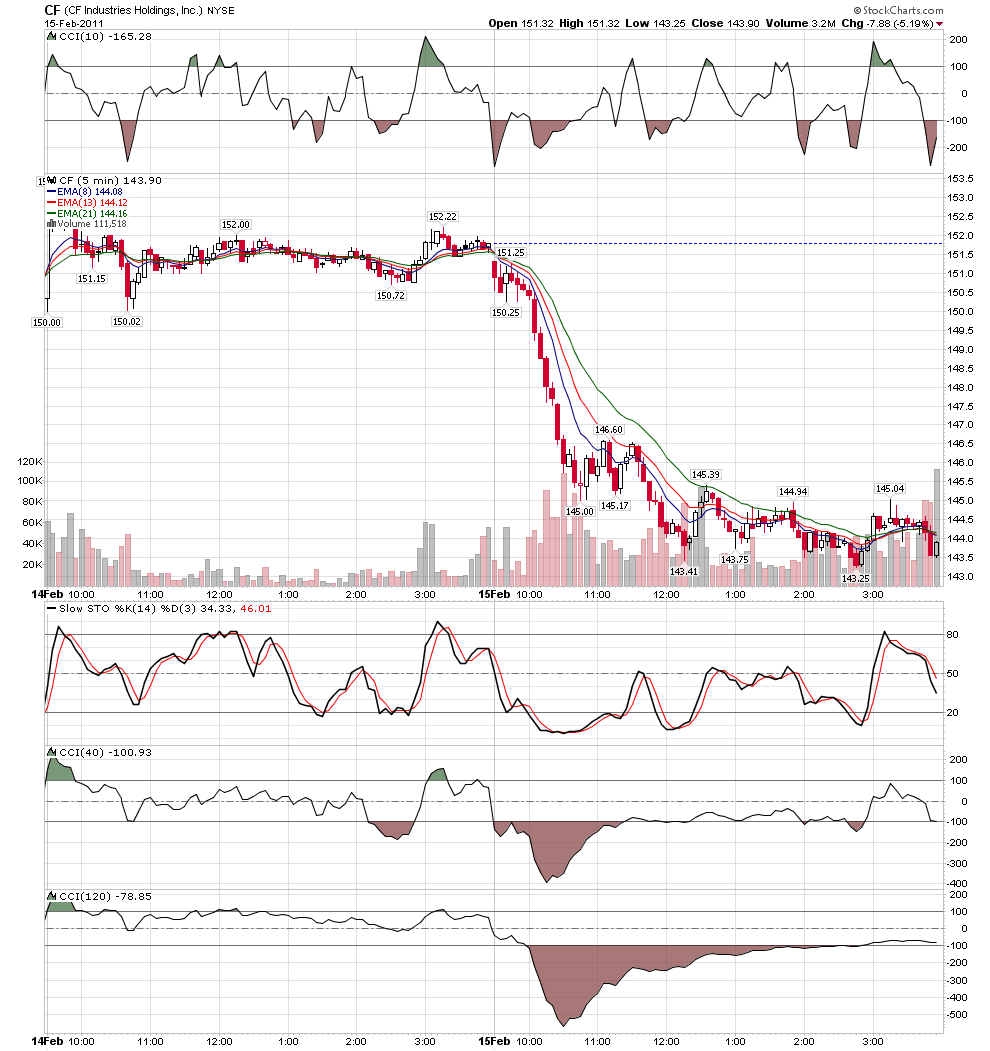
i do not know.. this is the day i expected from the indexes..a big trend down day ...a similar drop in dow would have been 600 points
Click image for original size
RO
roofer
Rep: 3,689
Posts: 3,574
2
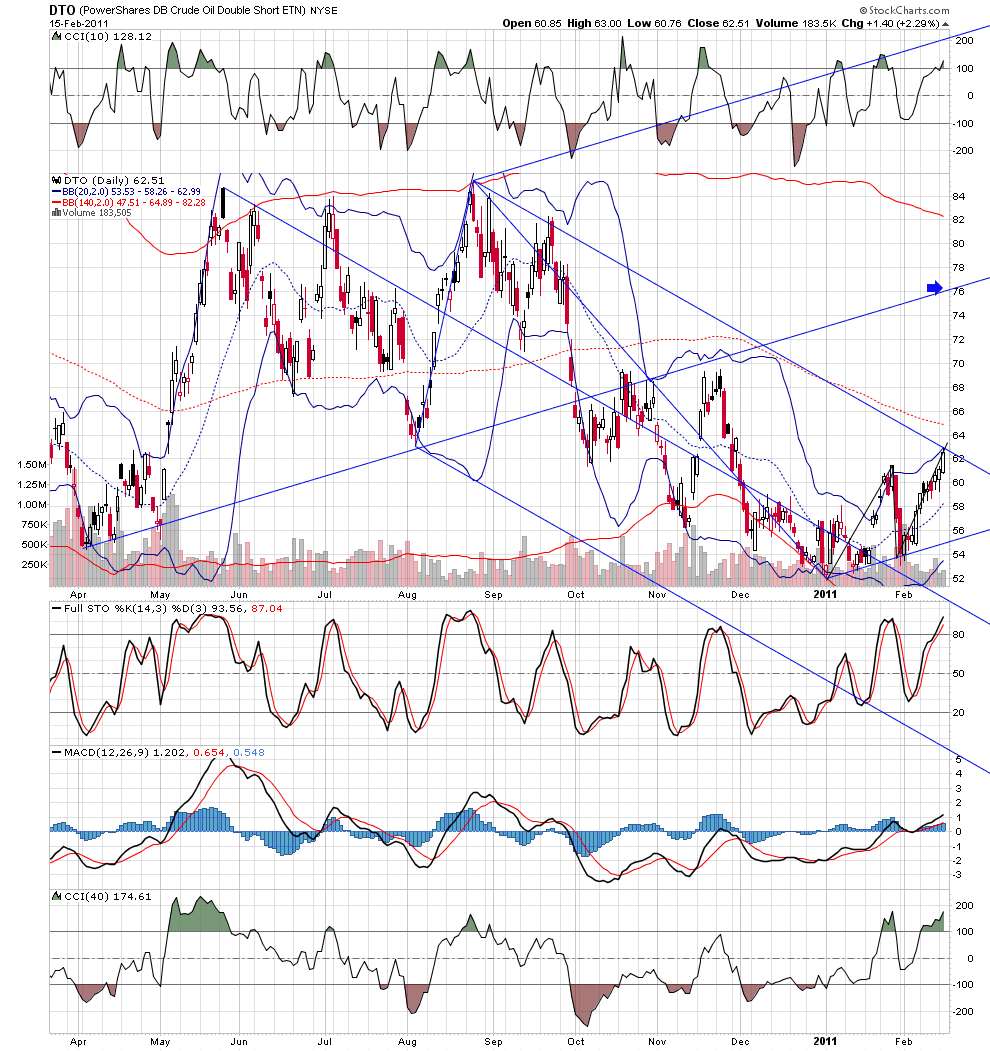
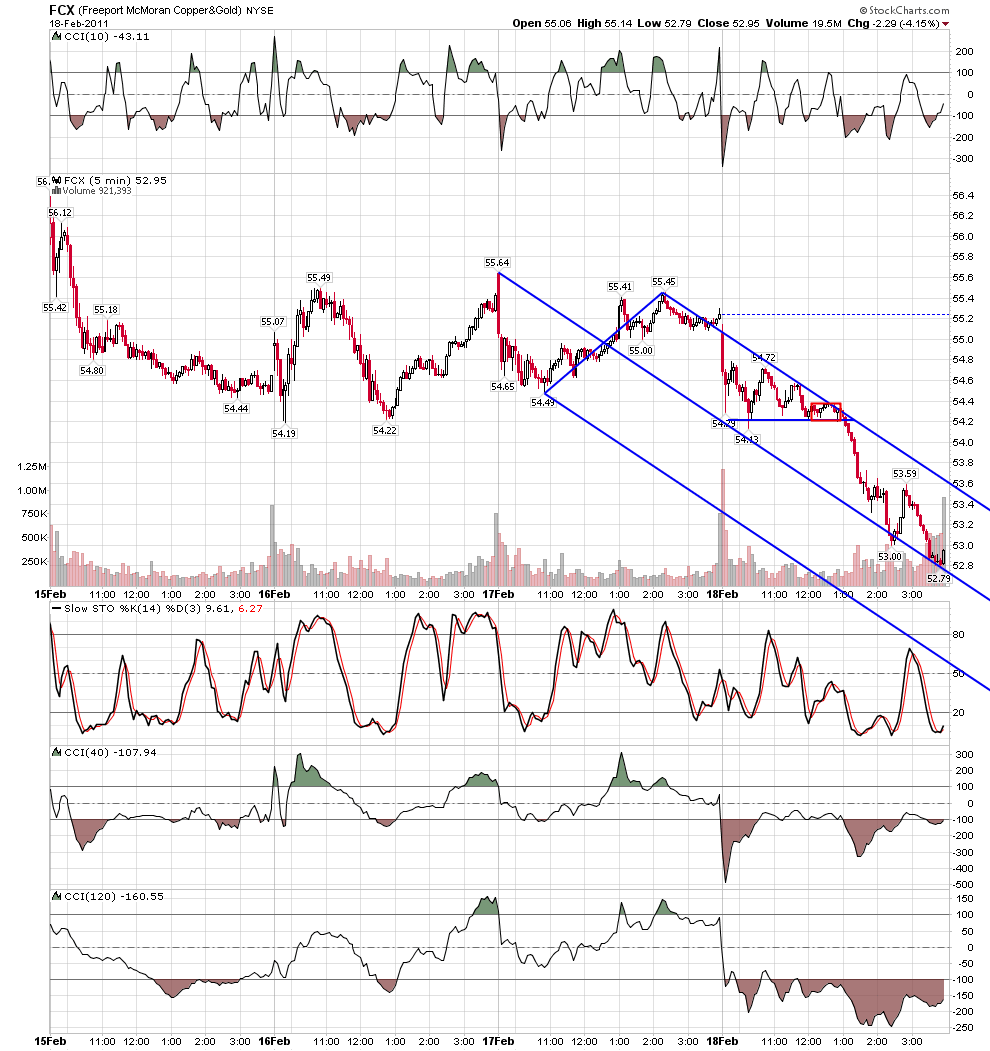
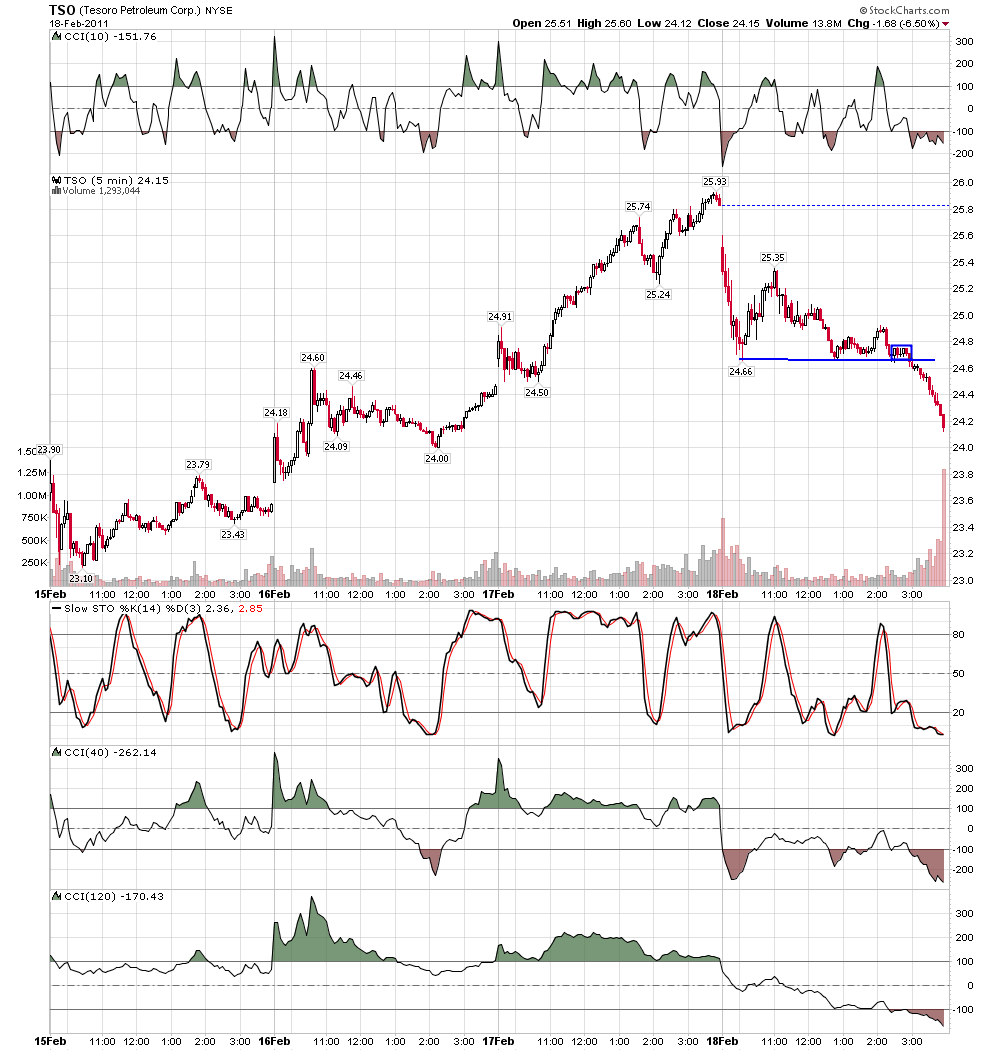
a funny thing happened in oil today.... the geometry set up.... and no body bought..... usually in USO YOU WILL SEE MASSIVE VOLUME at the important turns.... NOTHING.... could it be that the price of oil is about to break down?
Click image for original size
JI
jimkane
Rep: 3,058
Posts: 33,089
3
(Edited )
Great posts and comments, roofer. I'm looking at the big dog, seeing it a few pennies from a new all-time high, seeing no real general selling anywhere (like in the $MID), seeing FDX up on bad earnings, DELL exploding on a revenue miss, and seeing crude setting up and starting to move up off an area I'm watching, and I just don't see the down move yet. With the ES sitting 4 points from a new high for the entire bulls#%&' market, it just hasn't started yet for me.
I'm ready, gun is cocked, finger is on the trigger, I'm waiting, but I tend to shoot when I see the whites of their eyes. I rarely ever shoot in anticipation of a move. So, although I'm on high alert, I need to see them start it down first. It may be starting tonight in GLOBEX, who knows, and I'll be checking that and I have alerts set to wake me if need be. Until then, though, it wouldn't surprise me to see new highs again and again. Sure is set up for a downdraft, though...
JI
jimkane
Rep: 3,058
Posts: 33,089
3
Didn't take them long, as I suspected it wouldn't. There's the new high for the entire 'bulls#%&' market, and not by a few ticks. 1332.75. What a rocketship blastoff that was. I'm just staying on the long side bias, same as I have been, until I 'see the whites of their eyes'. Maybe that's in the middle of the night tonight, and maybe that's two years from now...
JA
jarek
Rep: 94
Posts: 3,474
2
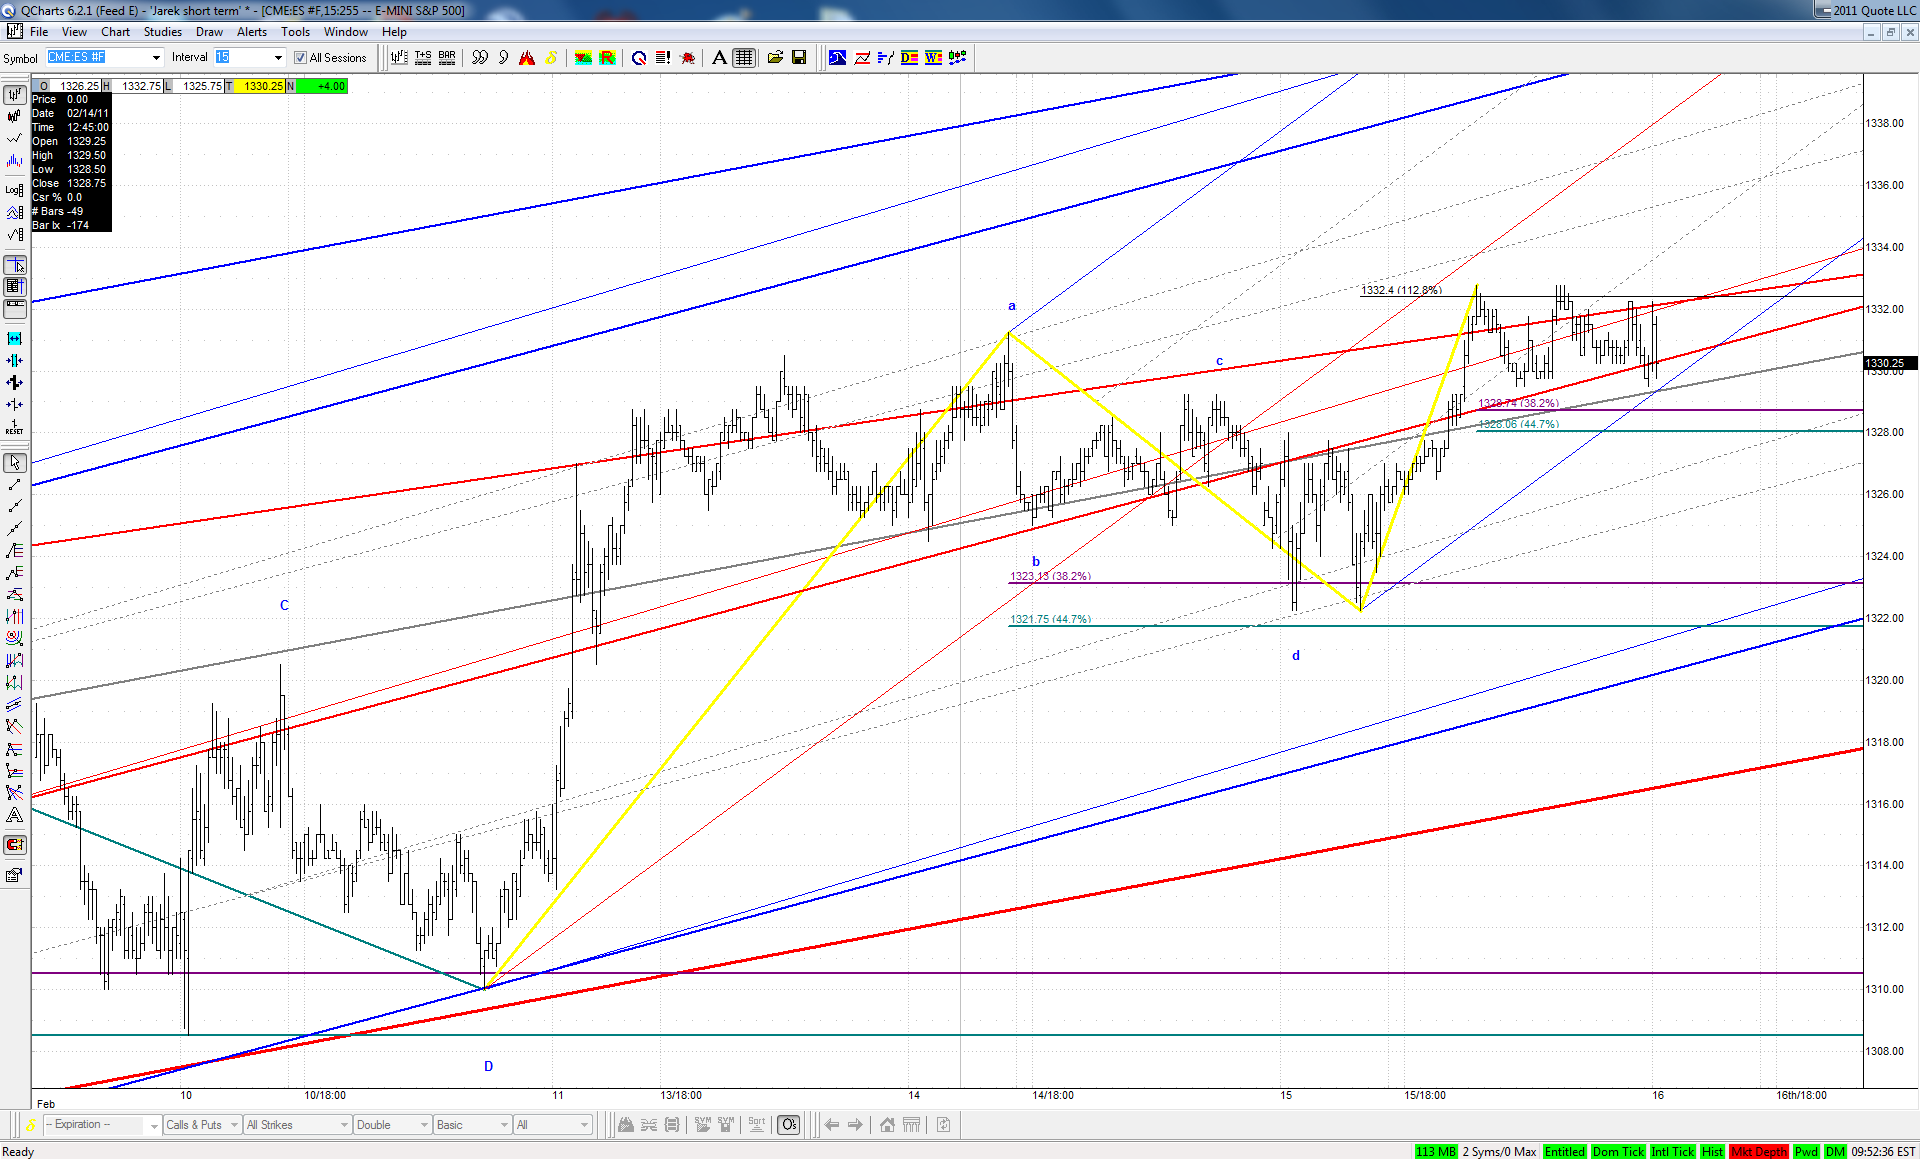
It's interesting to note that exactly same lines as yesterday work as a support also today:
Click image for original size
JA
jarek
Rep: 94
Posts: 3,474
2
This lines intersection at 1345 looks really compelling:
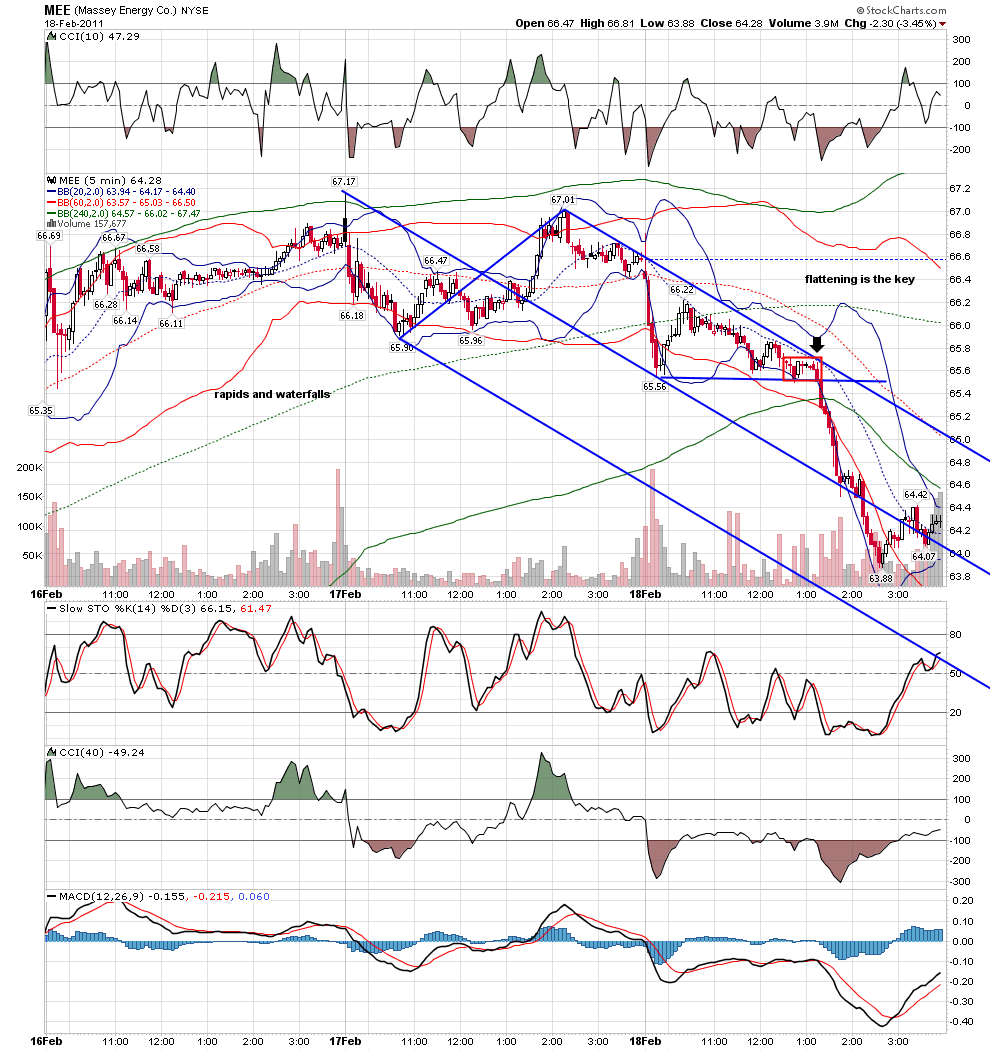
rat 89 will remember this one....it is a rare day when i will short into oversold.... but the pattern repeats over and over.....rapids and waterfall... the key is the flattening right before price goes..under the cover of opex, the computers were using the patterns to get price to the correct strike.... something else.... i feel a wave four triangle of some degree just ahead... the down in many stocks can be seen as the ab leg of abcd's that i think the c will setup just as the triangle leg is set to go....