MyPivots
Sign In
JA
jarek
Rep: 94
Posts: 3,474
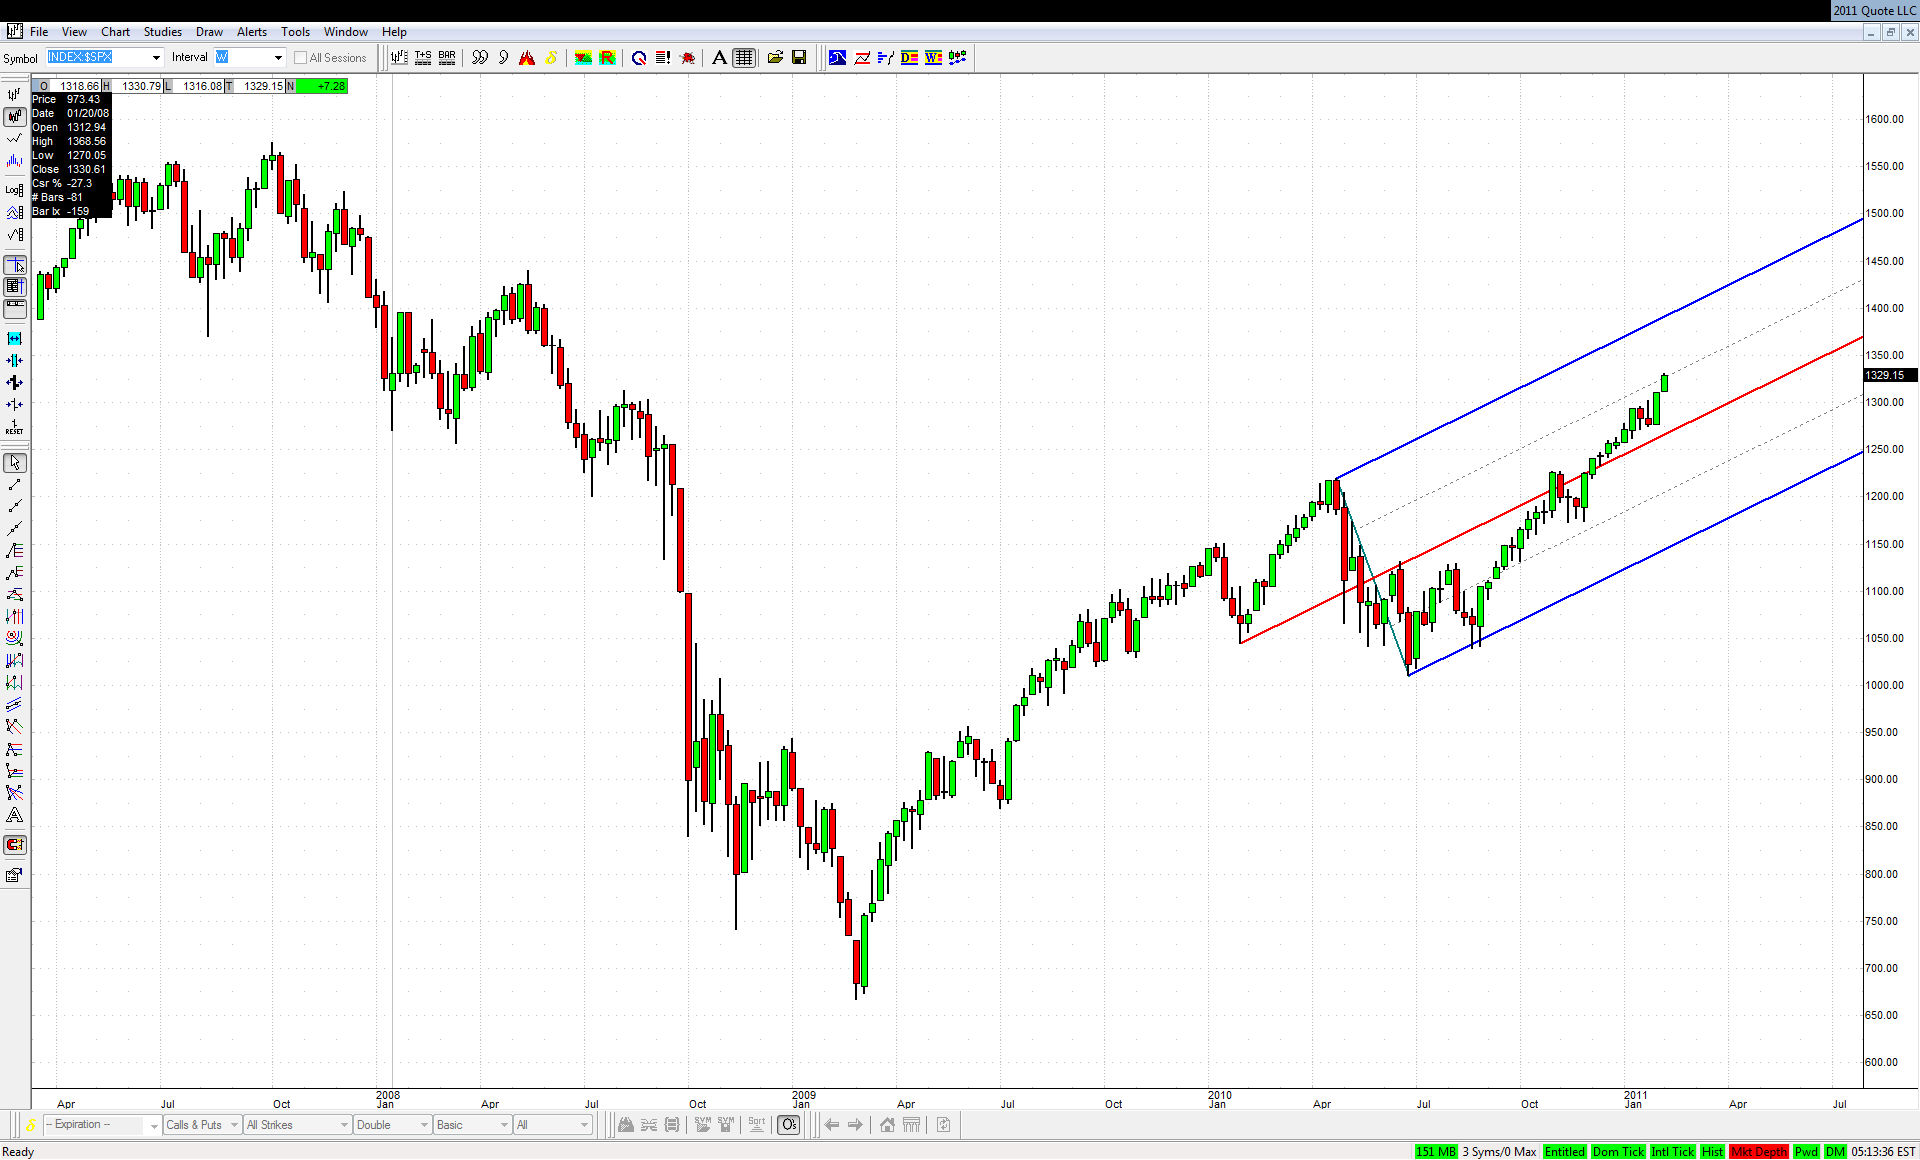
Is the move up that began on Friday a final acceleration to the 1330 area mentioned here couple of times? Or is it a start of something even bigger to the upside to finally convince everybody that this thing is never ever going to drop again? We'll have to wait to know the answer to this question. My personal opinion is closer to the second alternative, but of course I might be wrong. Some people say that the drop from May 2008 to the final 2009 bottom was an extended 5th wave. Such waves are usually fully retraced, and in such case the upper ML of the recent set needs to be met:


Click image for original size
JA
jarek
Rep: 94
Posts: 3,474
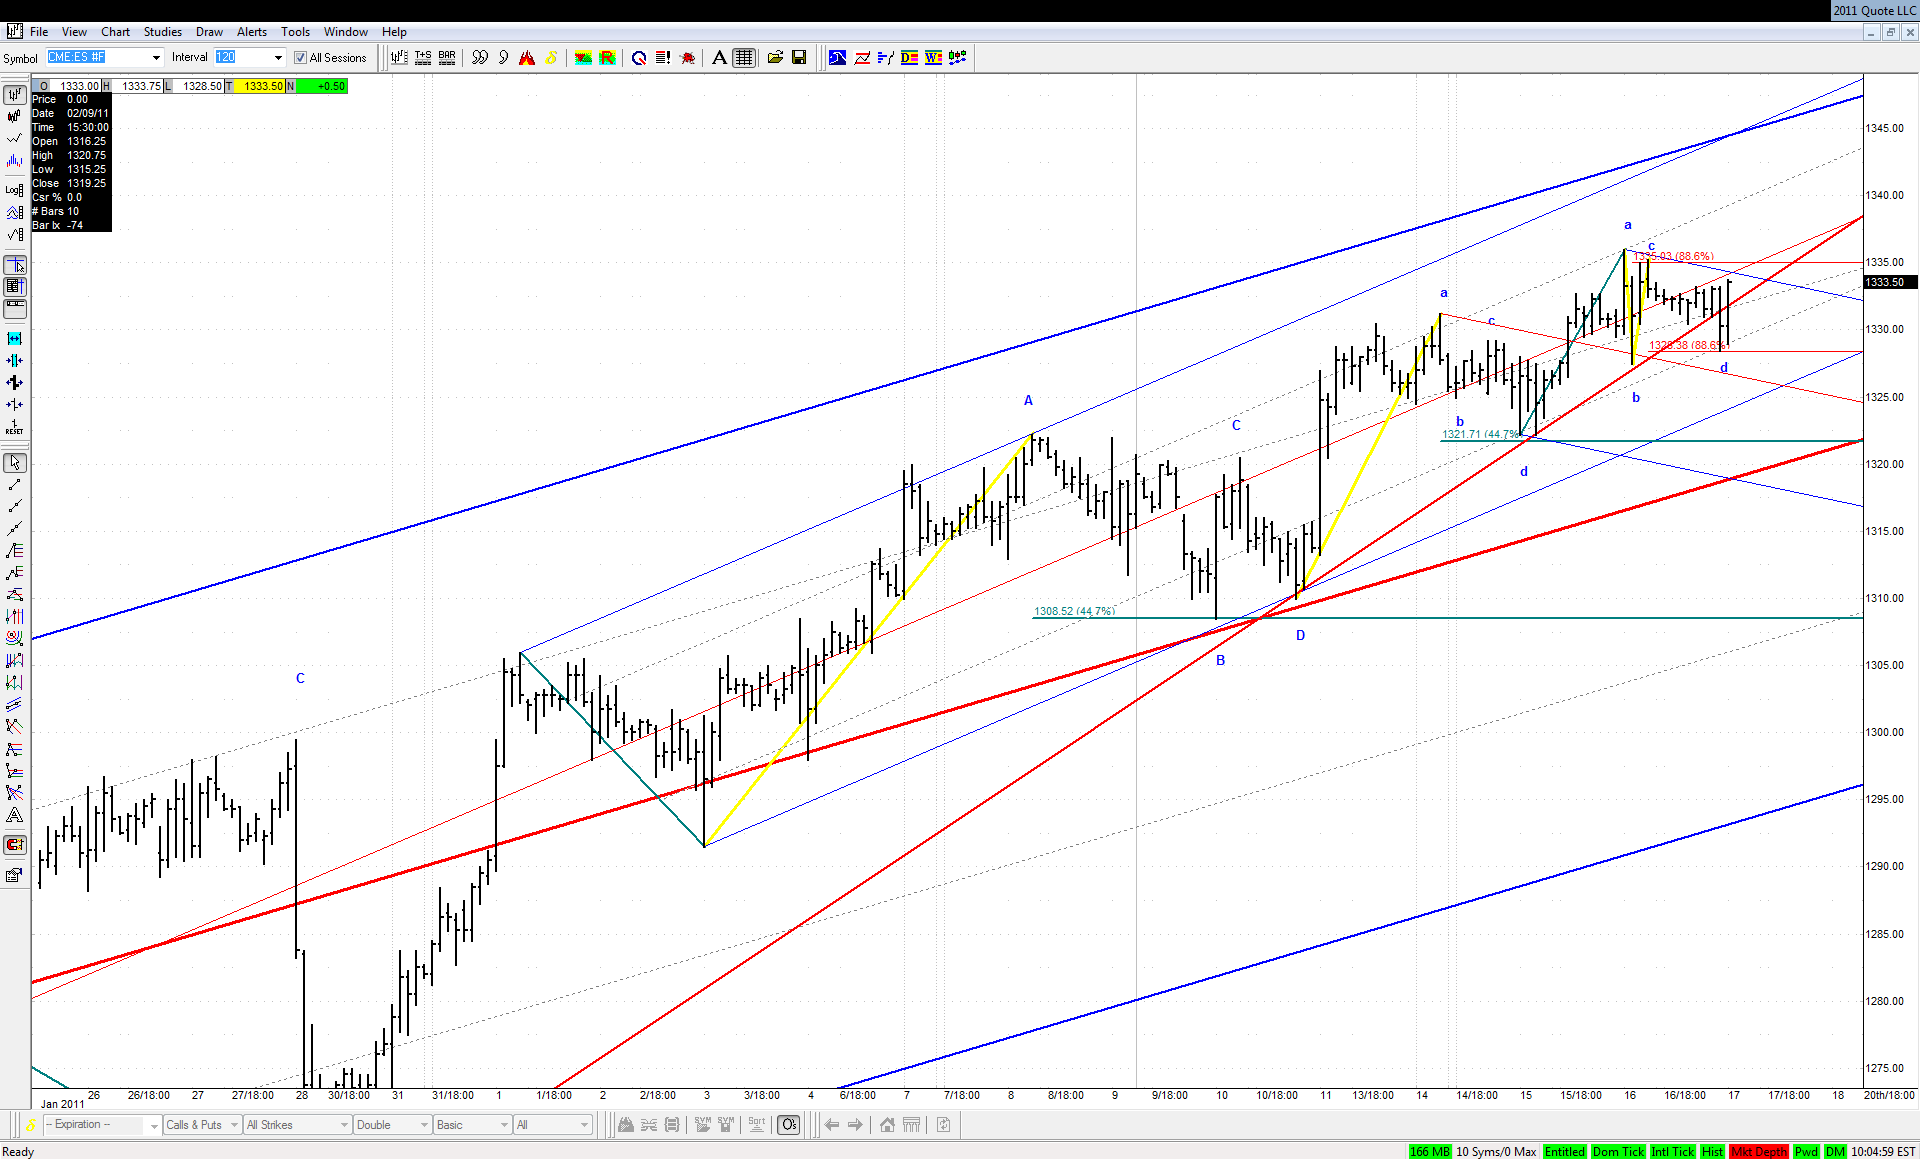
At this point it looks to me like a double .886 bullish 4PT with a bear trap at this fake breakout:


Click image for original size
JA
jarek
Rep: 94
Posts: 3,474
I would rather expect a sustained move in the other direction in Bonds:


Click image for original size

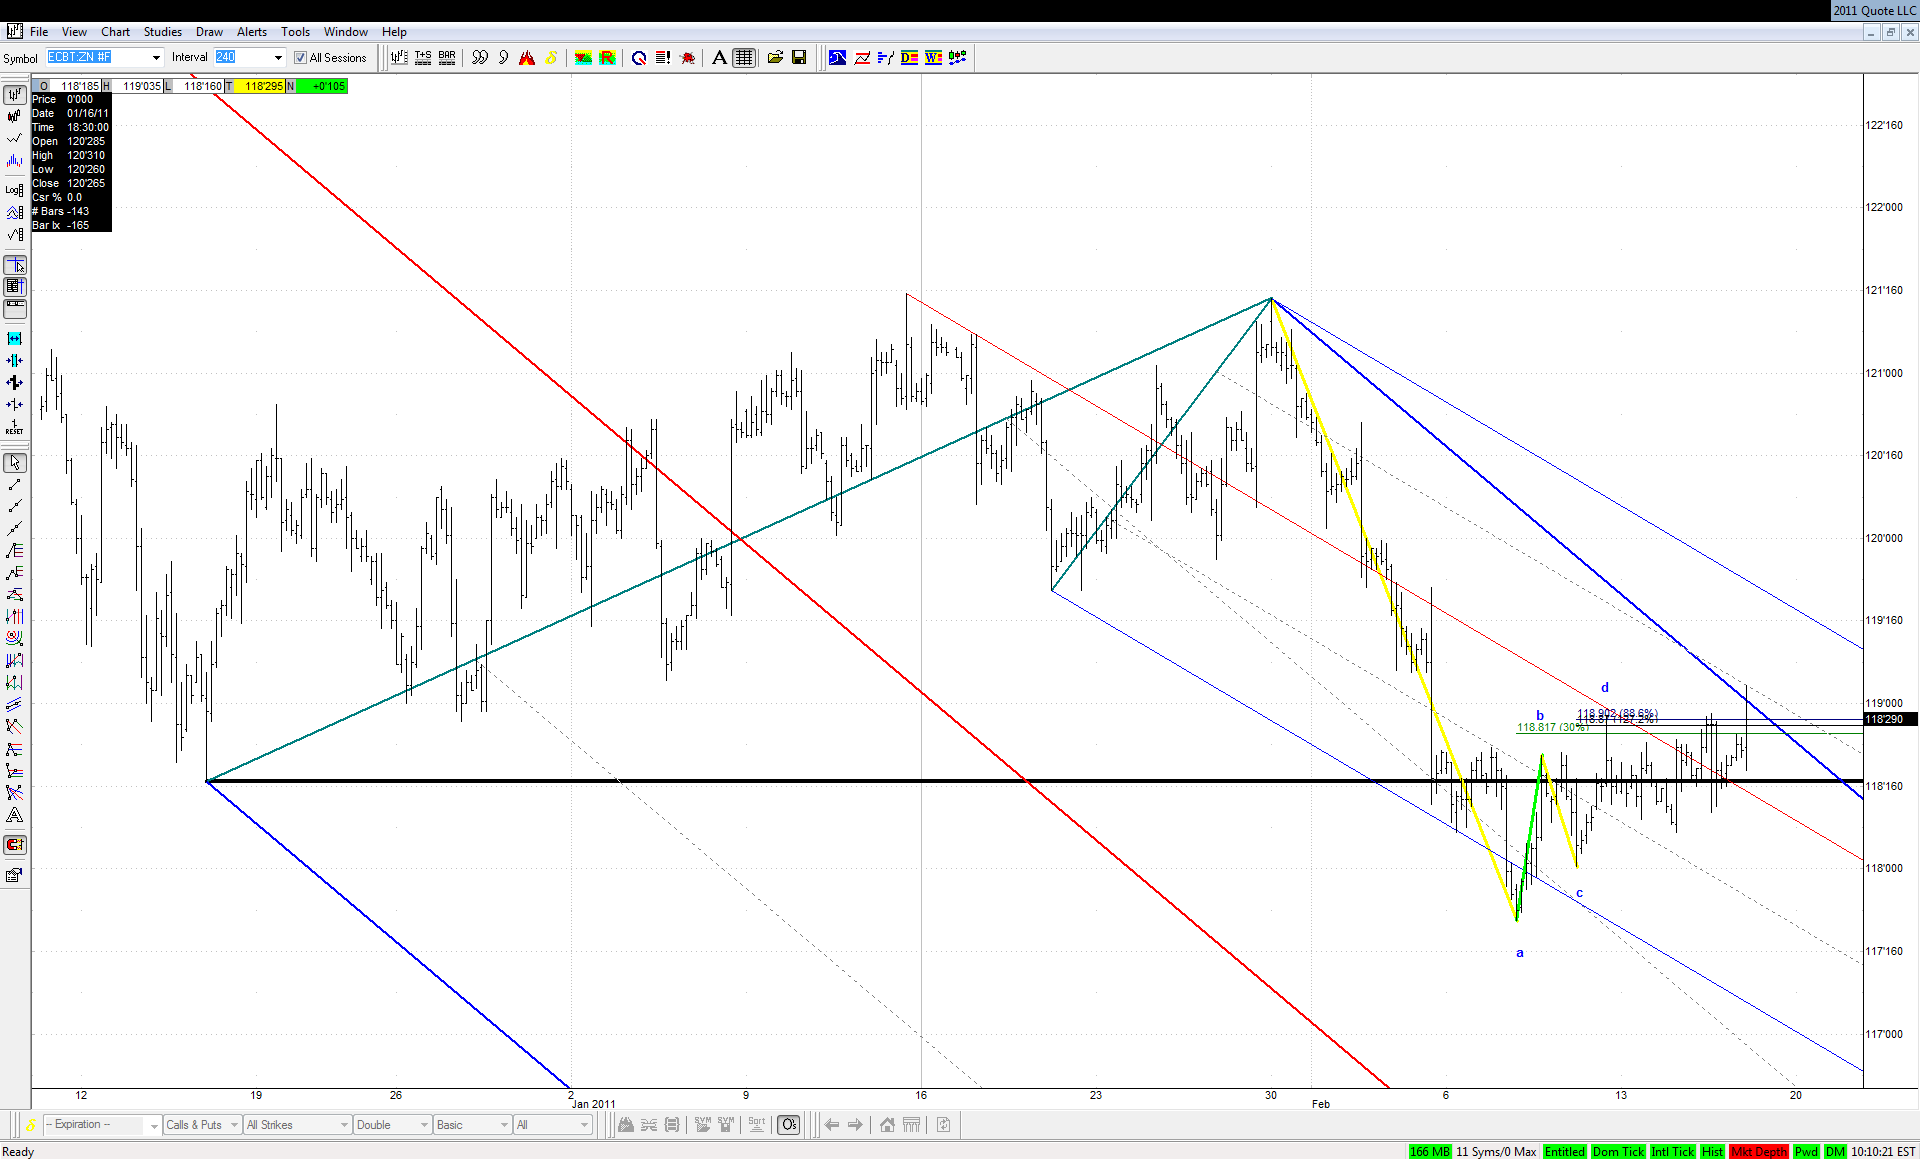
Is this a fake one as it happened with the triangle before, or is Fed back in full control over rates?
JA
jarek
Rep: 94
Posts: 3,474
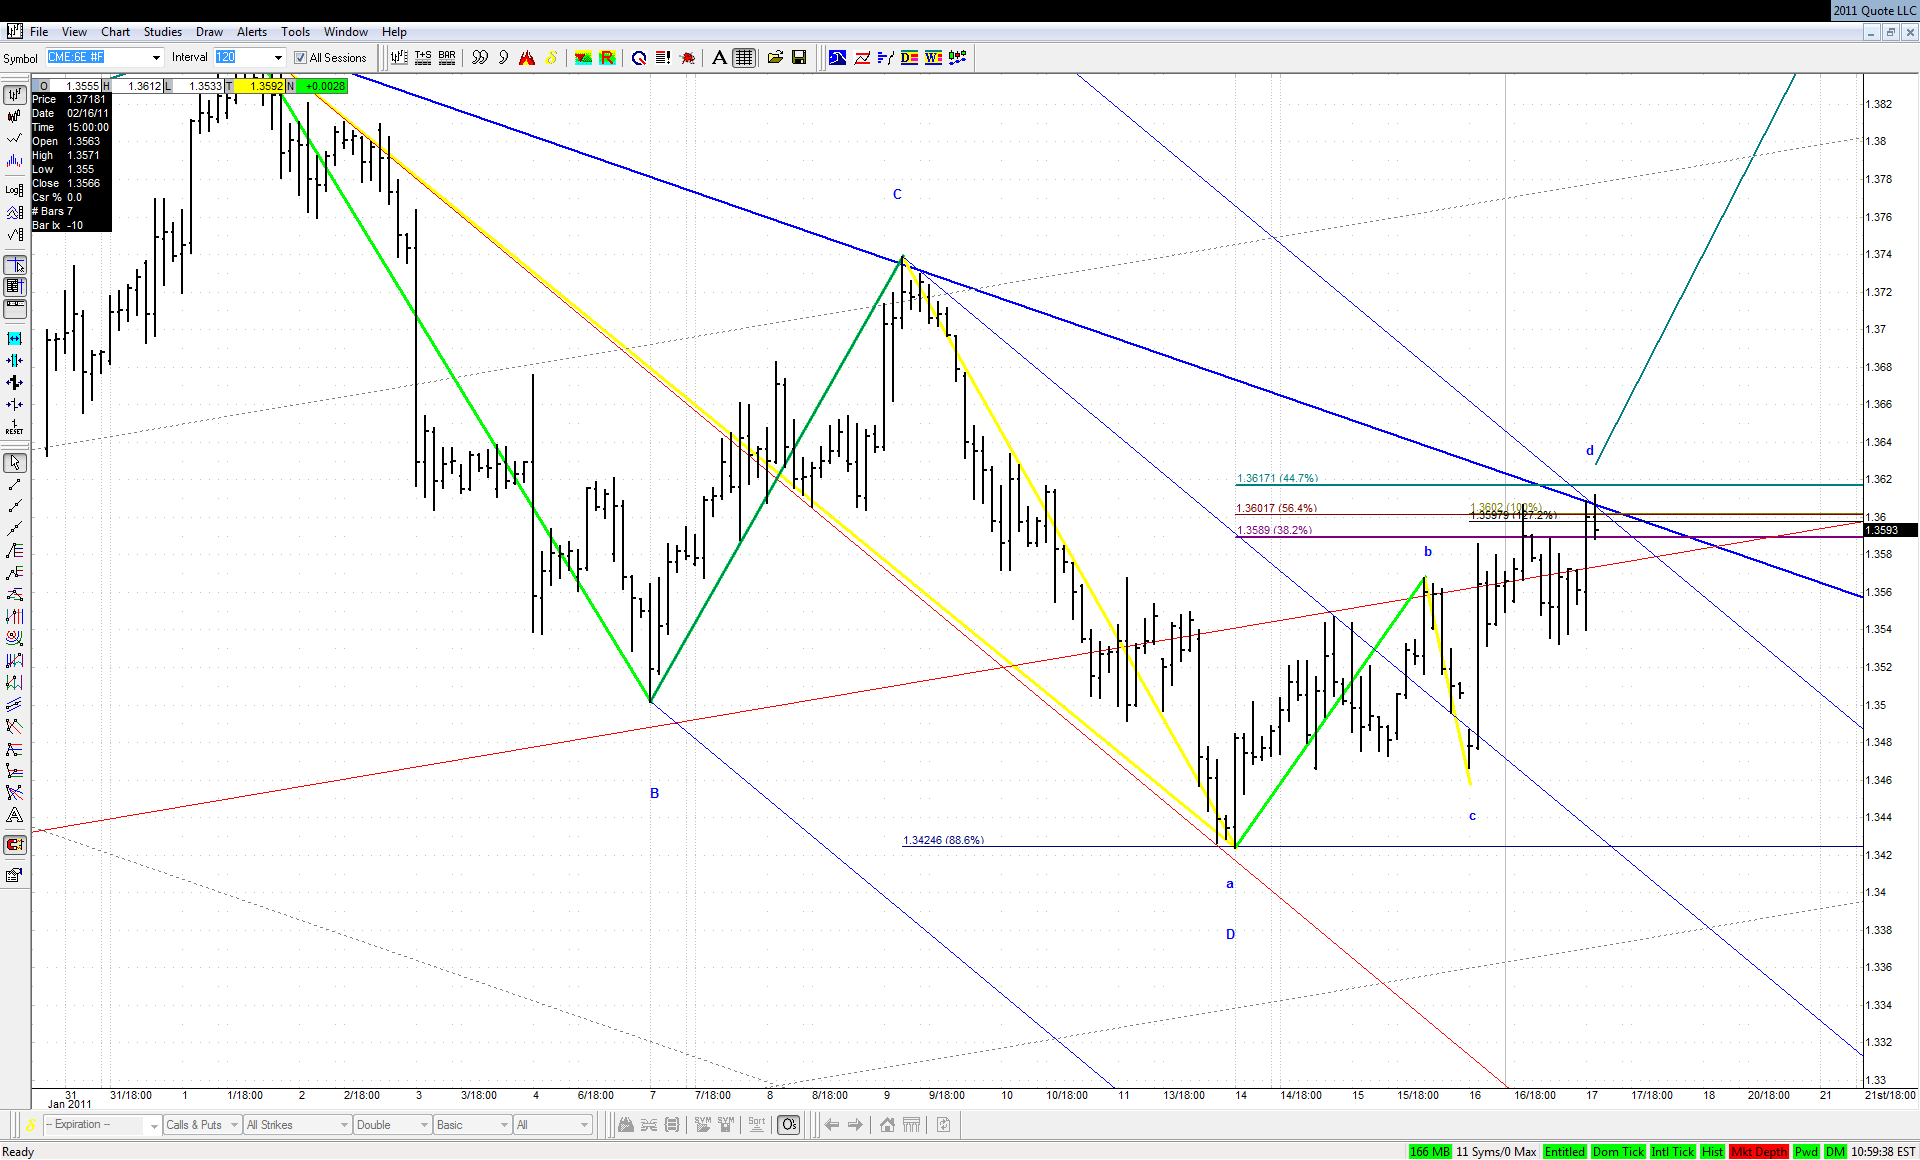
The small test and retest in Euro didn't play out, but notice how ideally it just hit the longer term geometry:


Click image for original size
JA
jarek
Rep: 94
Posts: 3,474
Originally posted by jarek

I like when it comes back to test the lines one more time after a return from a fake breakout...
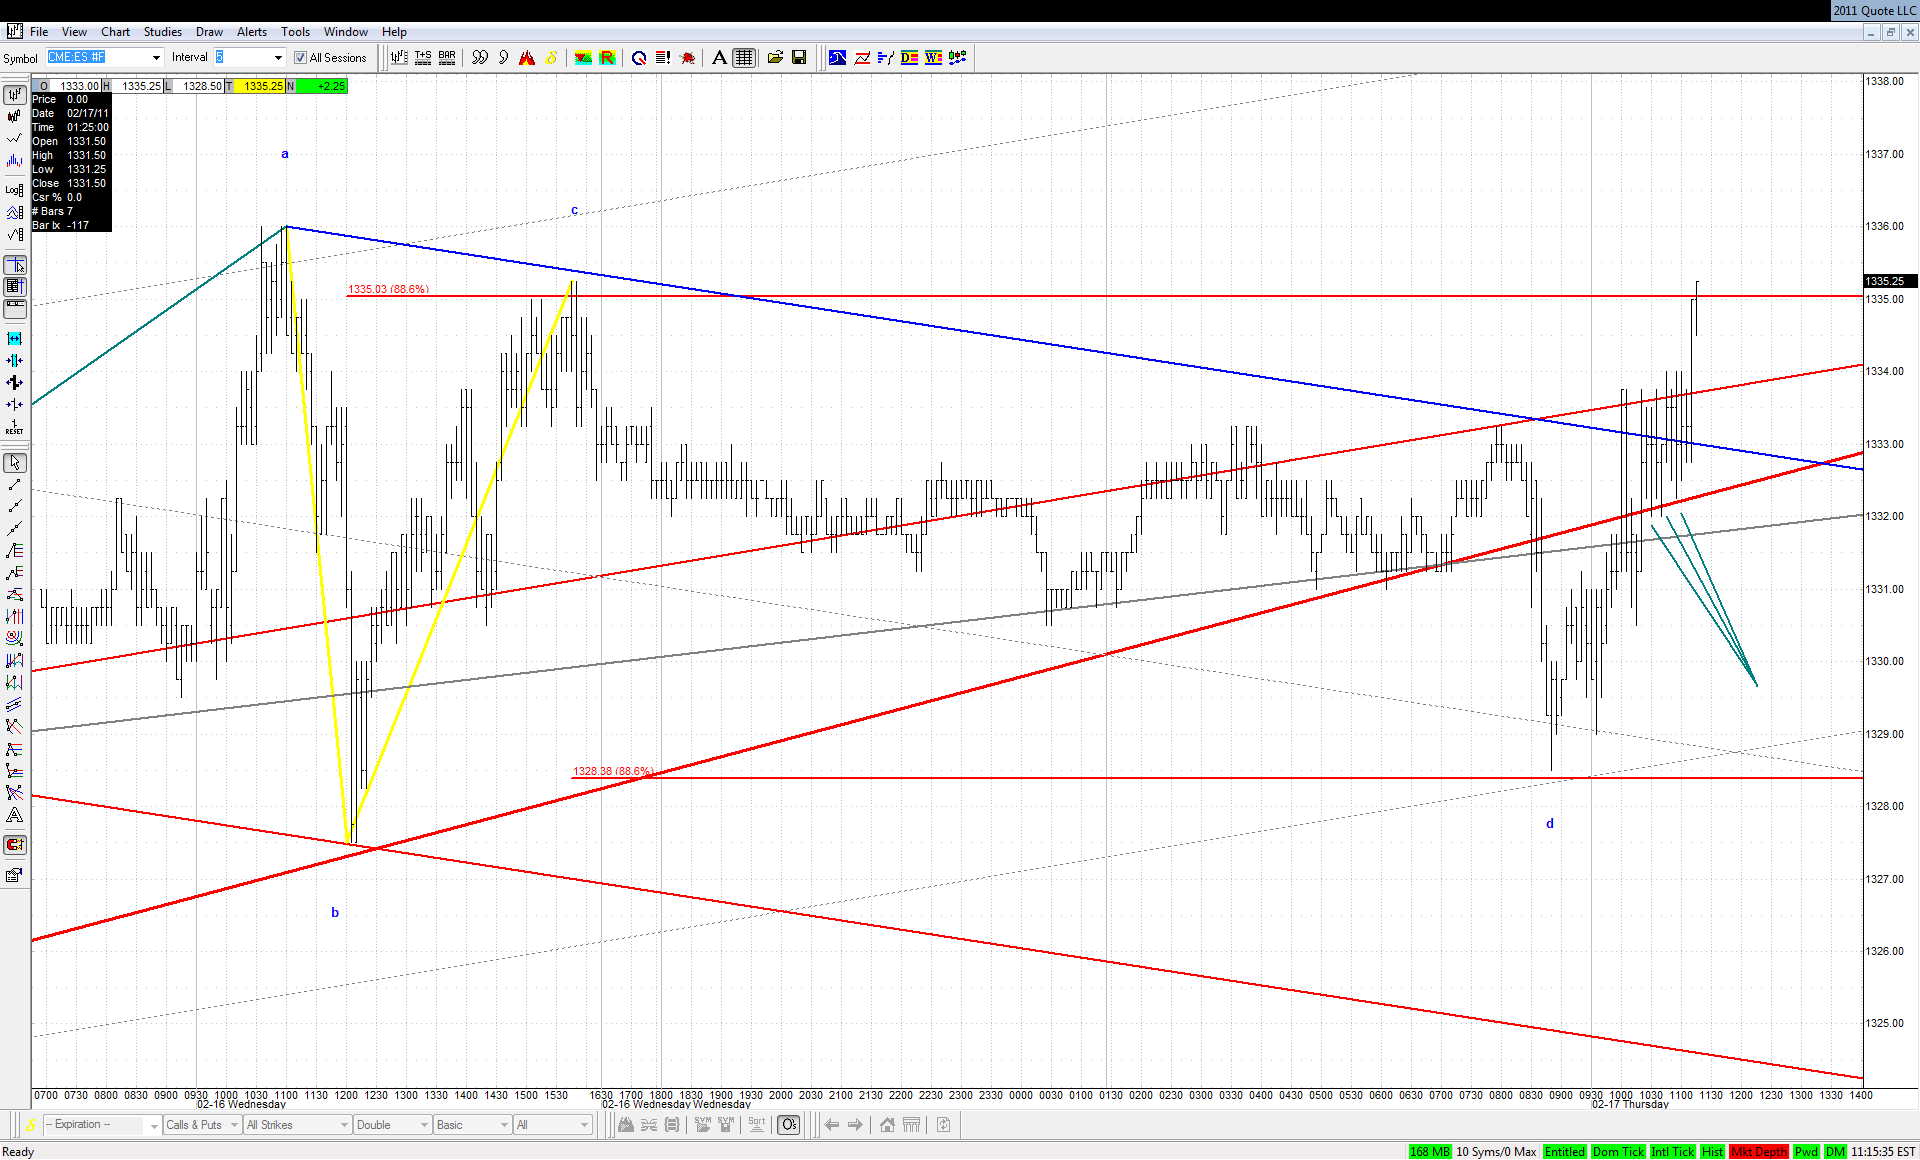

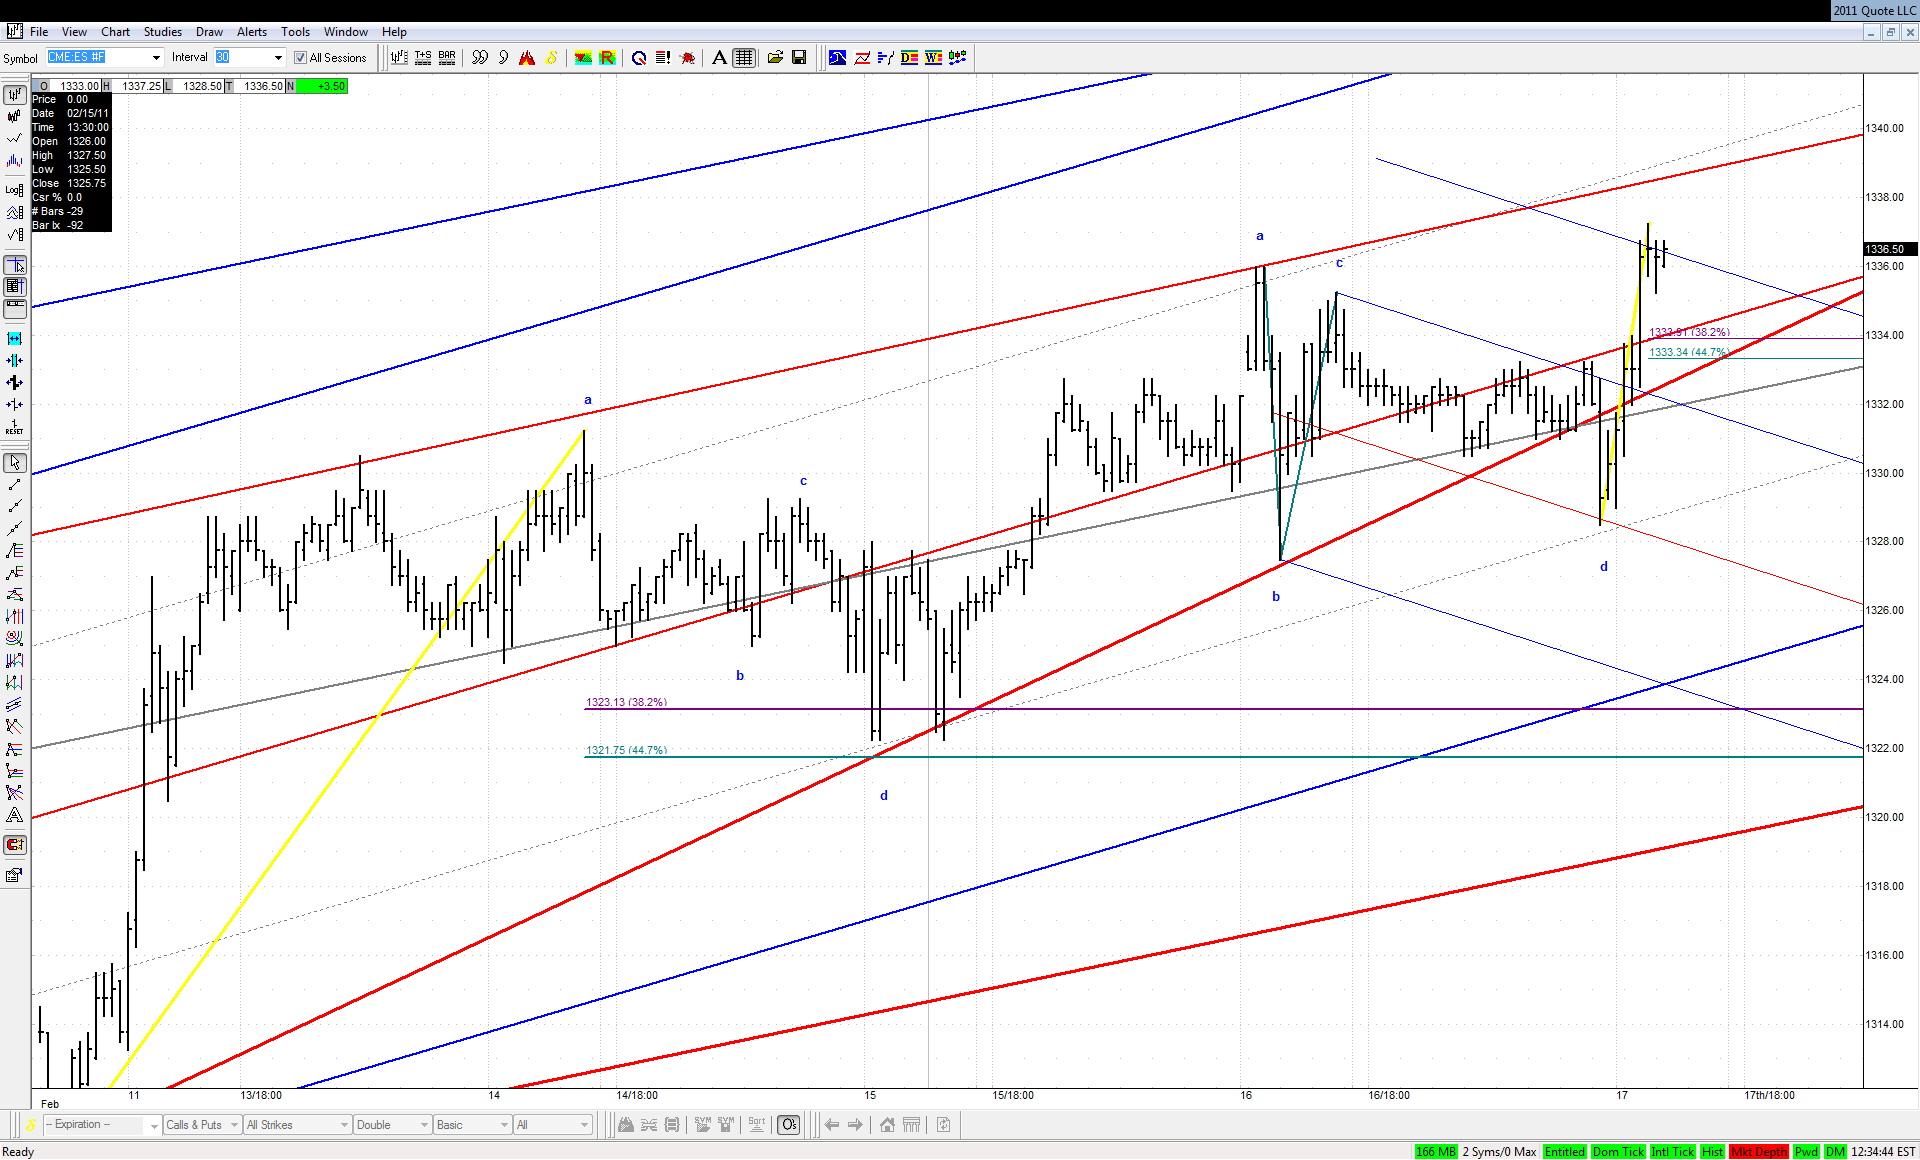
Click image for original size
JA
jarek
Rep: 94
Posts: 3,474
And here comes the new ....


Click image for original size


This upward pressure is simply enormous
JA
jarek
Rep: 94
Posts: 3,474
It found some resistance at this sliding parallel, but doesn't want to correct any deeper so far:


Click image for original size


Just in case the Kane Zone at lines is waiting
JA
jarek
Rep: 94
Posts: 3,474
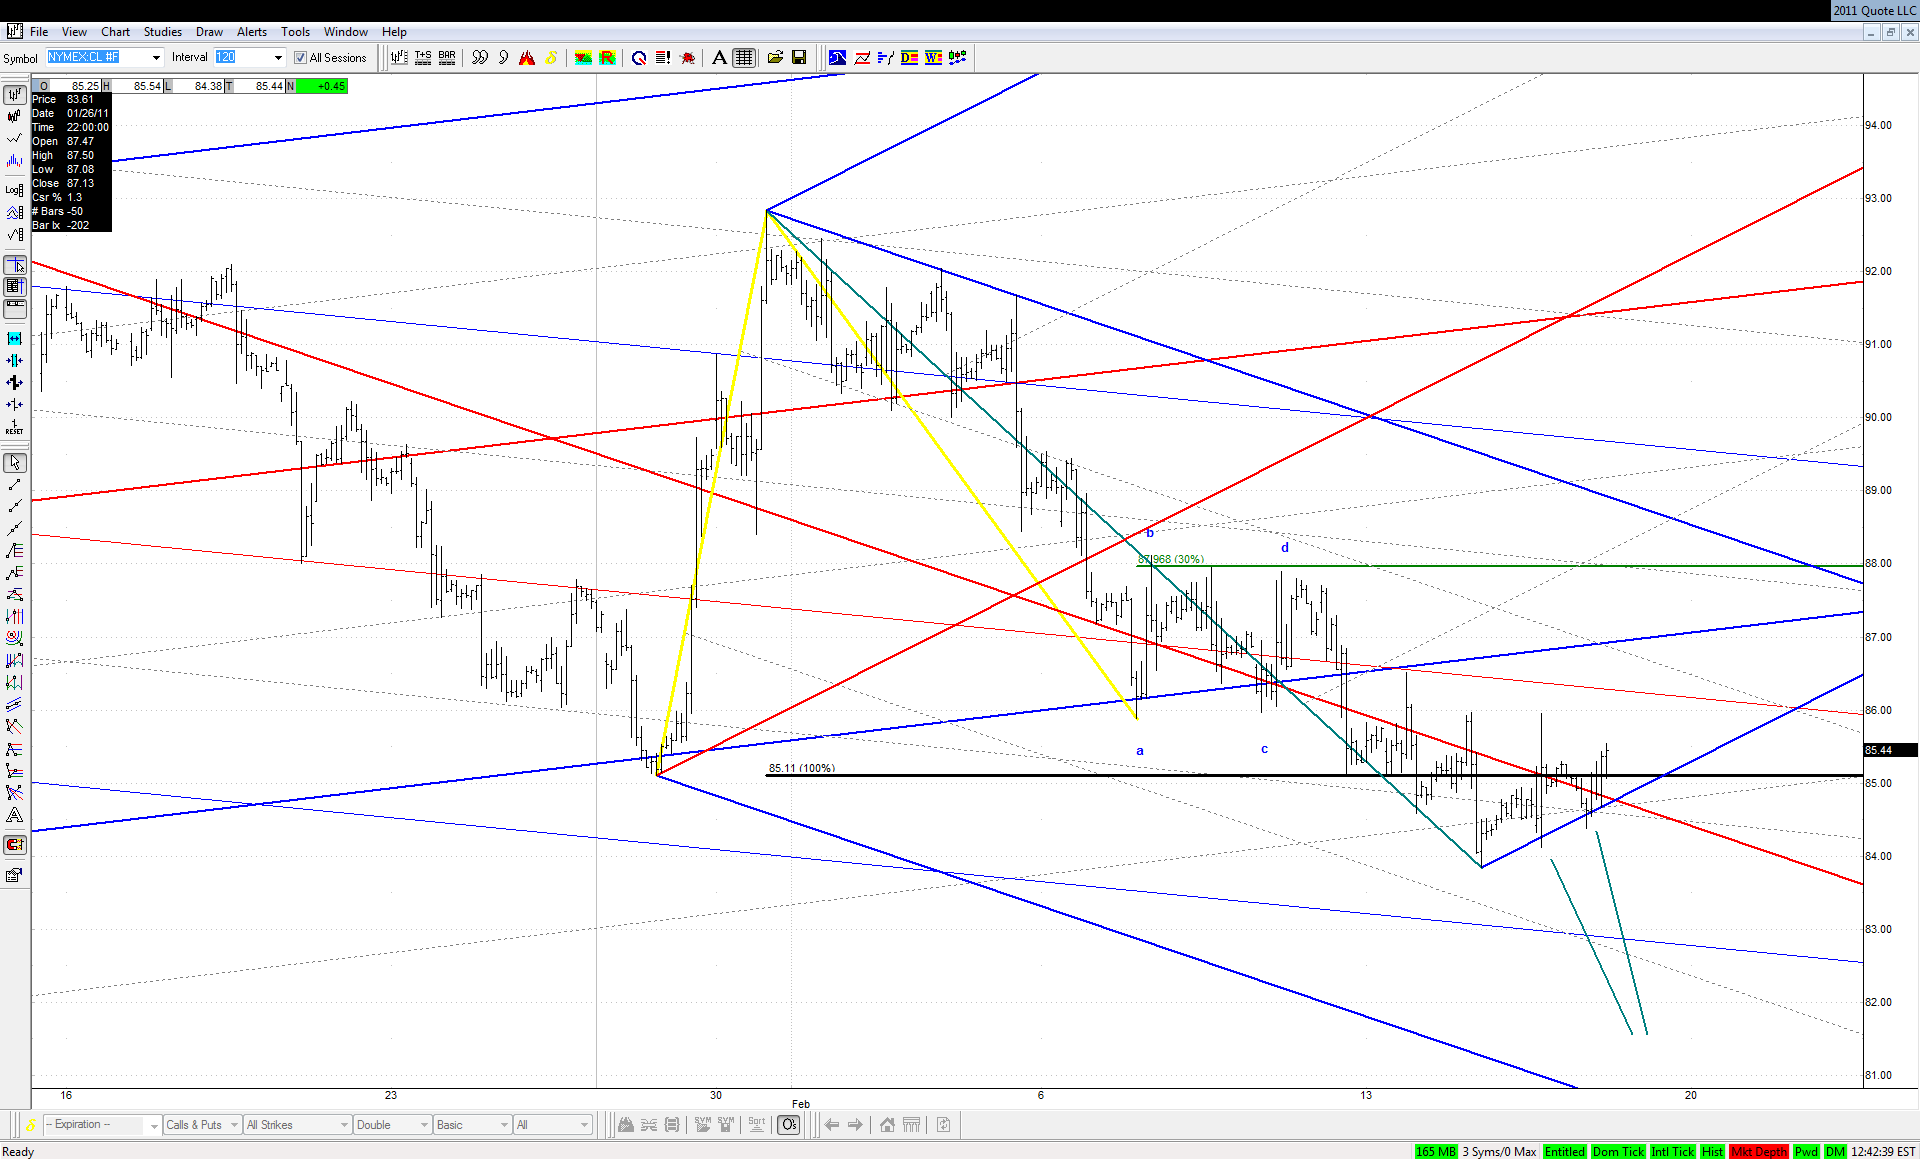
There may have been a reason that this move to new lows in Crude didn't look impulsive at all:

Click image for original size


And if this was a test and retest of the lower ML, then beware bears!
JA
jarek
Rep: 94
Posts: 3,474
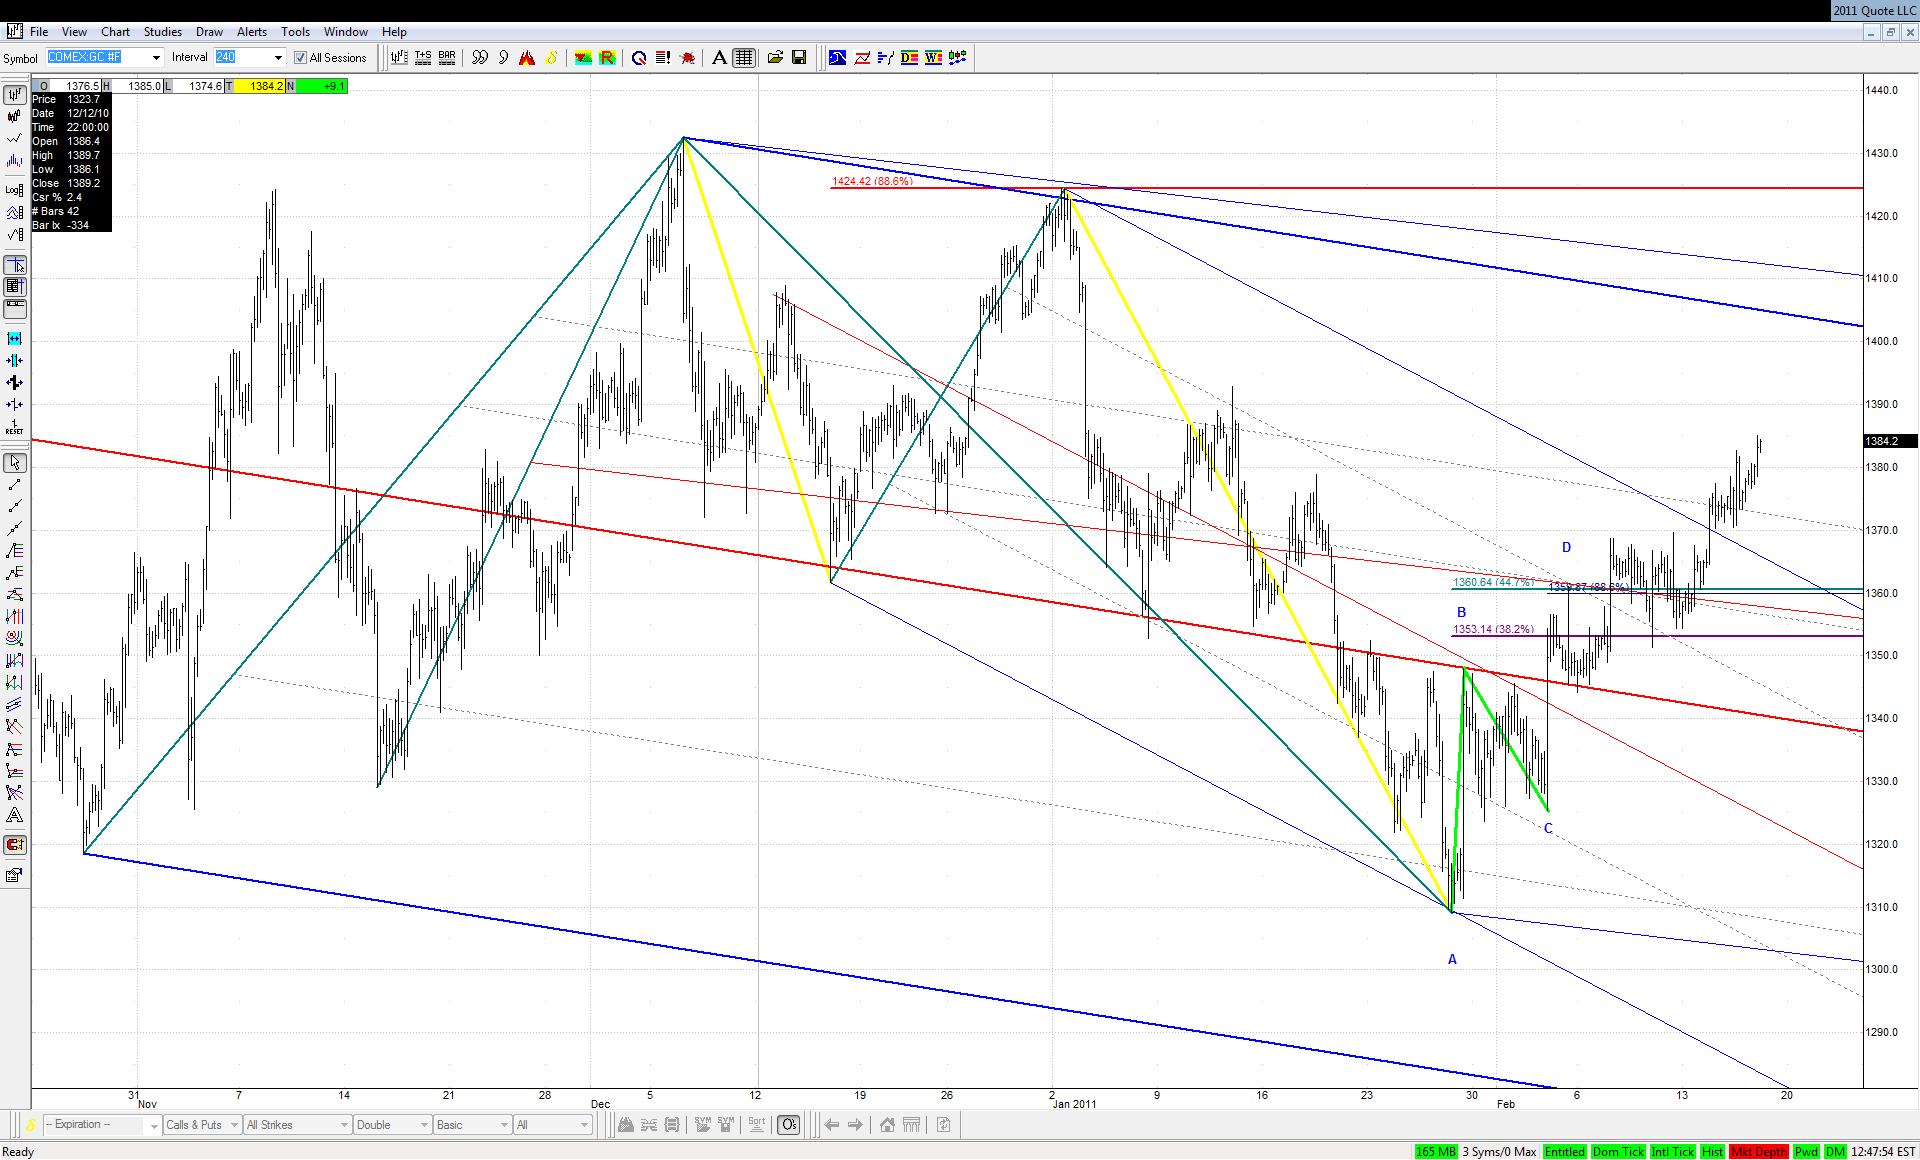
And their counterparts in Gold are still paying the price for giving up at this bearish KZ ABCD at lines:

Click image for original size
JA
jarek
Rep: 94
Posts: 3,474
Originally posted by jarek

... doesn't want to correct any deeper...
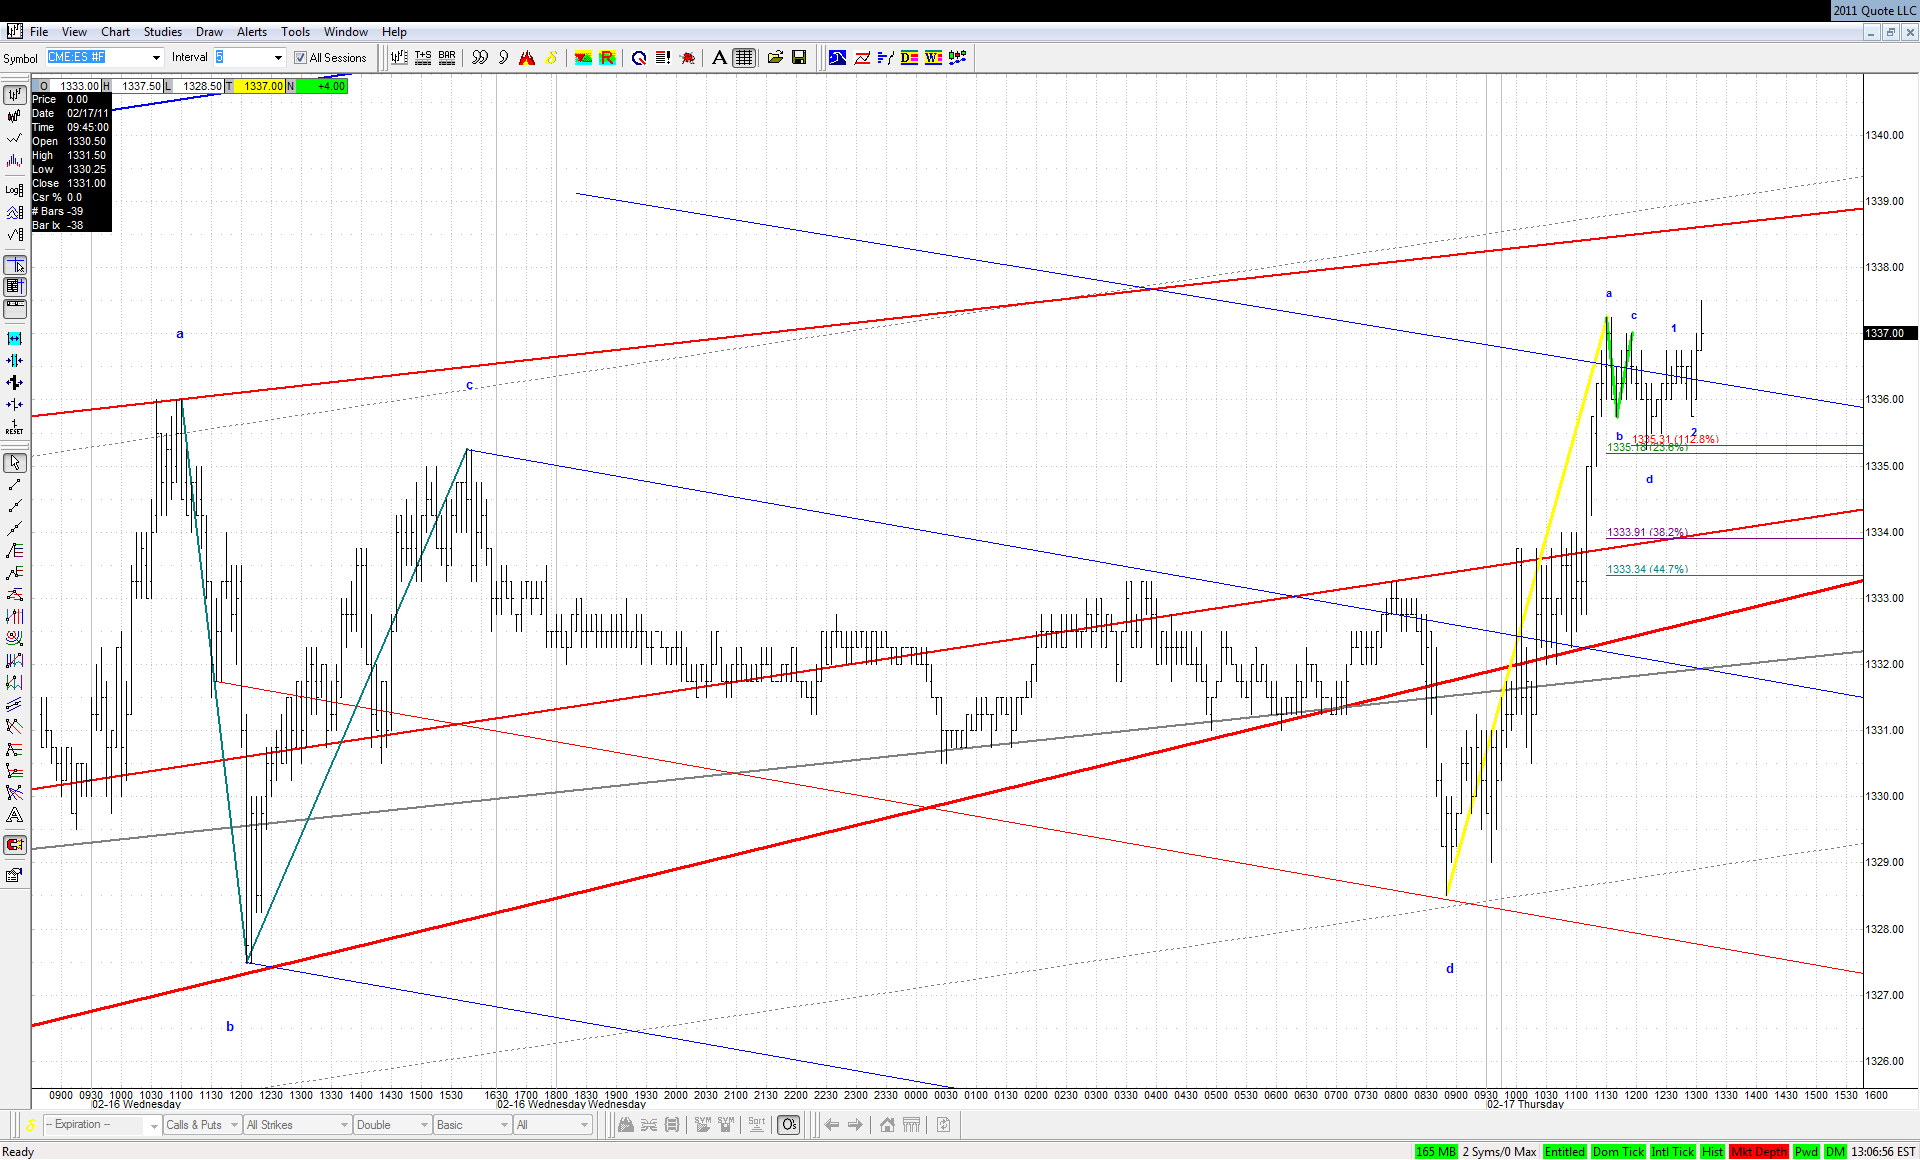

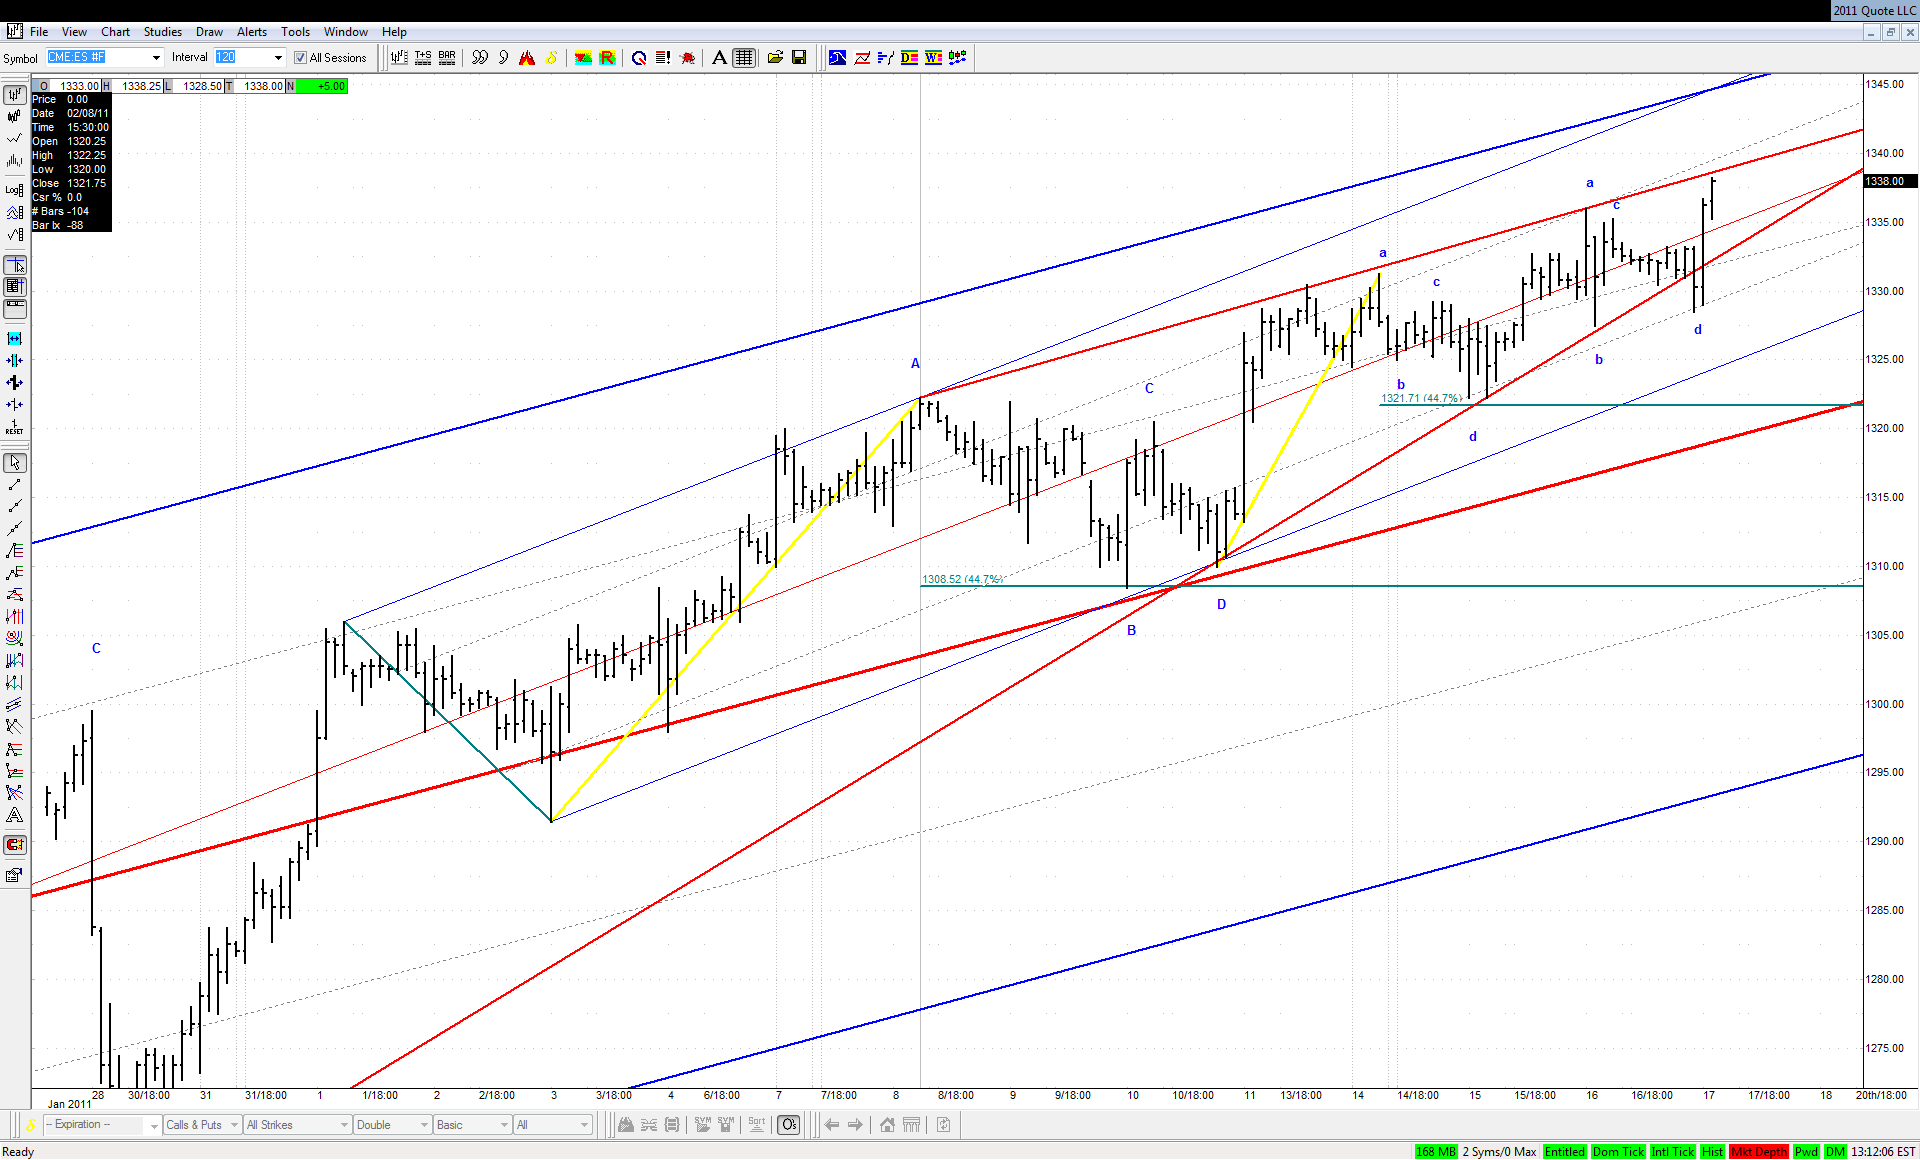
A tiny 2-points ABCD had to suffice before taking it to yet another new high:

Click image for original size


This must be really, really frustrating for all the bears...
JA
jarek
Rep: 94
Posts: 3,474
Originally posted by jarek

...This must be really, really frustrating for all the bears...

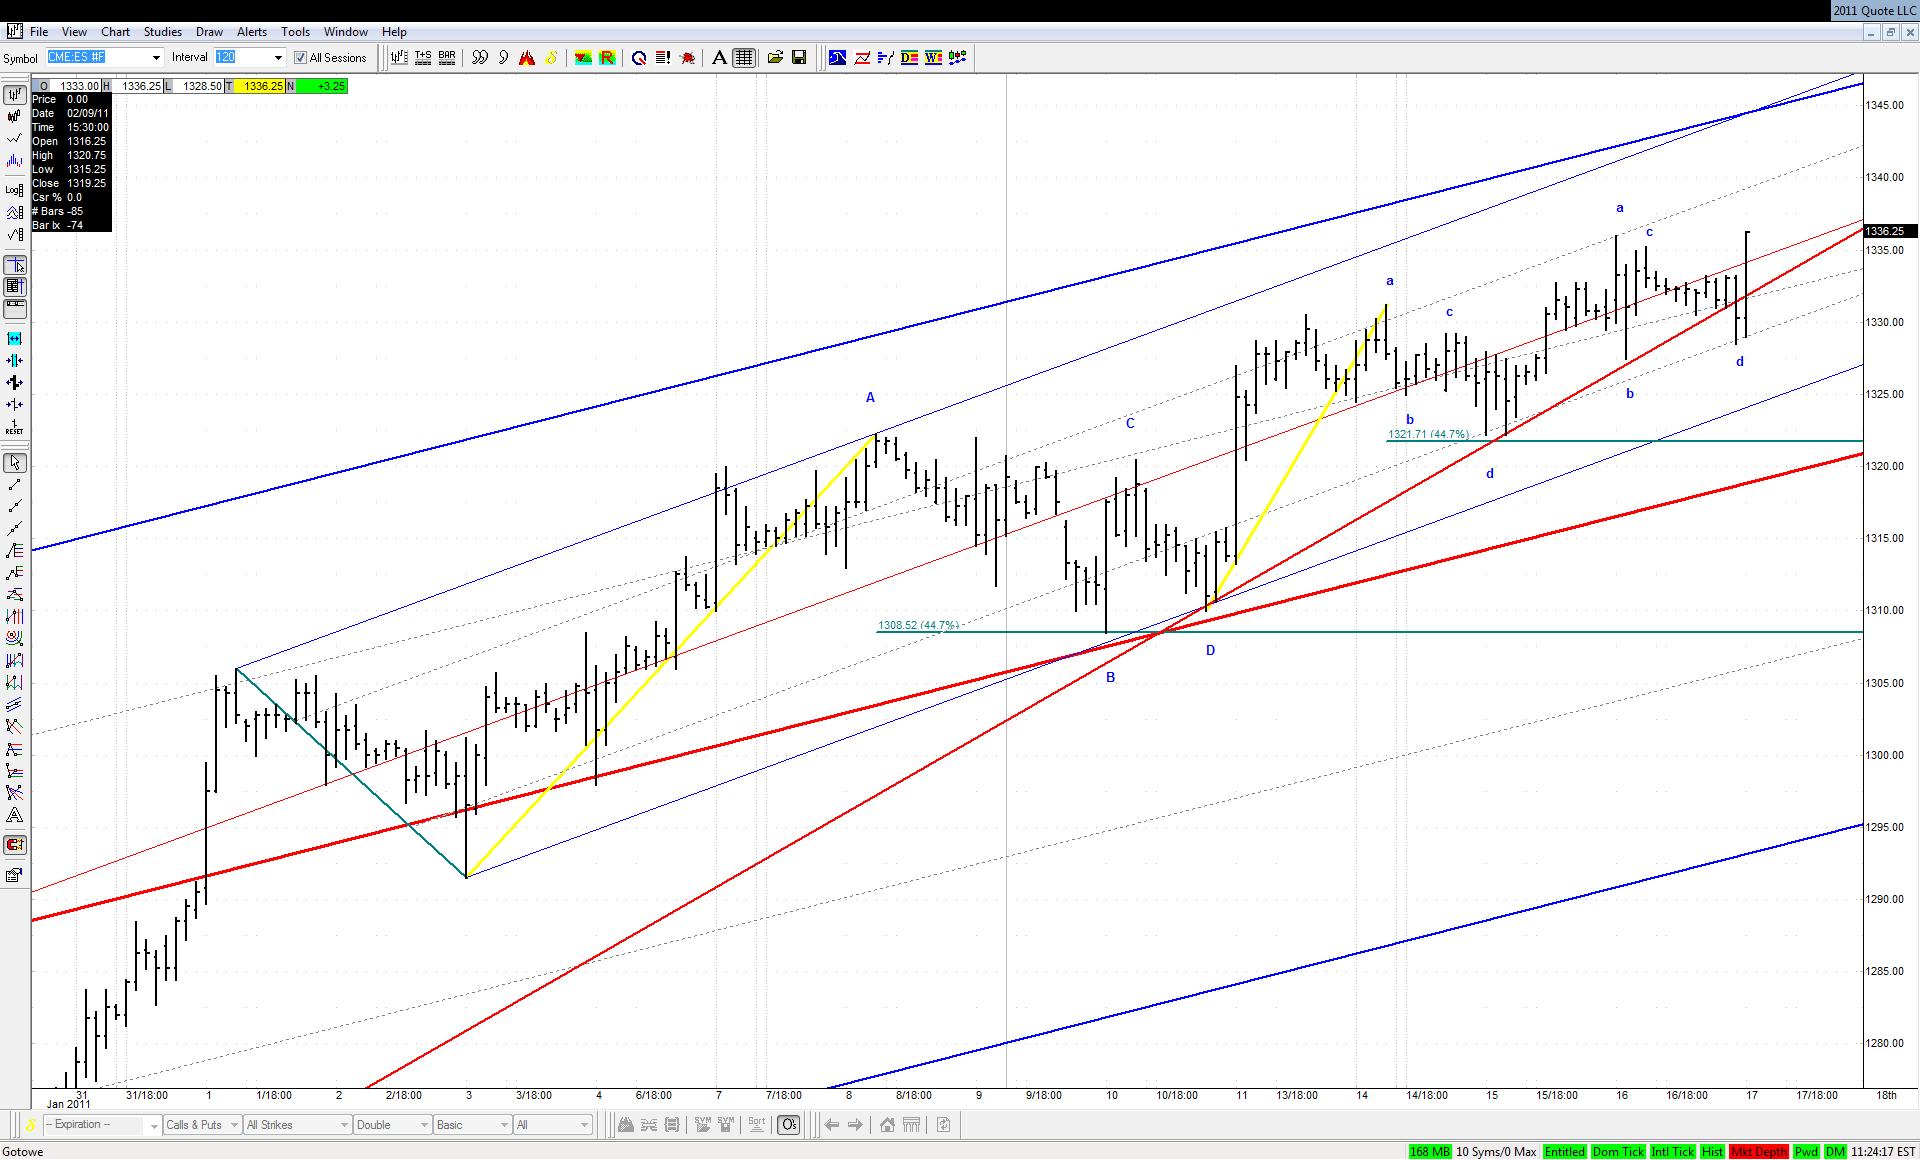
A resistance line is close so they may try their chances here again:

Click image for original size
RO
roofer
Rep: 3,689
Posts: 3,574
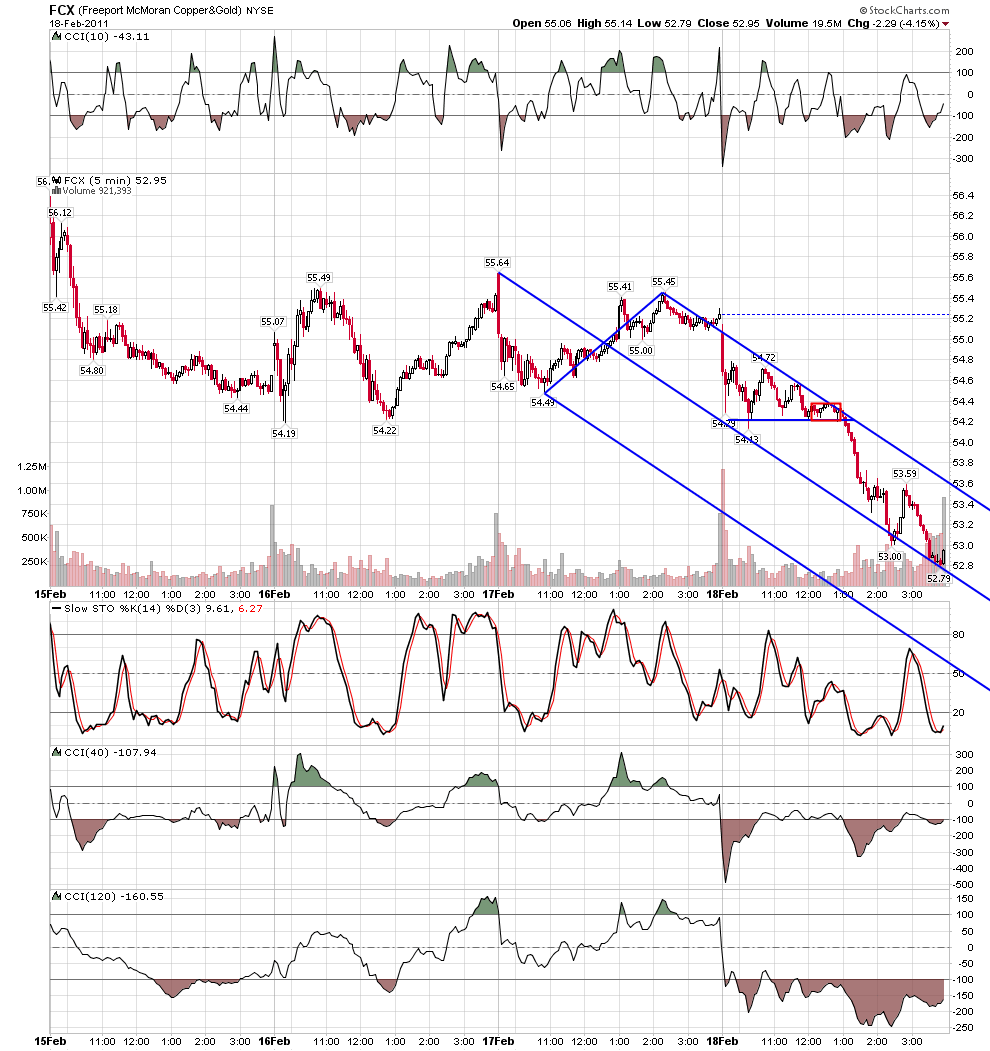
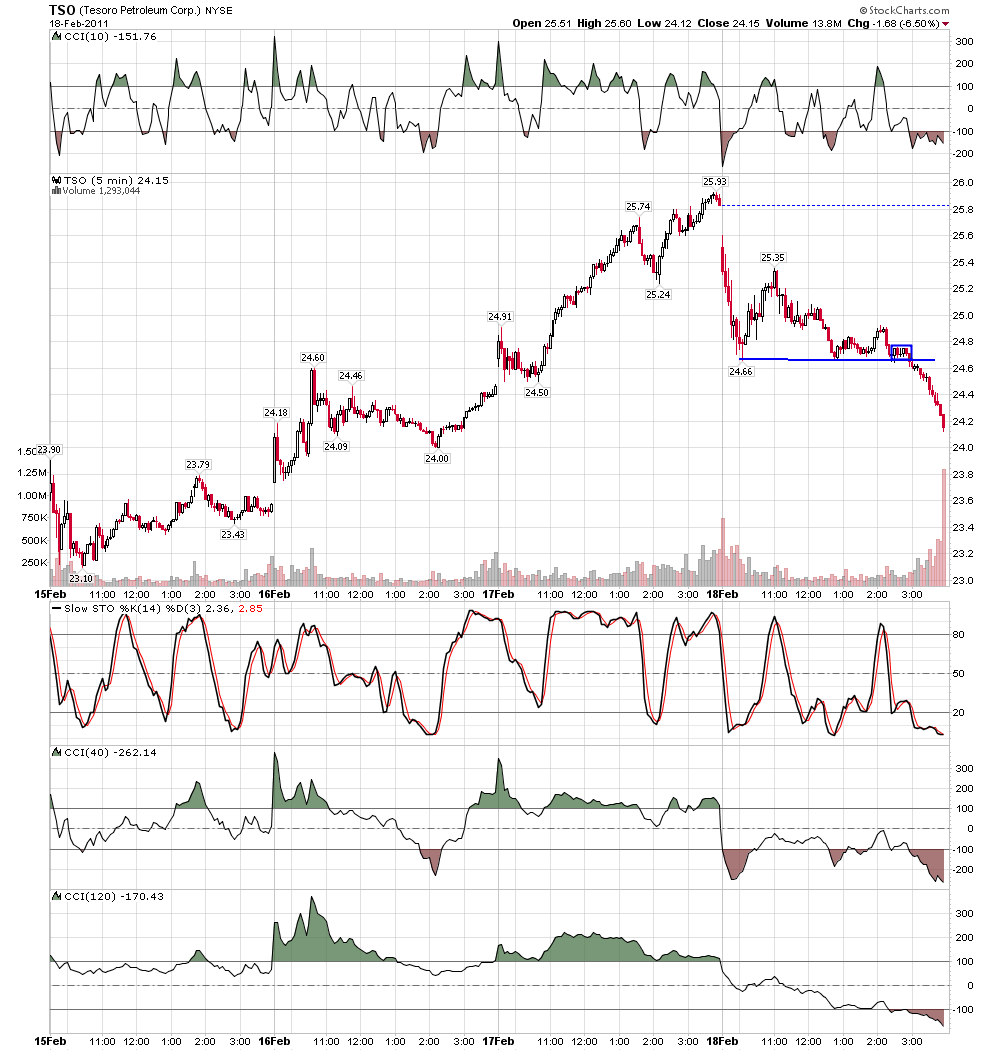
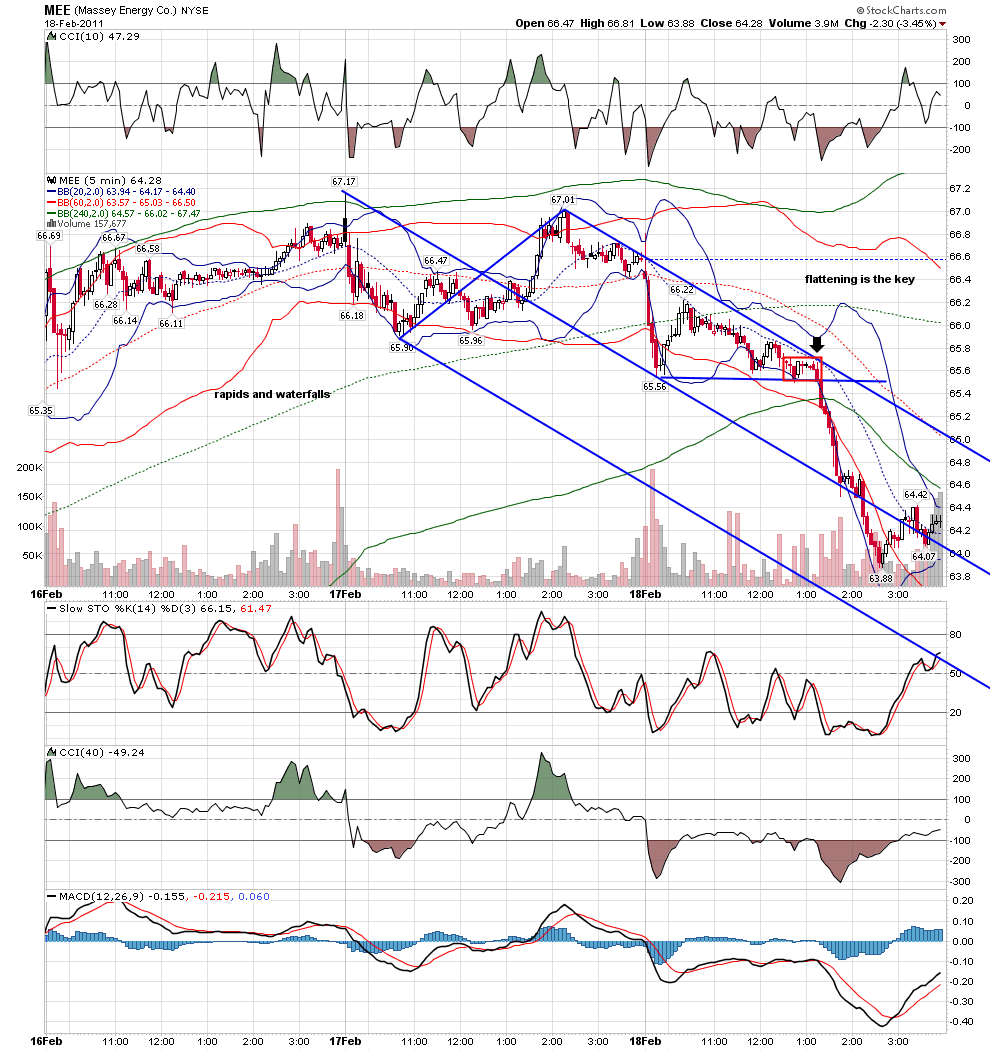
rat 89 will remember this one....it is a rare day when i will short into oversold.... but the pattern repeats over and over.....rapids and waterfall... the key is the flattening right before price goes..under the cover of opex, the computers were using the patterns to get price to the correct strike.... something else.... i feel a wave four triangle of some degree just ahead... the down in many stocks can be seen as the ab leg of abcd's that i think the c will setup just as the triangle leg is set to go....
Click image for original size

Click image for original size

Click image for original size