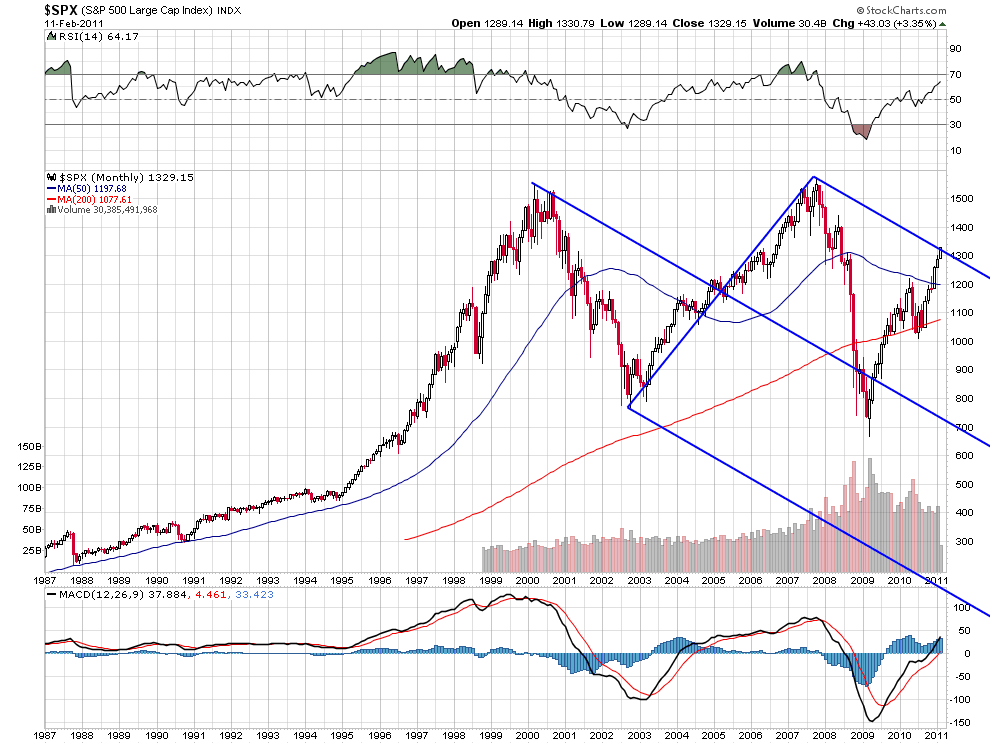
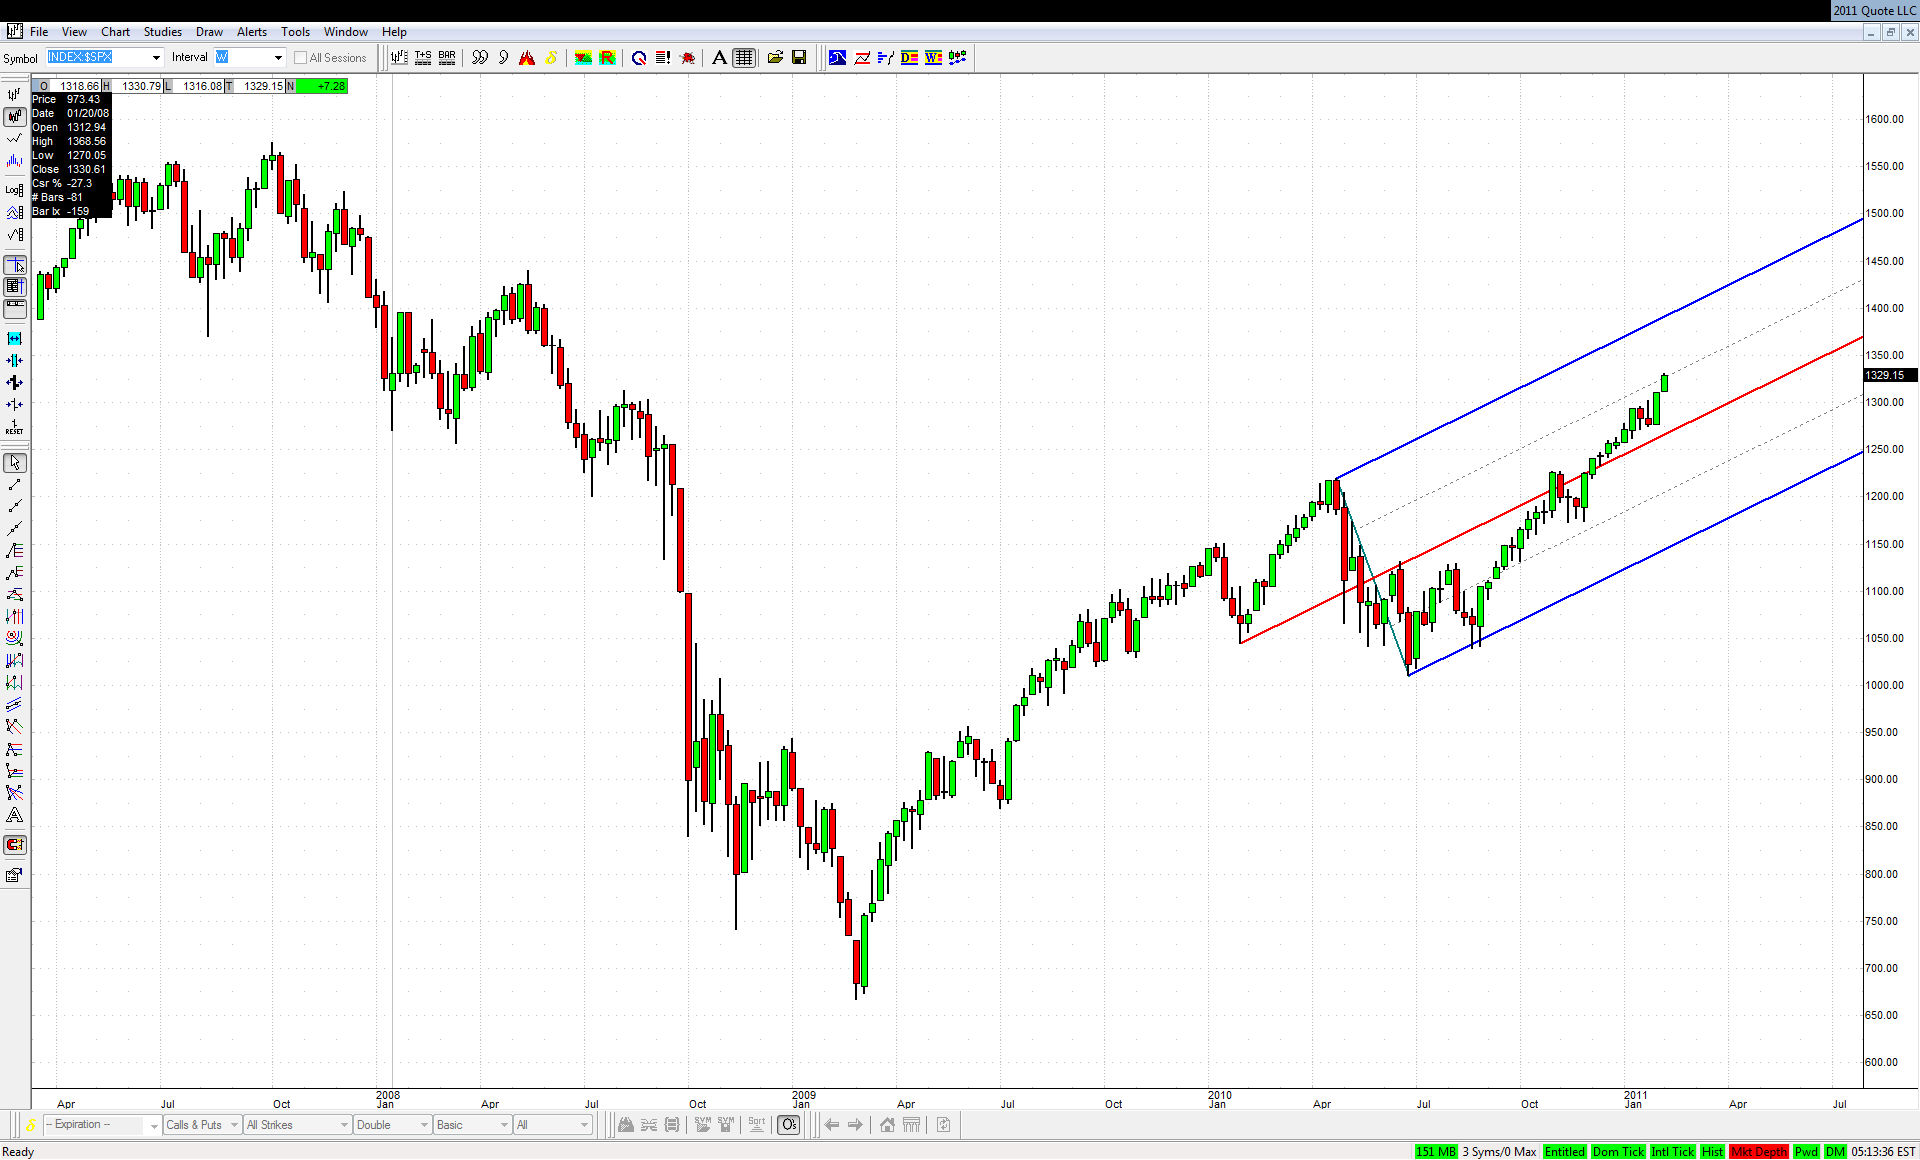
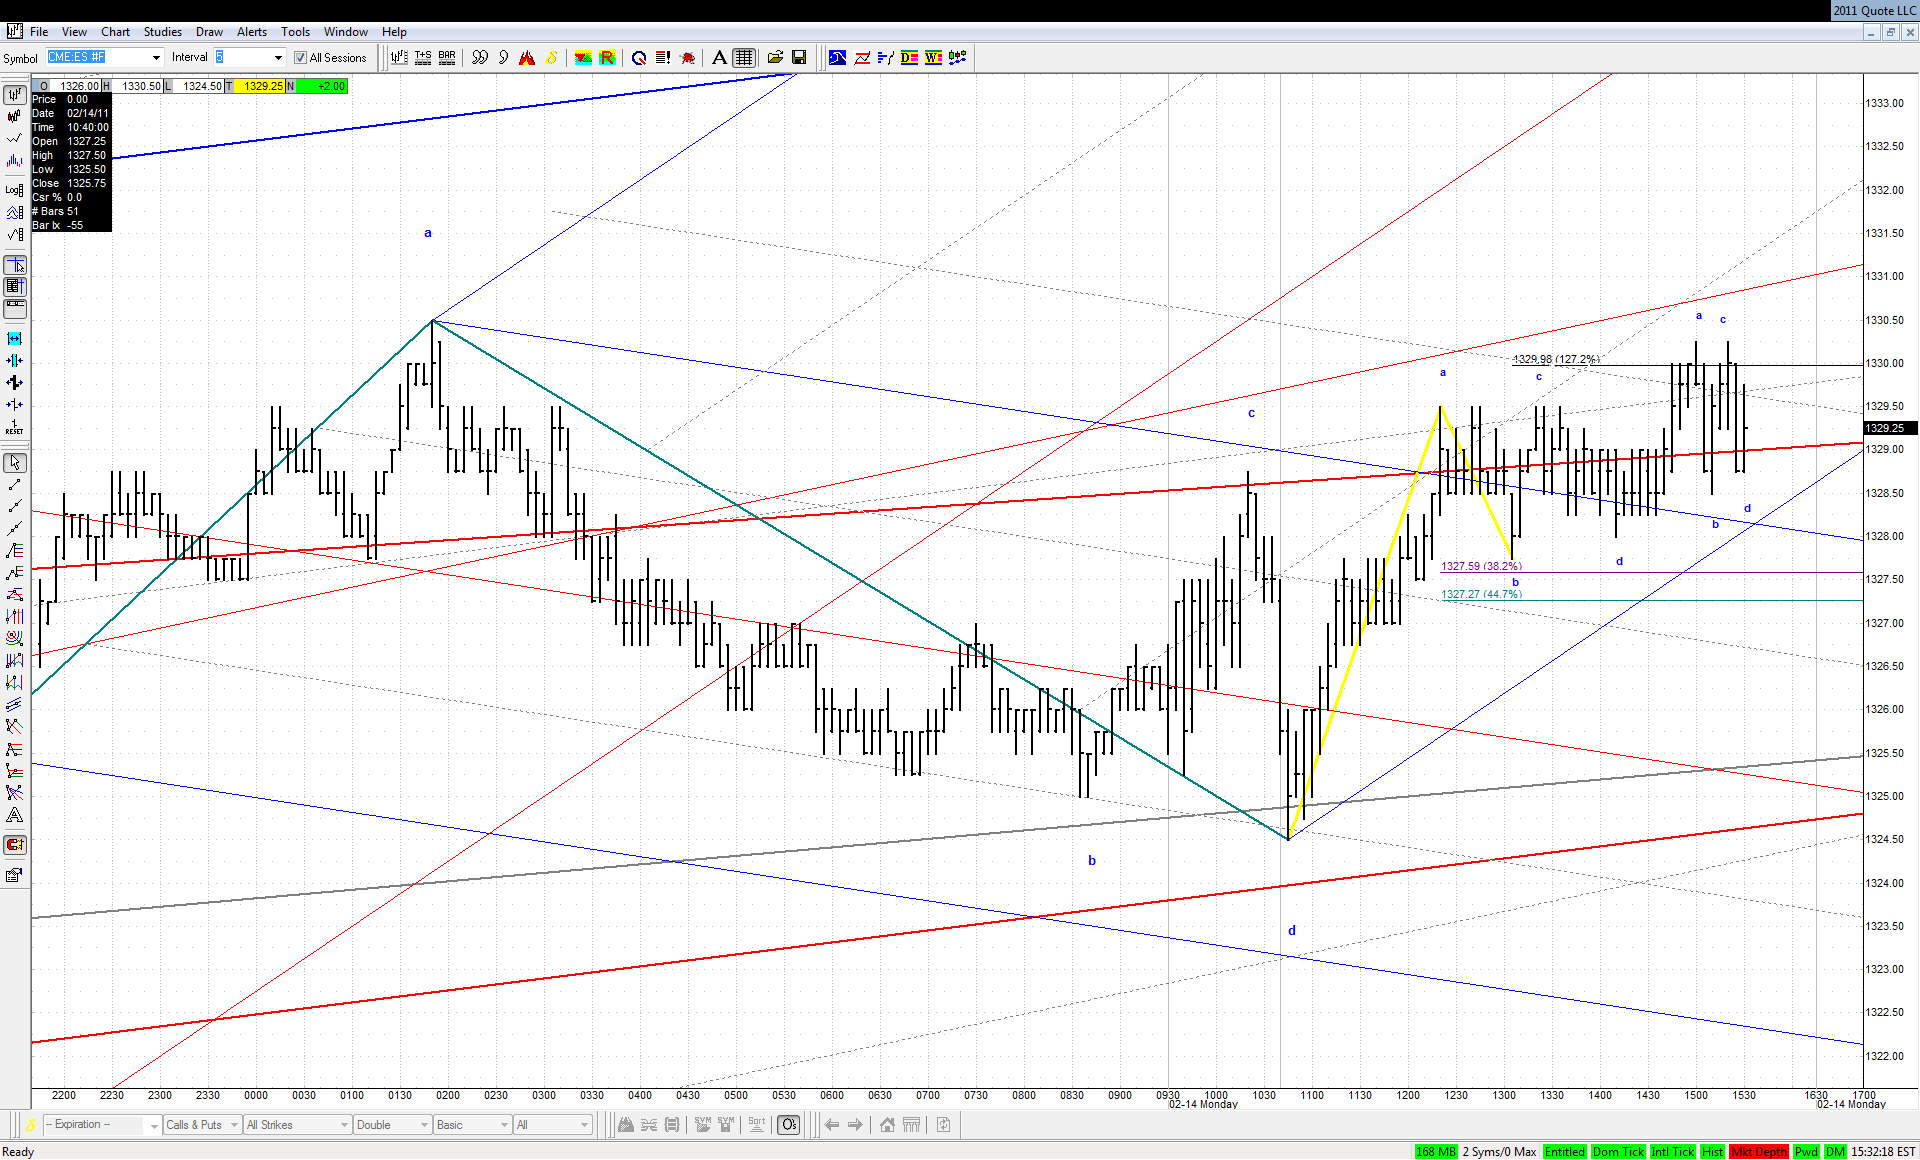
Is the move up that began on Friday a final acceleration to the 1330 area mentioned here couple of times? Or is it a start of something even bigger to the upside to finally convince everybody that this thing is never ever going to drop again? We'll have to wait to know the answer to this question. My personal opinion is closer to the second alternative, but of course I might be wrong. Some people say that the drop from May 2008 to the final 2009 bottom was an extended 5th wave. Such waves are usually fully retraced, and in such case the upper ML of the recent set needs to be met:
JI
jimkane
Rep: 3,058
Posts: 33,089
That's the chart I posted a long time ago, and have been discussing, and that Al posted in his area recently. As I said in there, it was part of the basis for my 1330 read from way back. Now we truly see. If it takes that line out, watch out. Truthfully, I can't see this party ending for awhile... Thanks for posting that in here for all to see, roofer.
Originally posted by roofer
JI
jimkane
Rep: 3,058
Posts: 33,089
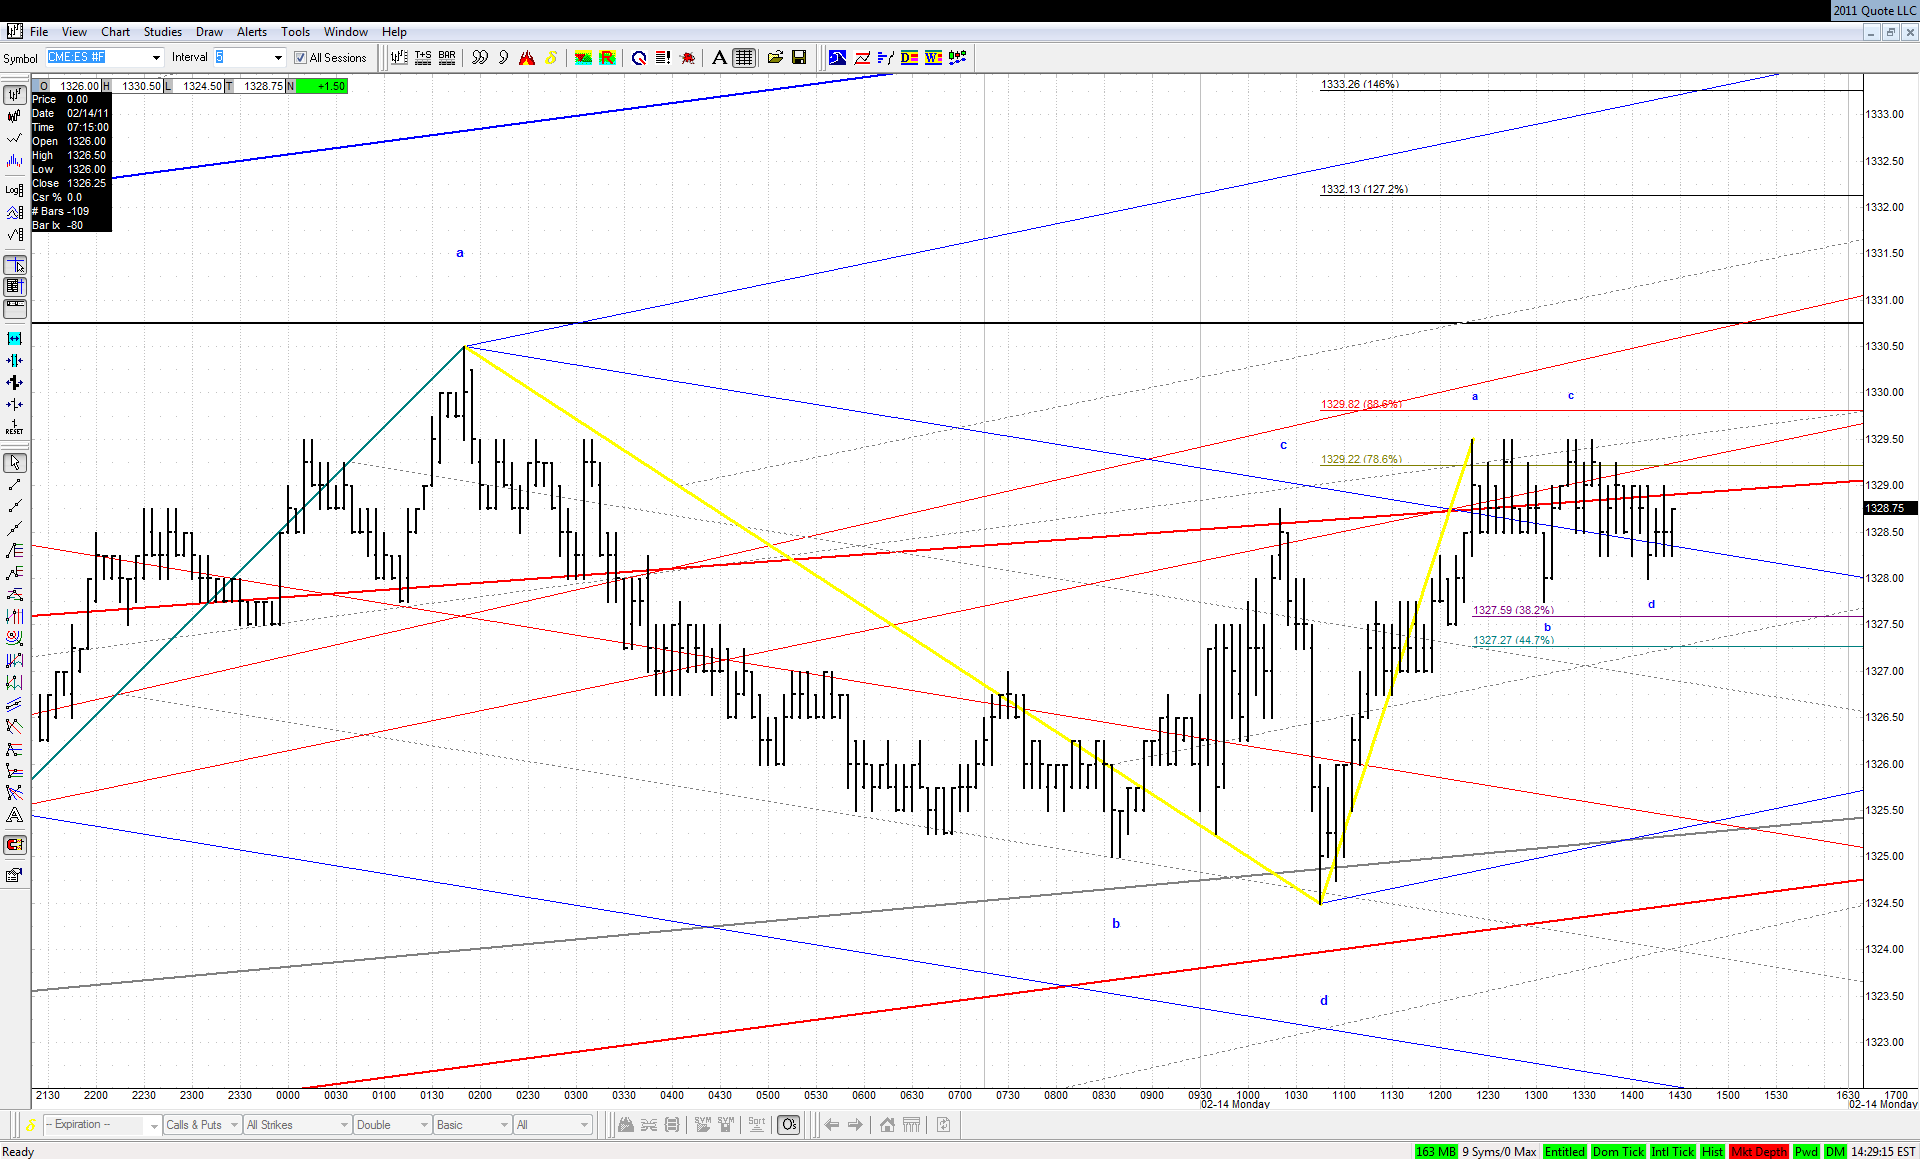
Watch that natural set line on the ES, it sure is battling with that.
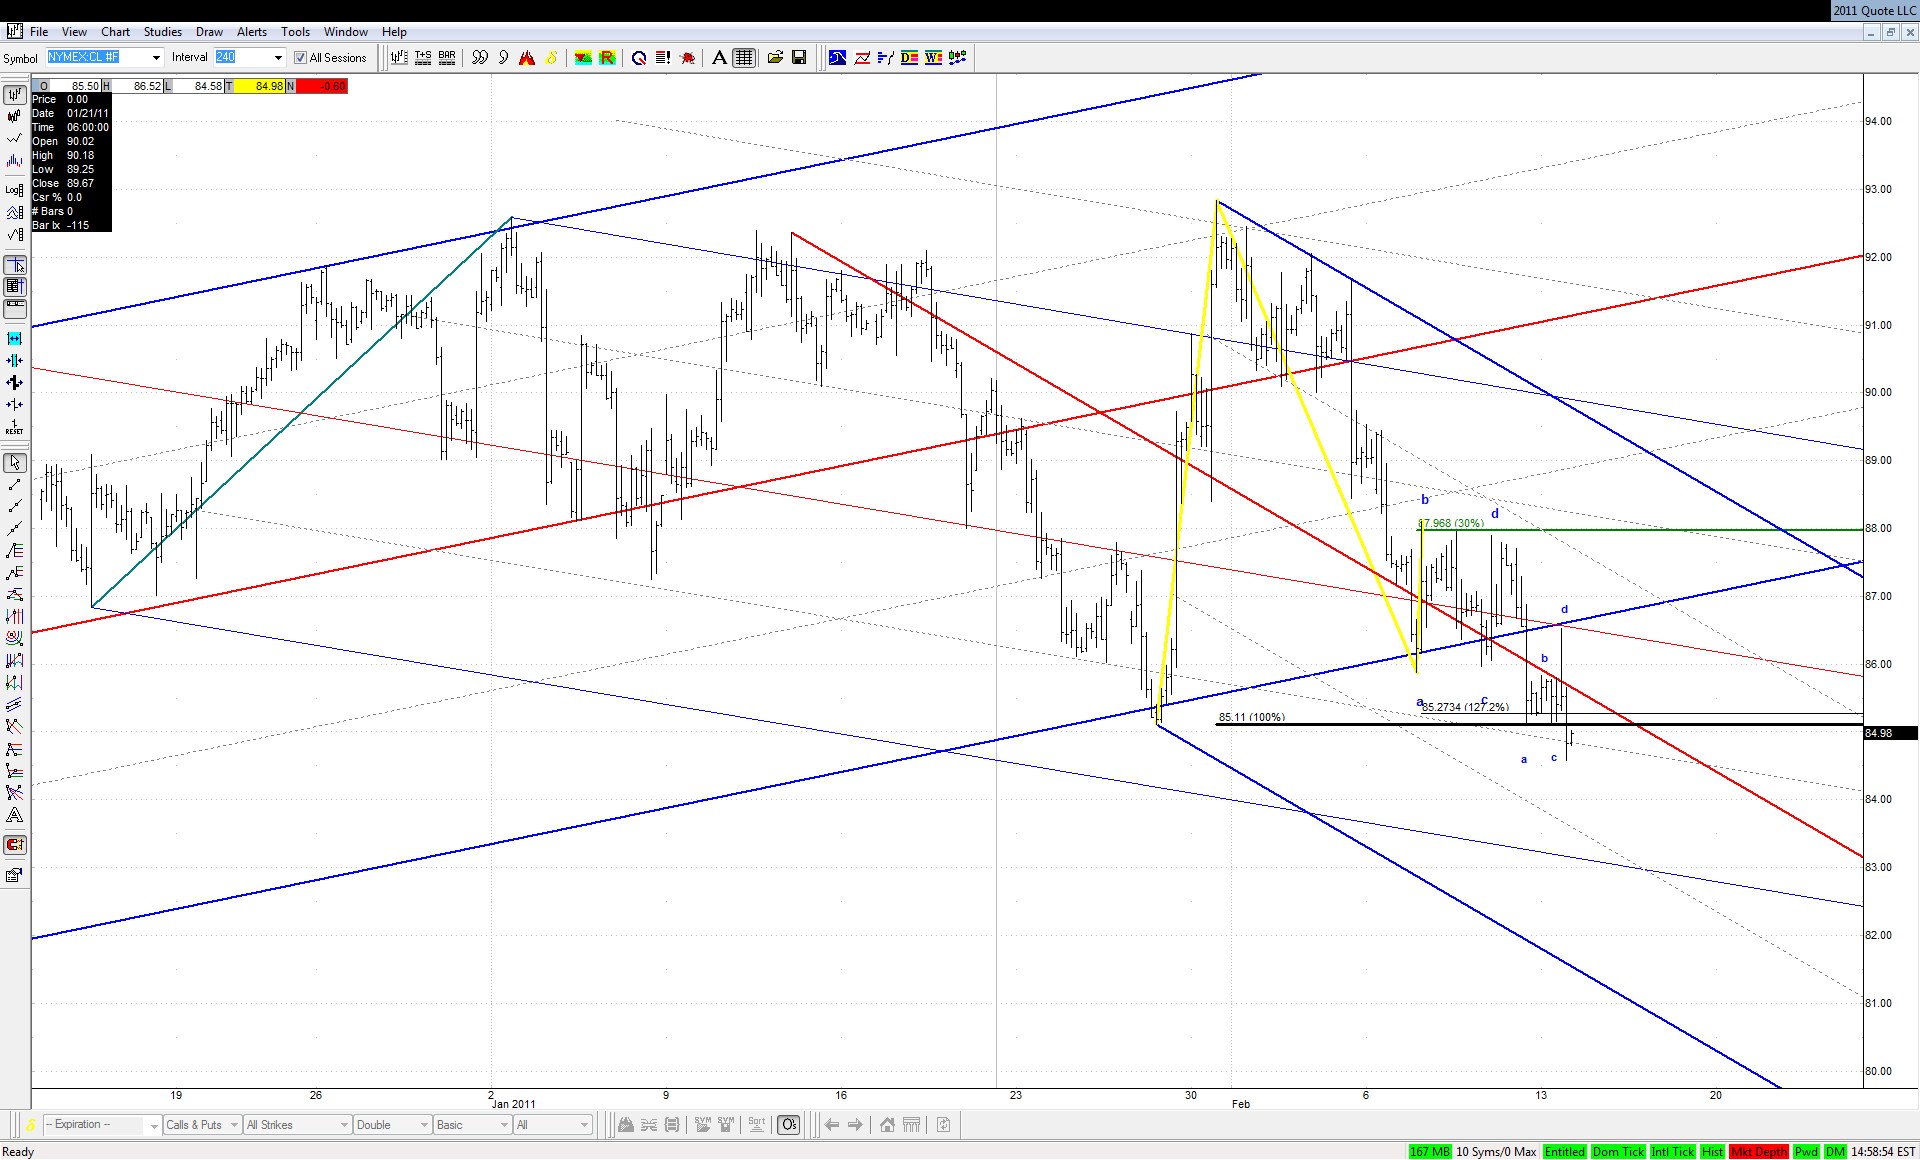
Watch that CL selling off in here, and the level it is at now.
I will post a note later on ICE vs. NYMEX crude right now, and HO, XRB, and so on. Very curious.
Watch that CL selling off in here, and the level it is at now.
I will post a note later on ICE vs. NYMEX crude right now, and HO, XRB, and so on. Very curious.
JI
jimkane
Rep: 3,058
Posts: 33,089
Key upper // gives way, as they move into risk... Two ticks from the new high for the entire 'bulls#%&' market.
Originally posted by jimkane
Okay, watch for a move into risk in here. Just a thought.
JI
jimkane
Rep: 3,058
Posts: 33,089
One tick from the new high. If they can't get it, they may dump it for another try.
RO
roofer
Rep: 3,689
Posts: 3,574
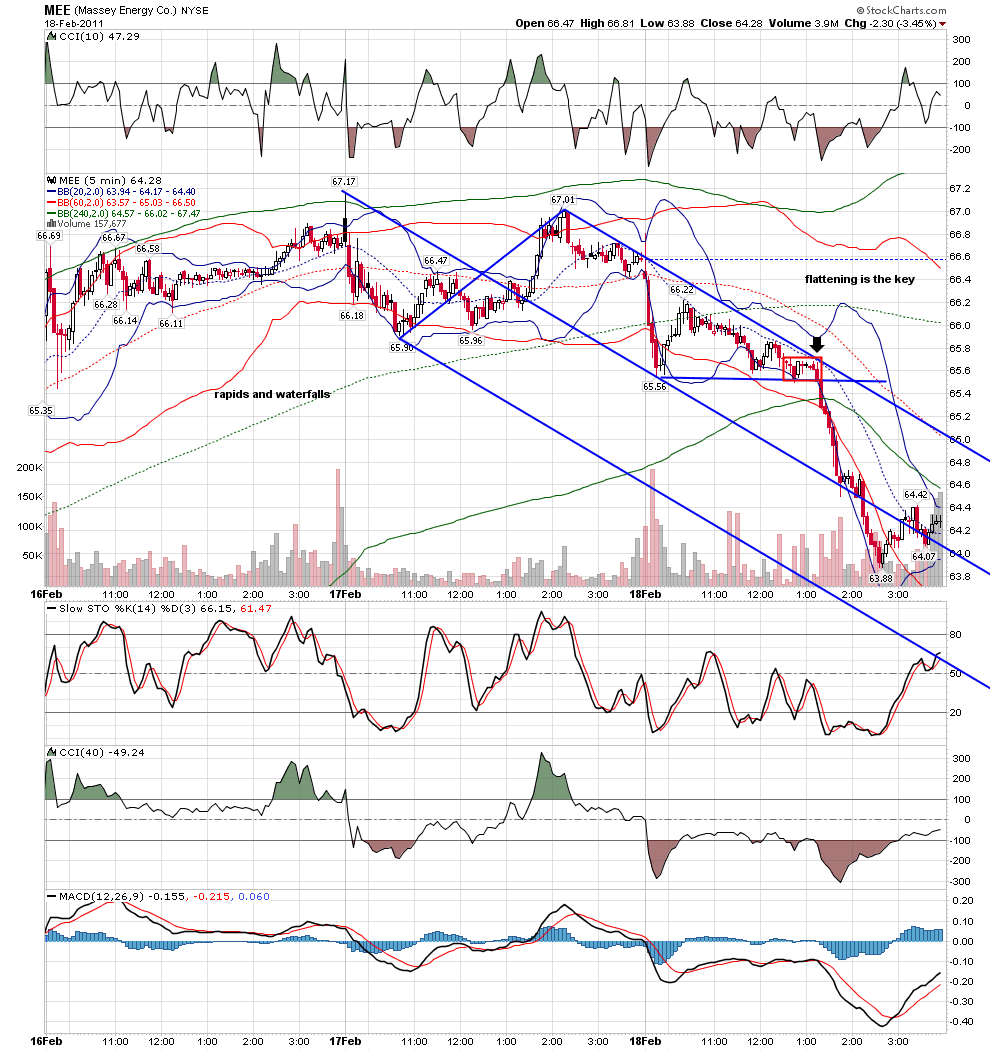
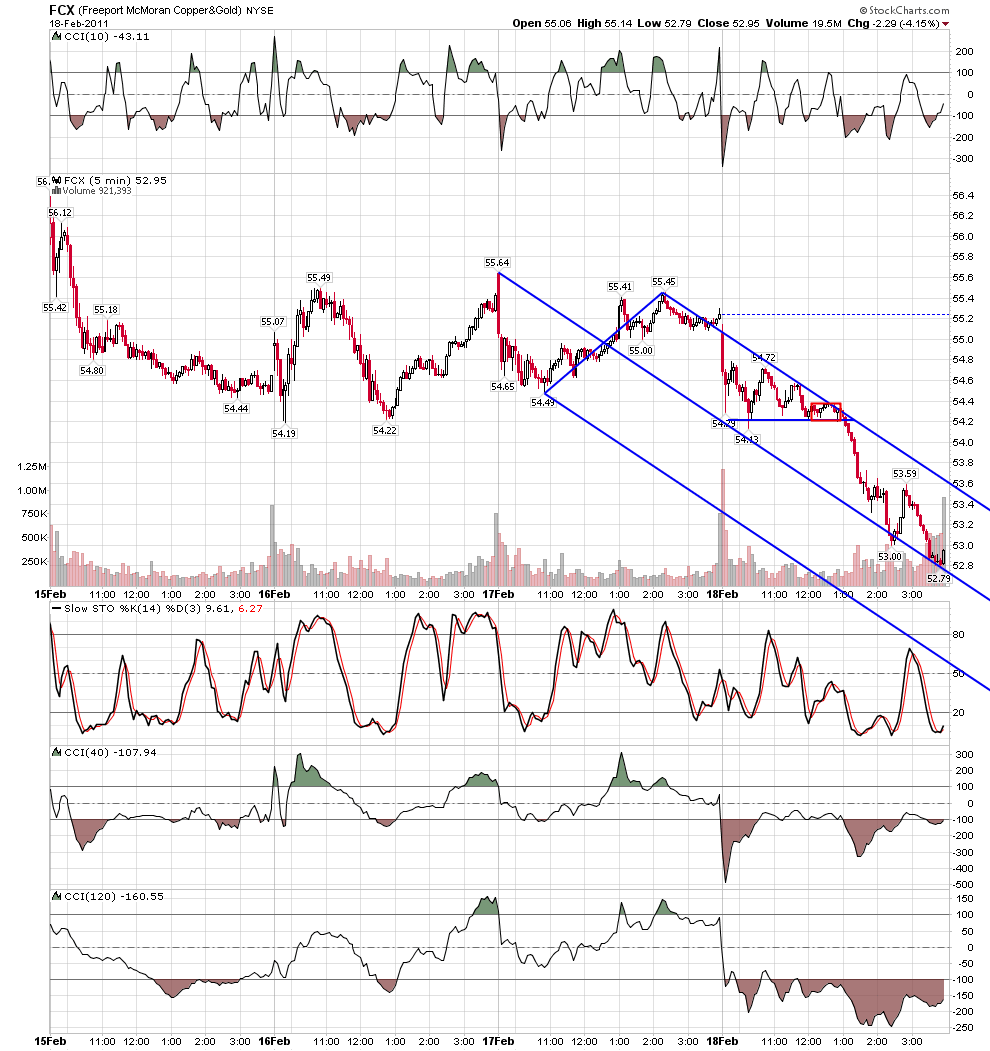
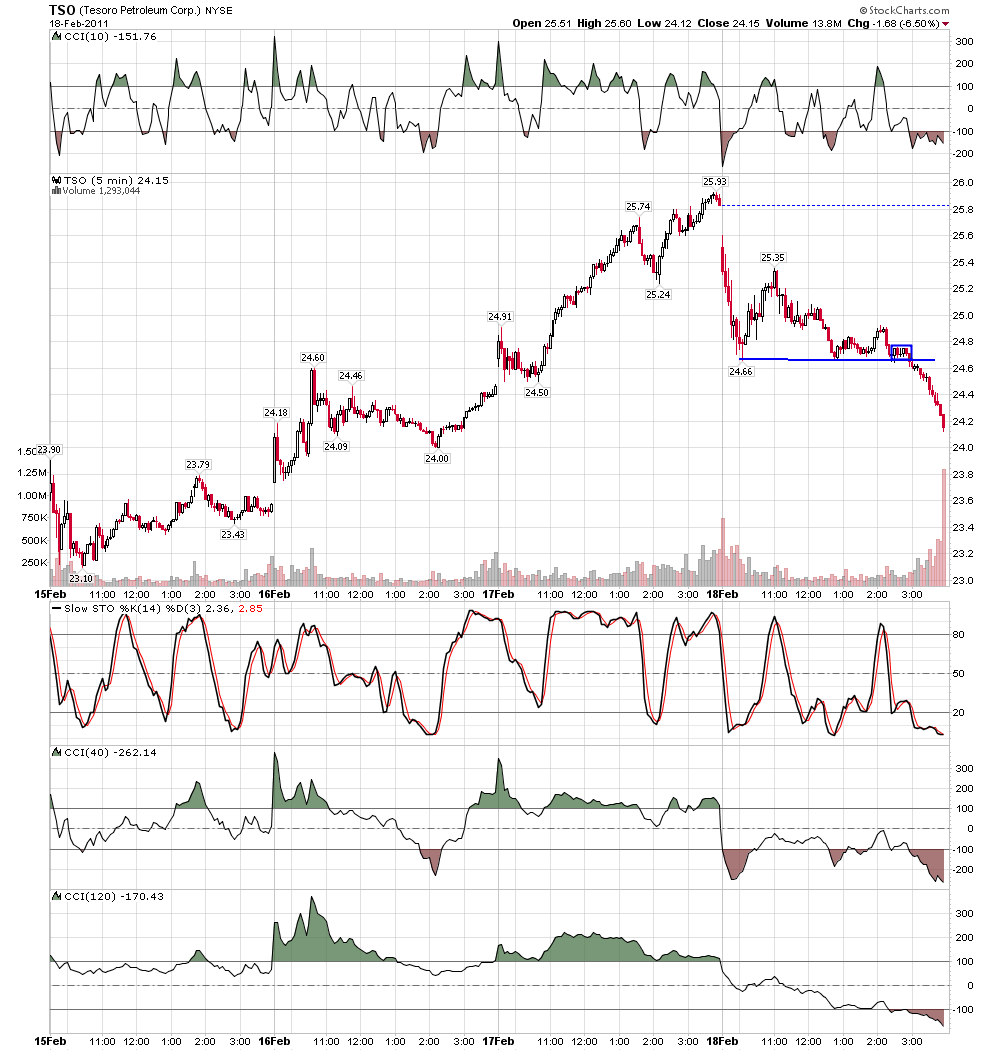
rat 89 will remember this one....it is a rare day when i will short into oversold.... but the pattern repeats over and over.....rapids and waterfall... the key is the flattening right before price goes..under the cover of opex, the computers were using the patterns to get price to the correct strike.... something else.... i feel a wave four triangle of some degree just ahead... the down in many stocks can be seen as the ab leg of abcd's that i think the c will setup just as the triangle leg is set to go....