MyPivots
Sign In
JA
jarek
Rep: 94
Posts: 3,474
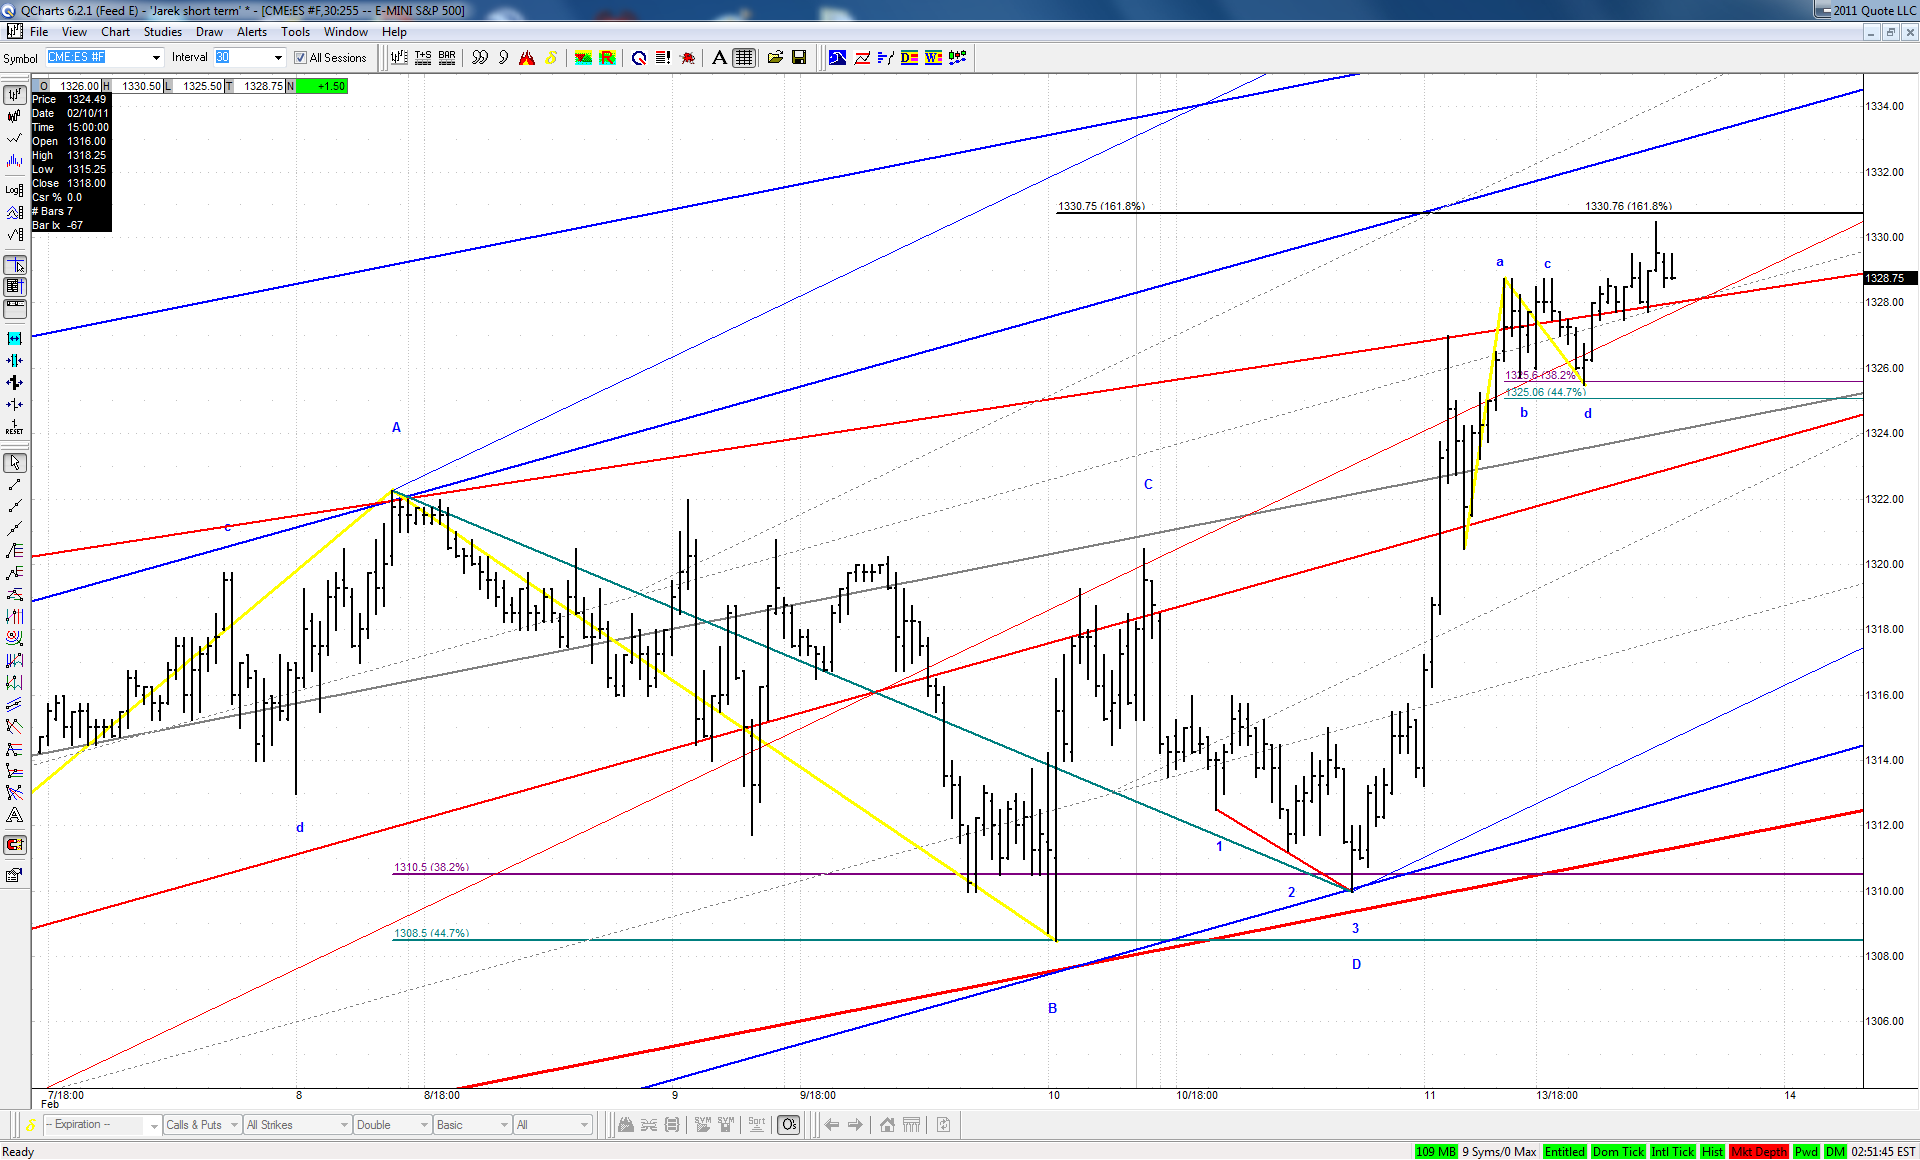
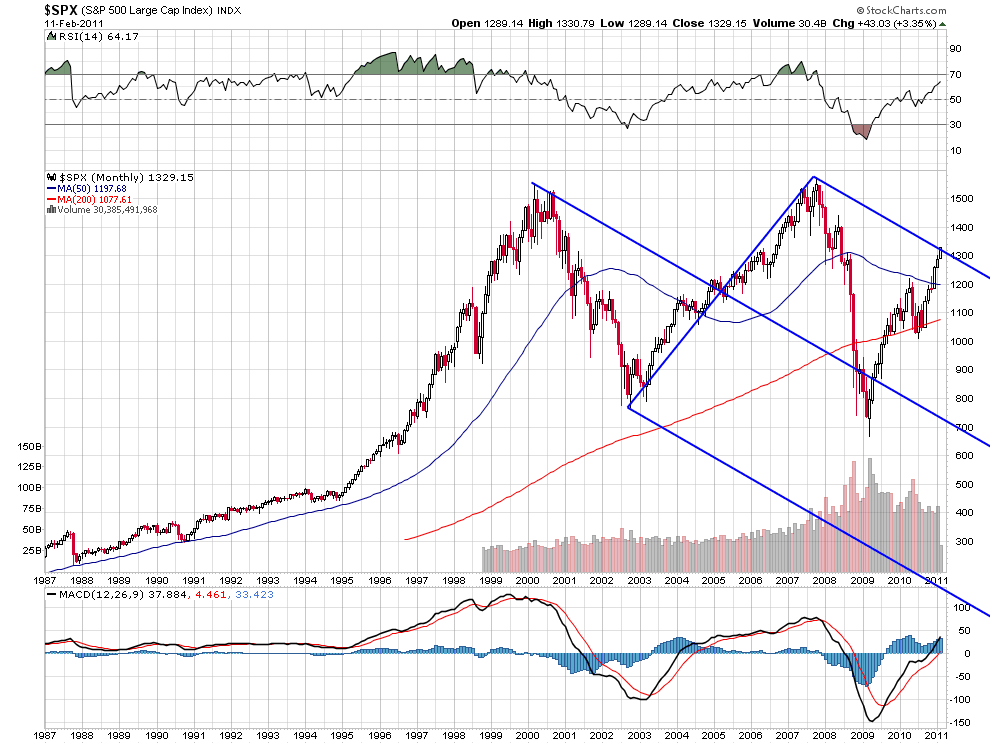
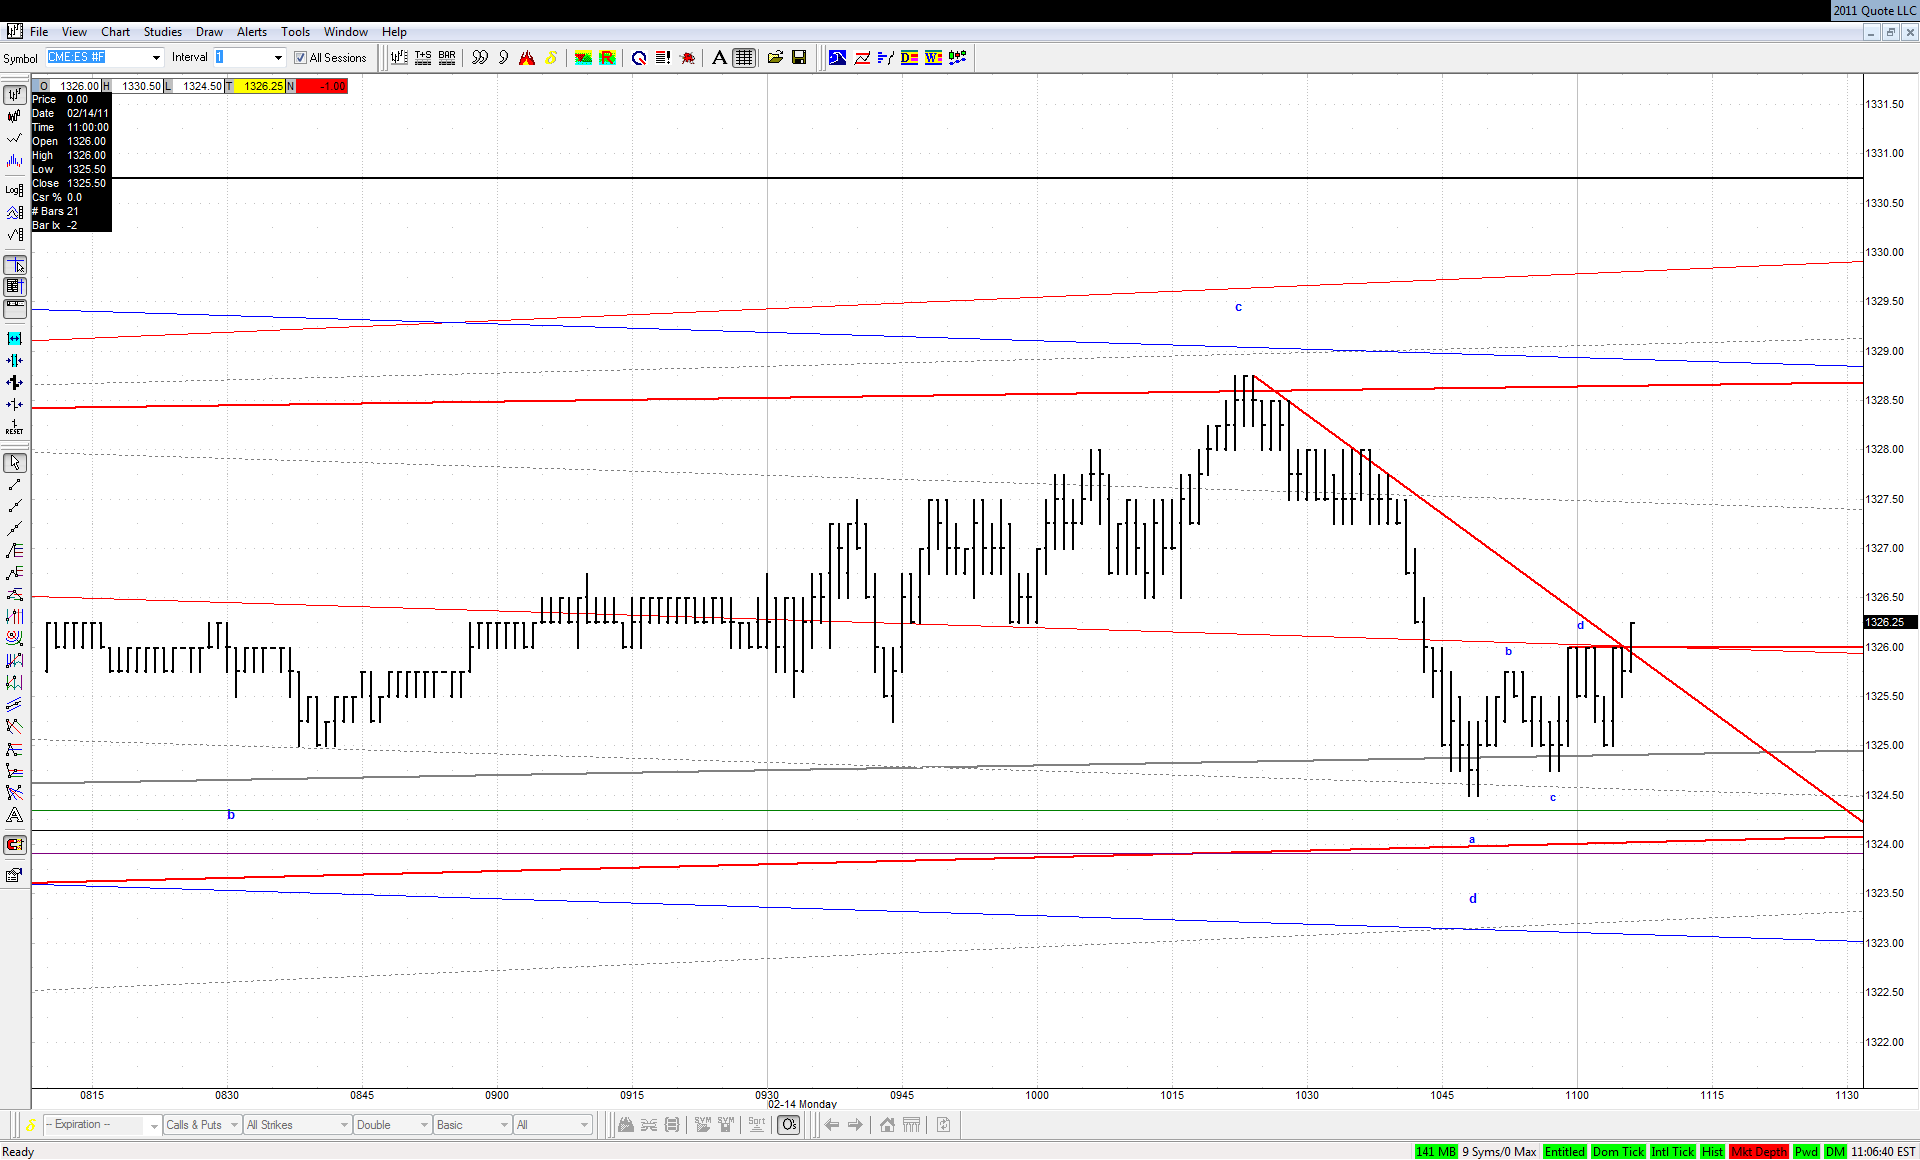
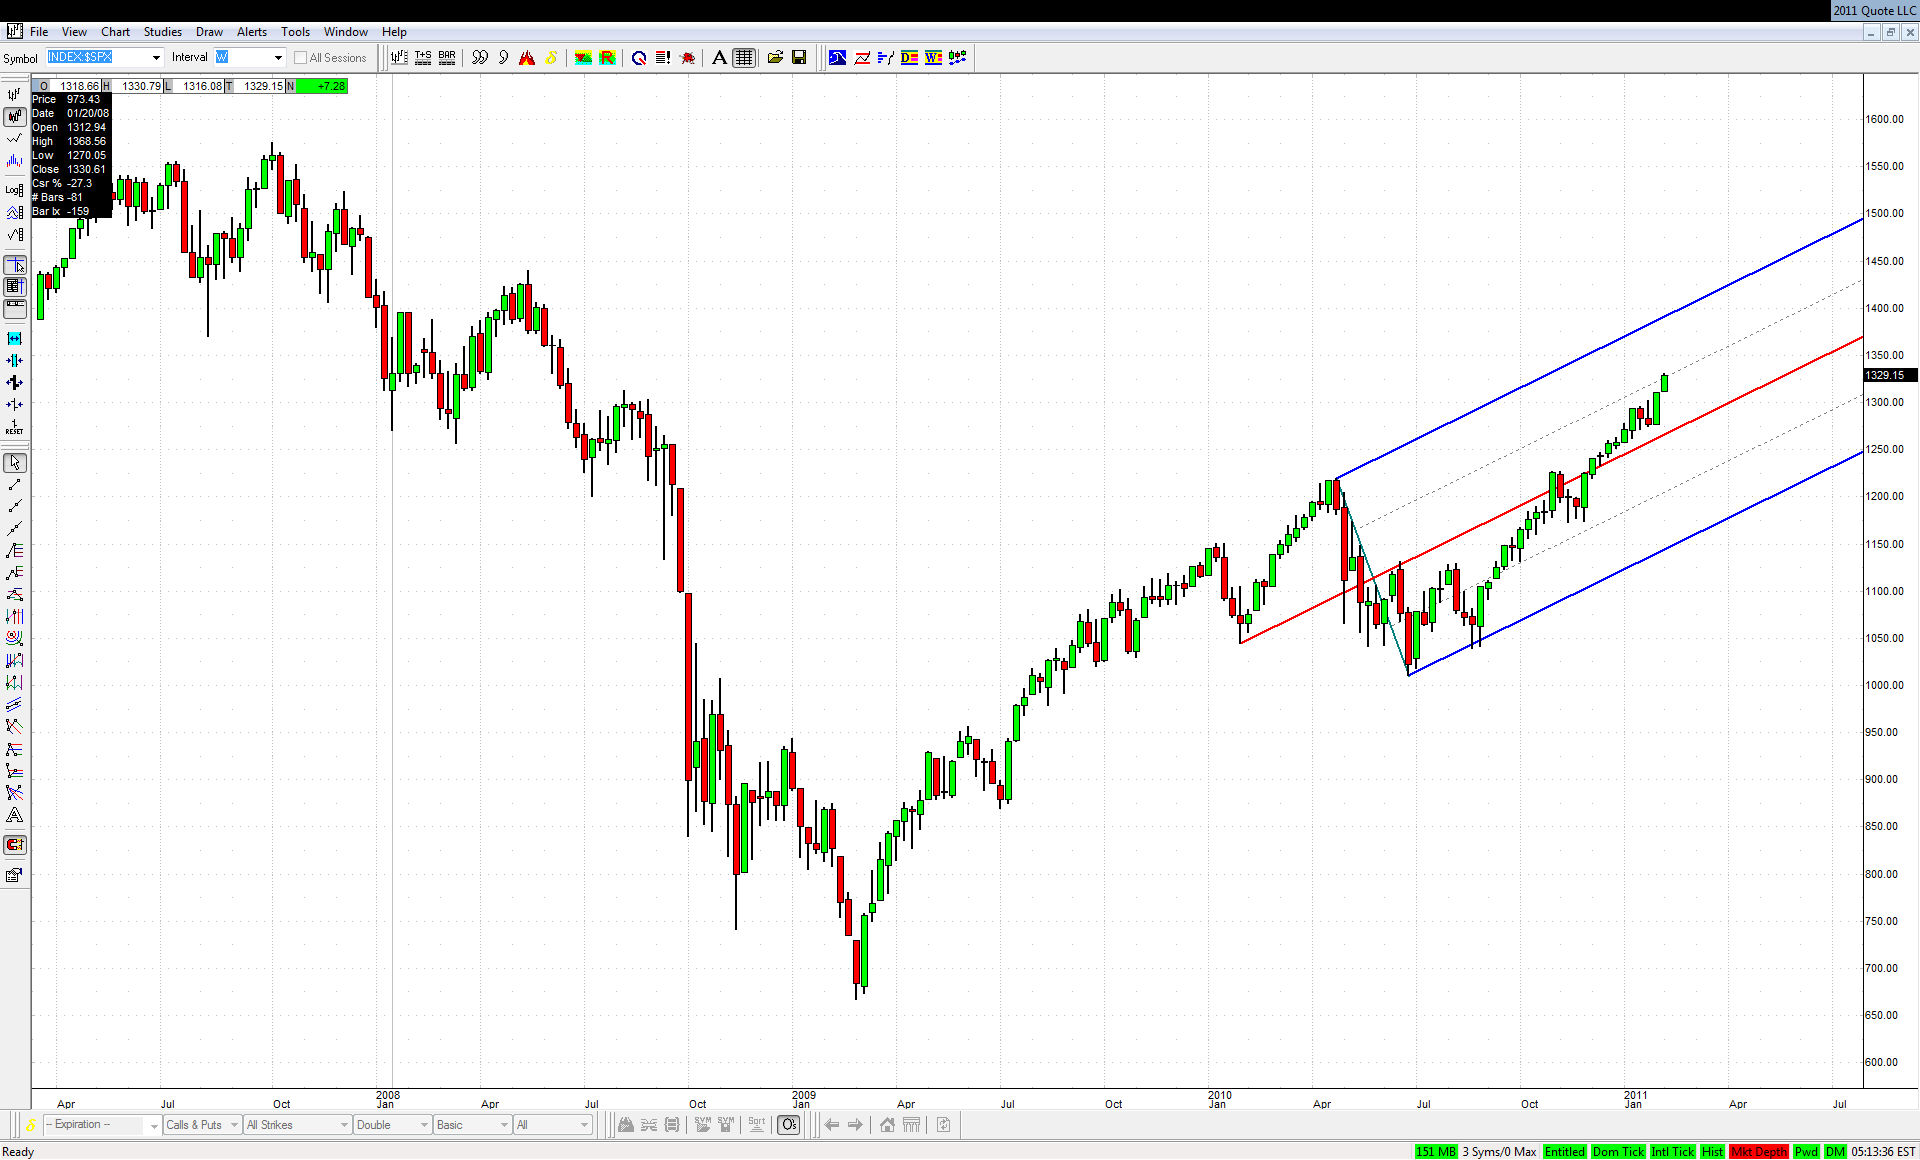
Is the move up that began on Friday a final acceleration to the 1330 area mentioned here couple of times? Or is it a start of something even bigger to the upside to finally convince everybody that this thing is never ever going to drop again? We'll have to wait to know the answer to this question. My personal opinion is closer to the second alternative, but of course I might be wrong. Some people say that the drop from May 2008 to the final 2009 bottom was an extended 5th wave. Such waves are usually fully retraced, and in such case the upper ML of the recent set needs to be met:


Click image for original size
JA
jarek
Rep: 94
Posts: 3,474
Originally posted by jimkane

... Too easy...


... but only for those, who are on the right side. Everyday there are bears thrown out of the market forever, who believed it could not possibly go any higher without a meaningful correction...
JA
jarek
Rep: 94
Posts: 3,474
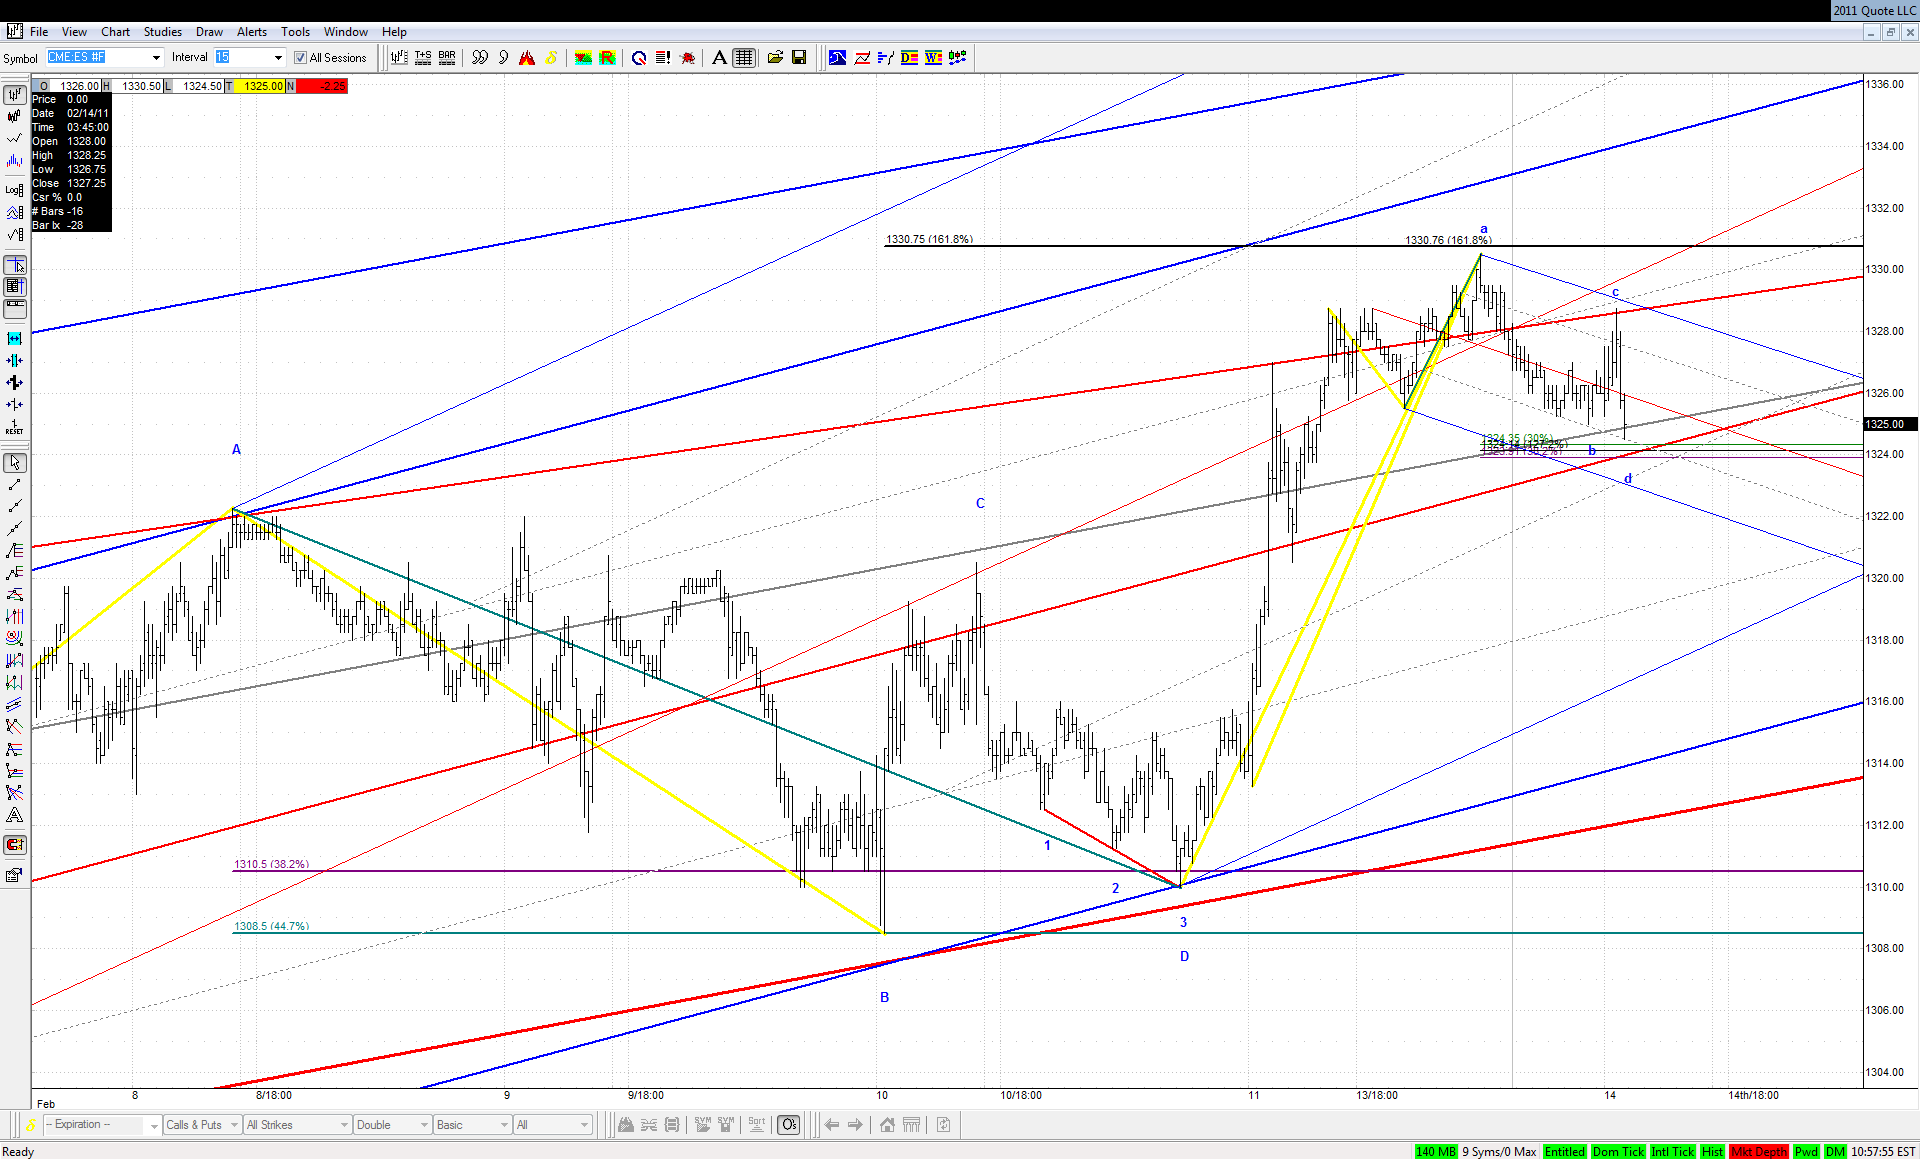
At one time it'll start retracing more than just to the closest Kane Zone:


Click image for original size


...but for now it is the right game to play
IX
ixon
Rep: 0
Posts: 25
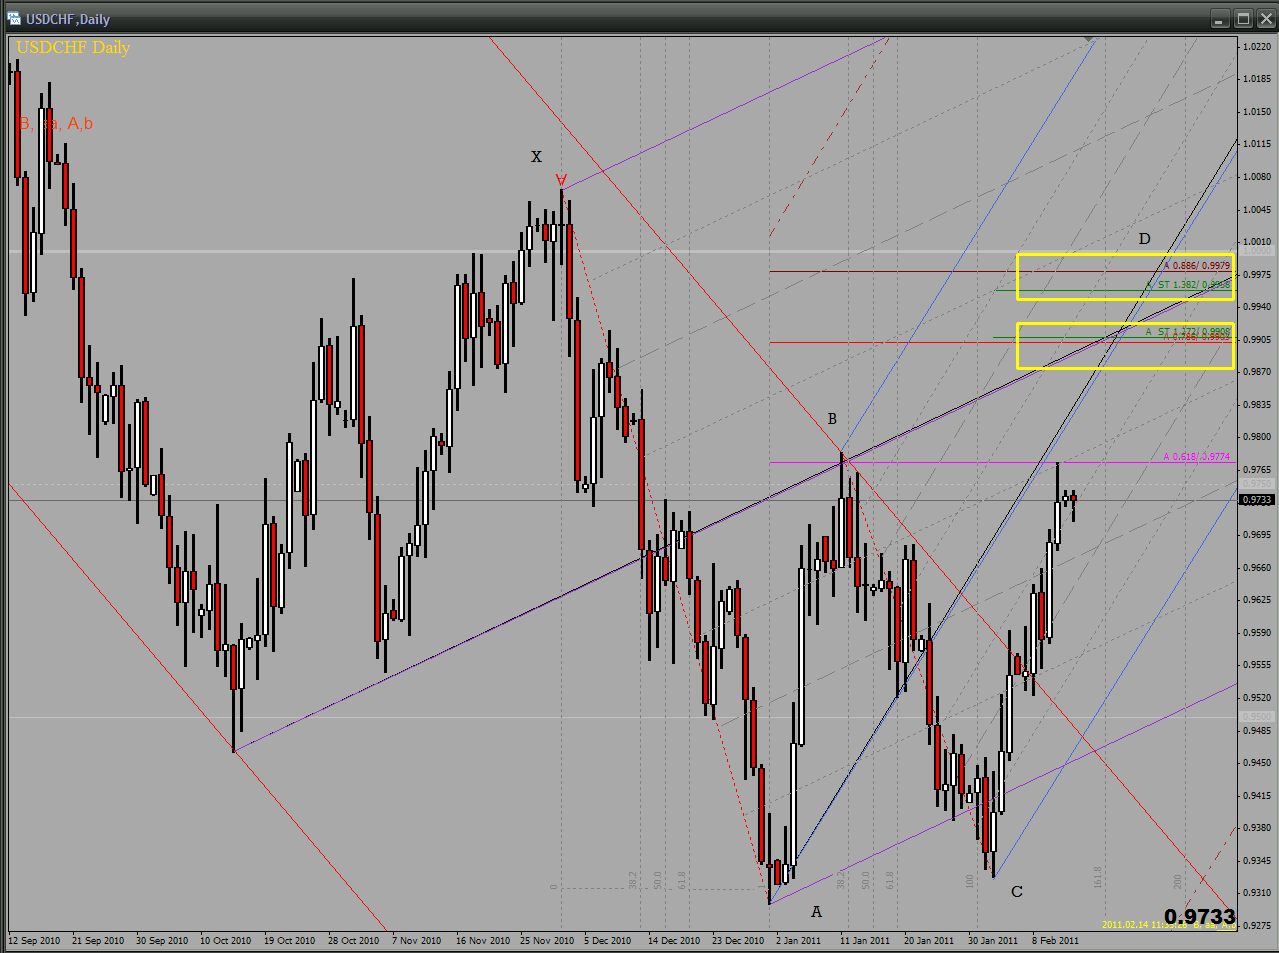
Whot You all think of this? will it go up?
Click image for original size
IX
ixon
Rep: 0
Posts: 25
Will it go down?
Click image for original size
JA
jarek
Rep: 94
Posts: 3,474
Originally posted by ixon

Whot You all think of this? will it go up?


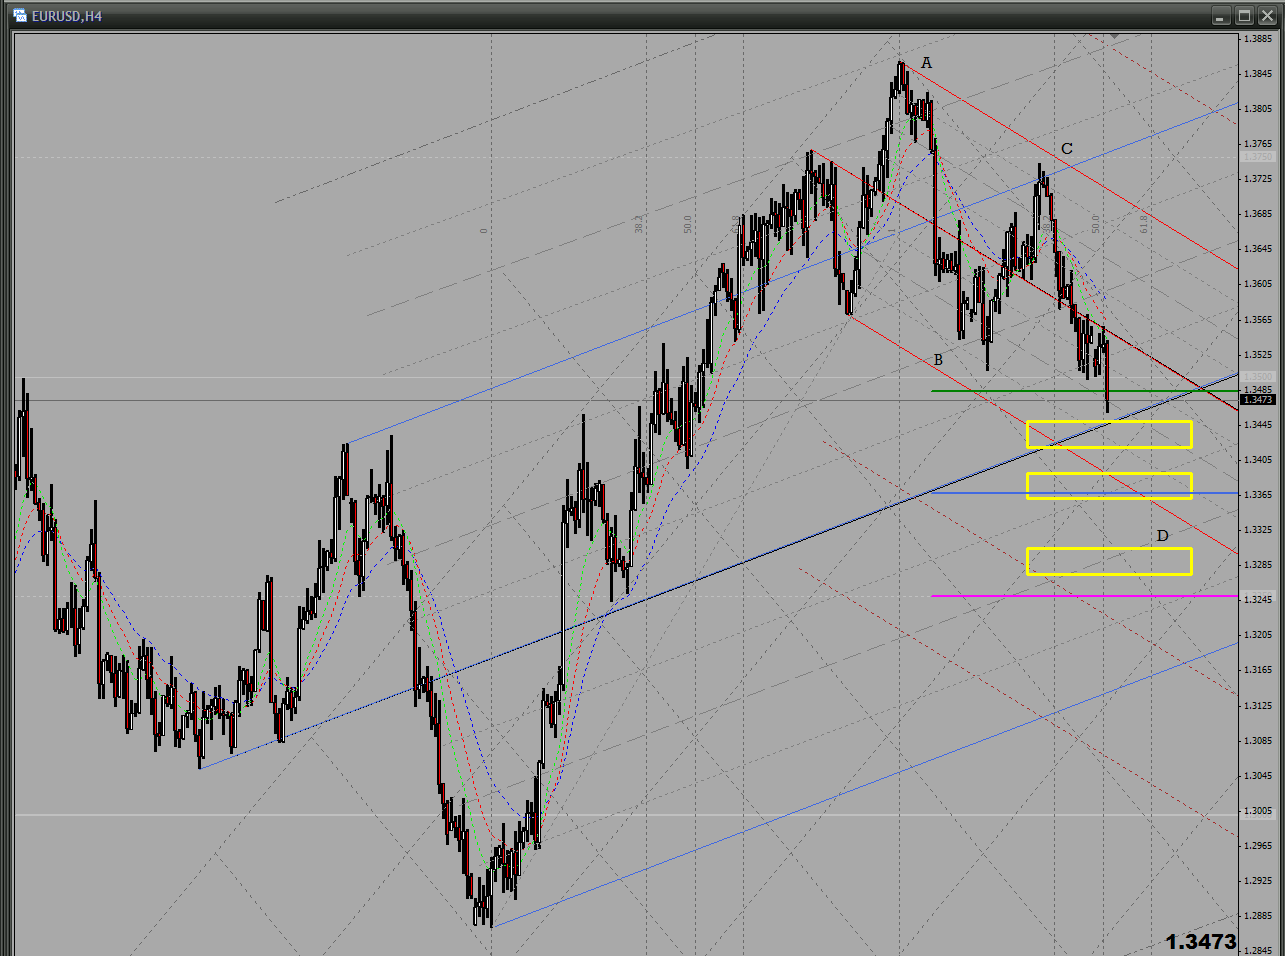
Your bullish ABCD may produce some upside reaction, but I won't be bullish on EUR unless it overtakes the upper ML of the following downsloping set:


Click image for original size
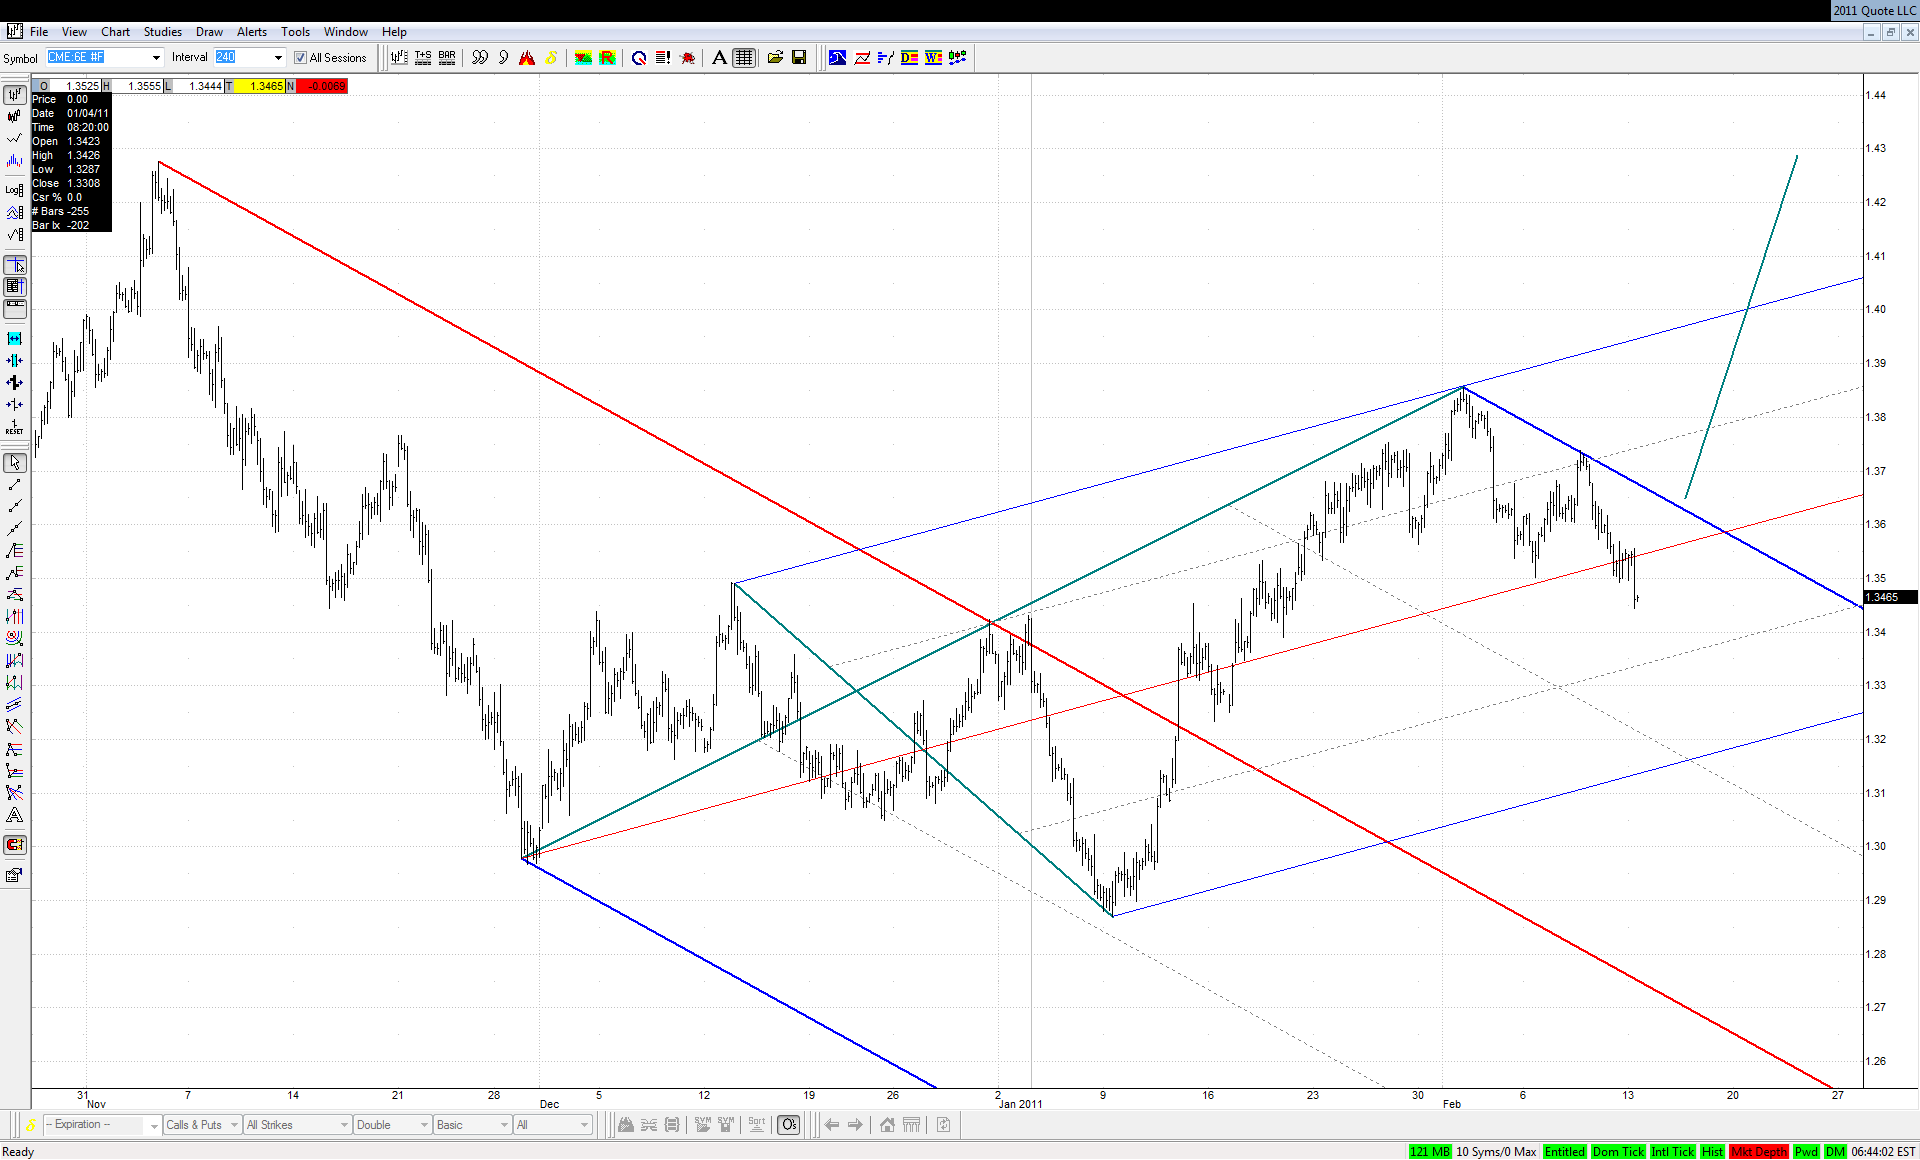

In fact it could be a perfect retest of this line, driven by this bullish ABCD...
RO
roofer
Rep: 3,689
Posts: 3,574
Click image for original size
JA
jarek
Rep: 94
Posts: 3,474
Maybe not very symmetrical, but still a .300/.382 bullish ABCD at lines:


Click image for original size
JA
jarek
Rep: 94
Posts: 3,474
Nice trigger - now we'll see:


Click image for original size
JA
jarek
Rep: 94
Posts: 3,474
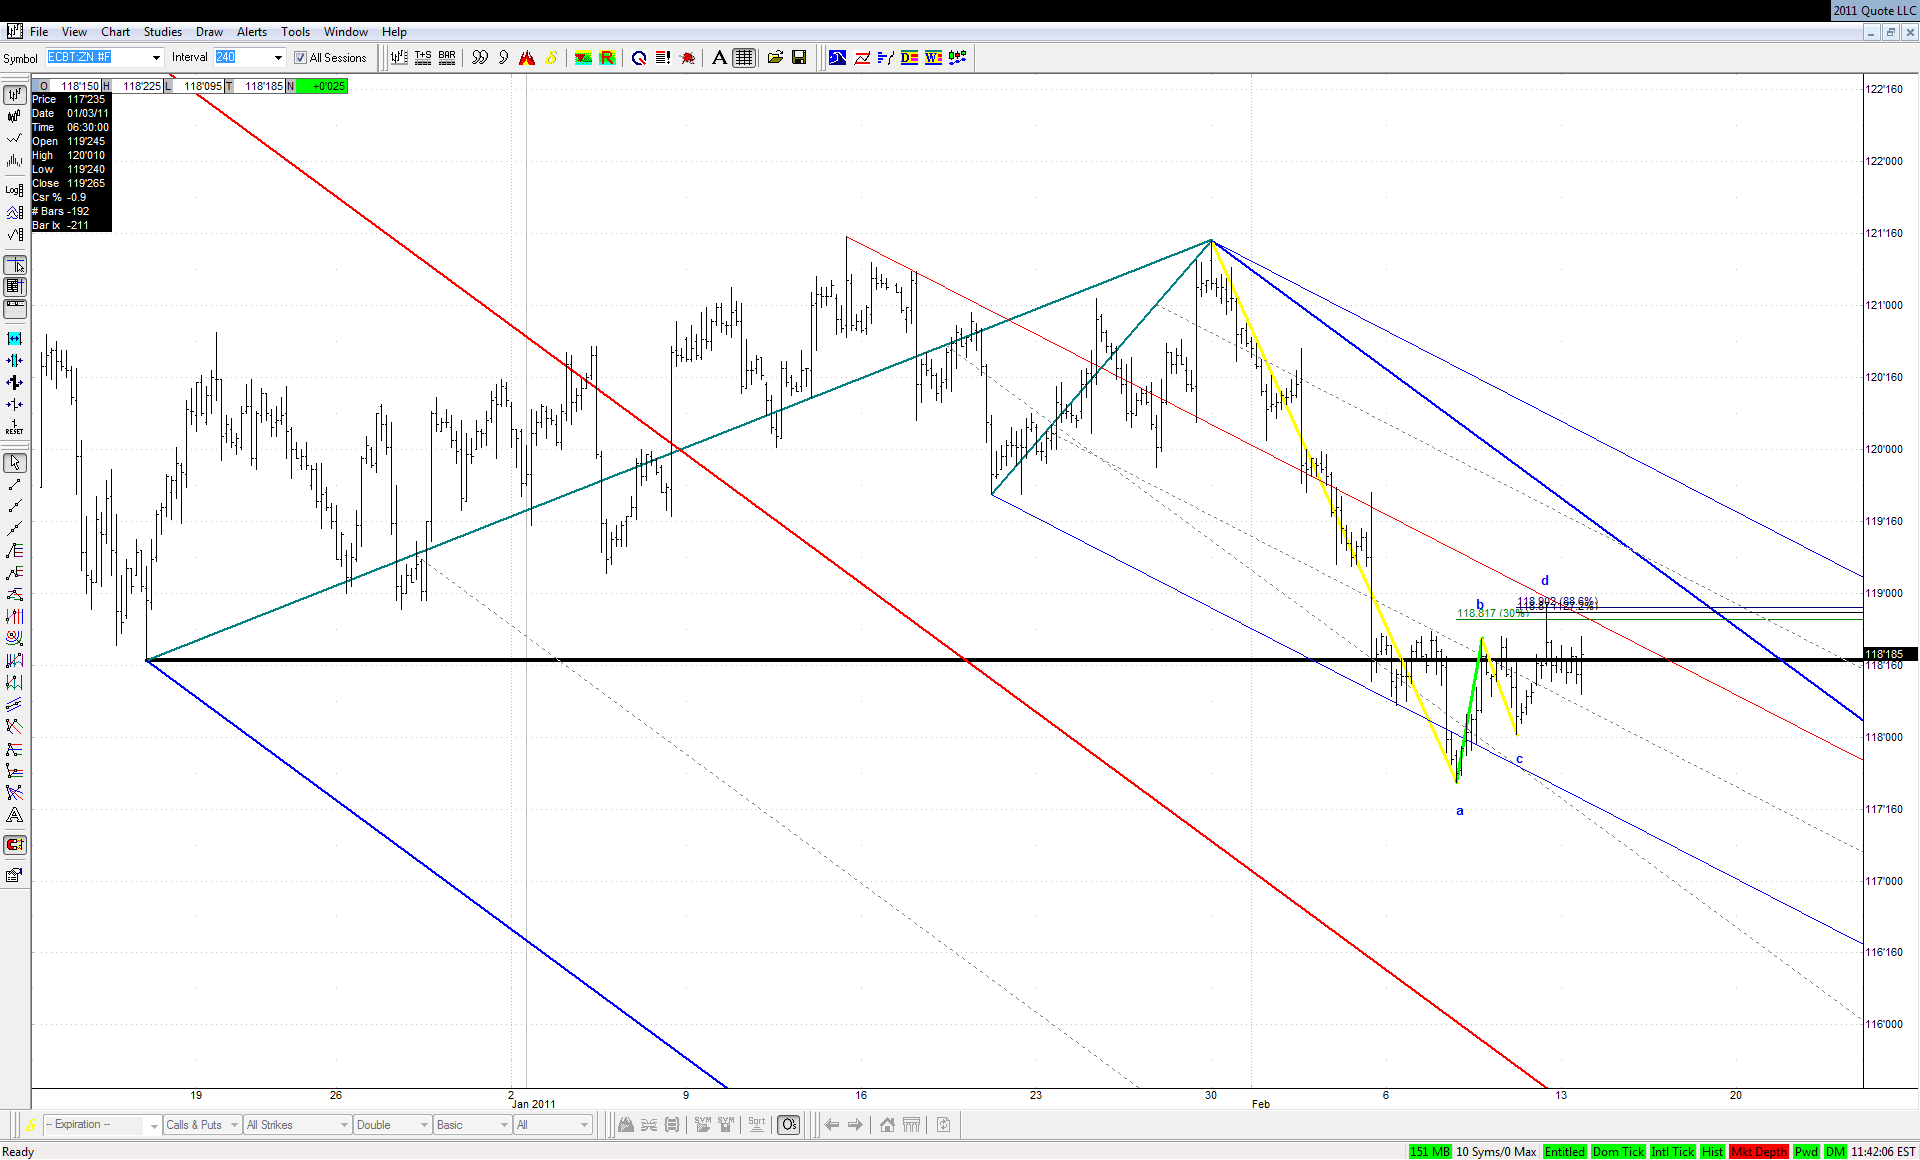
Bulls in Bonds are still unable to take out the December low resistance. Now a bearish ABCD has set up against them, so they will need even more efforts:


Click image for original size
JA
jarek
Rep: 94
Posts: 3,474
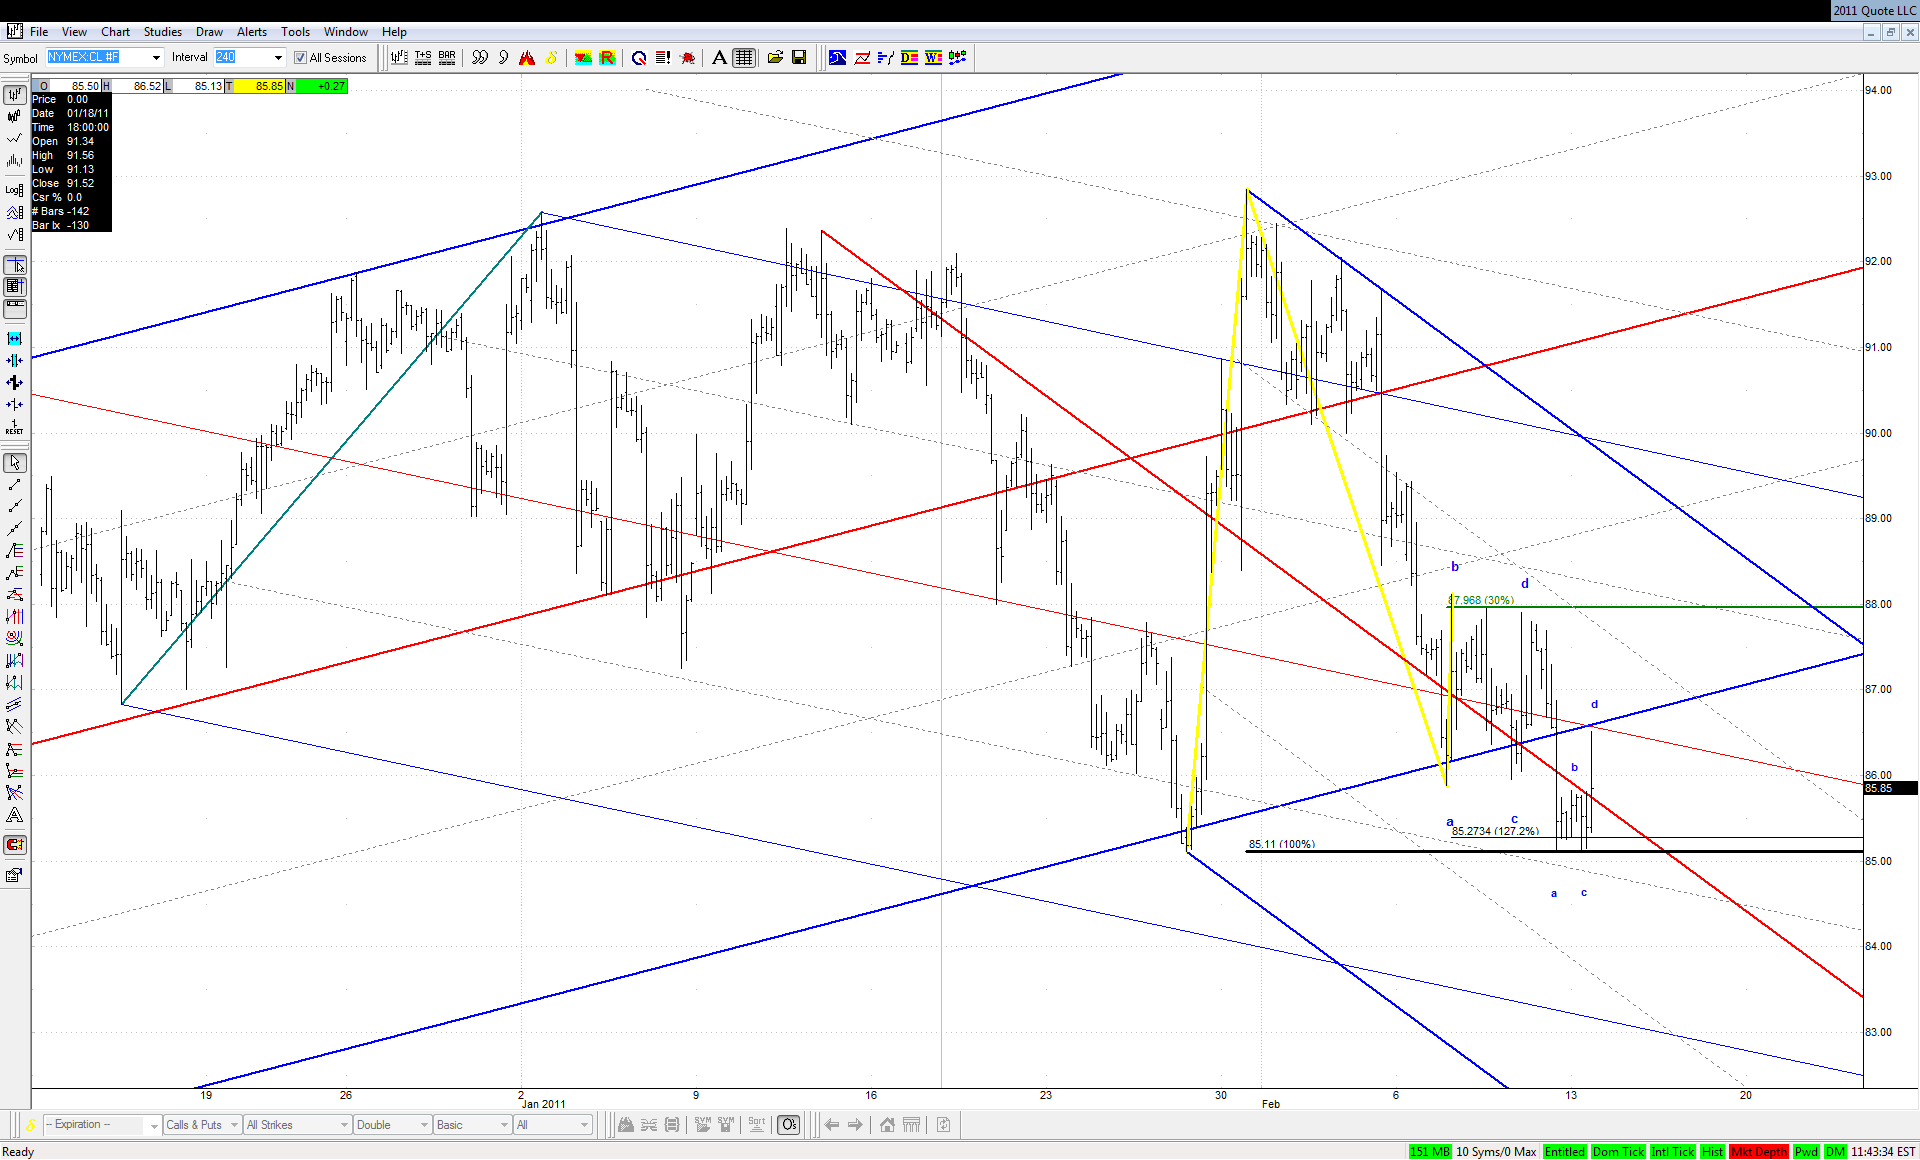
Similar situation in Crude - a DB ABCD that finished at x marks the spot is a symbol of wind from the front for bulls:


Click image for original size
RO
roofer
Rep: 3,689
Posts: 3,574
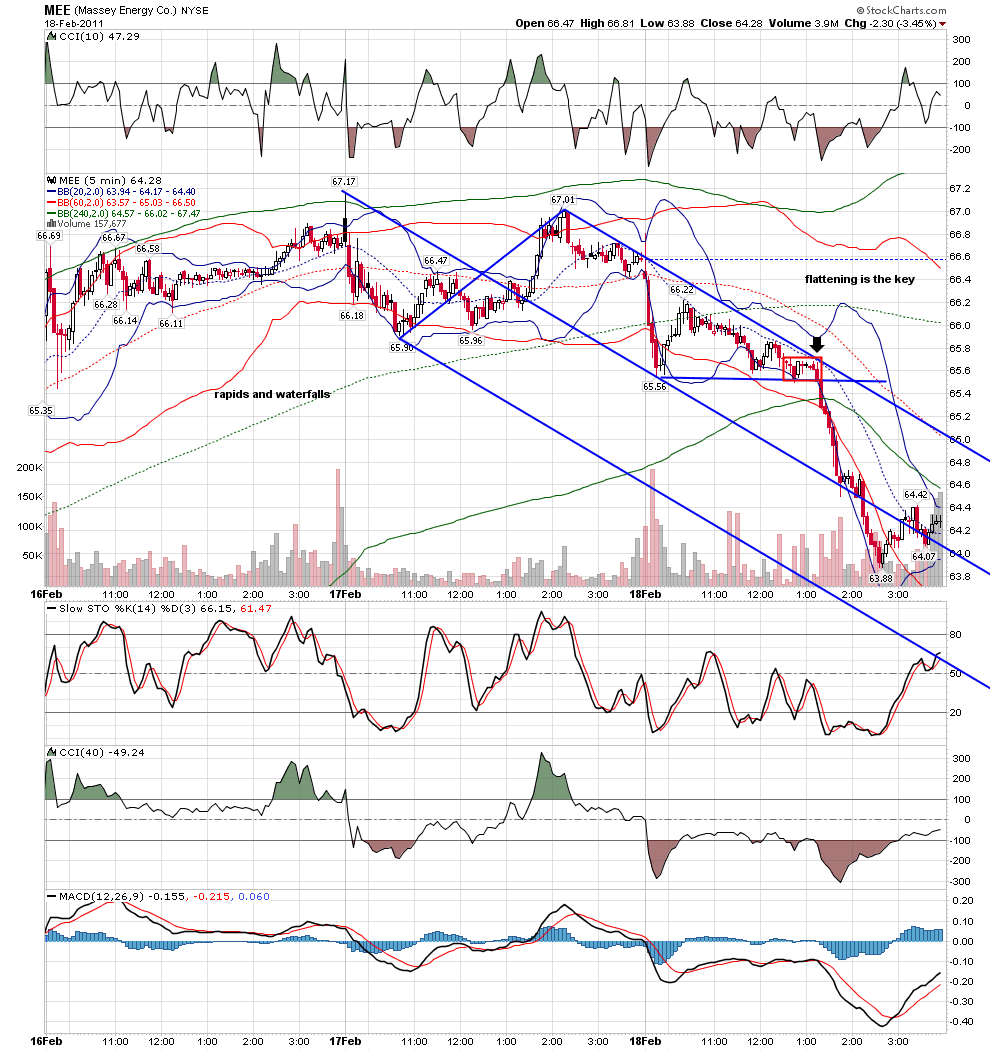
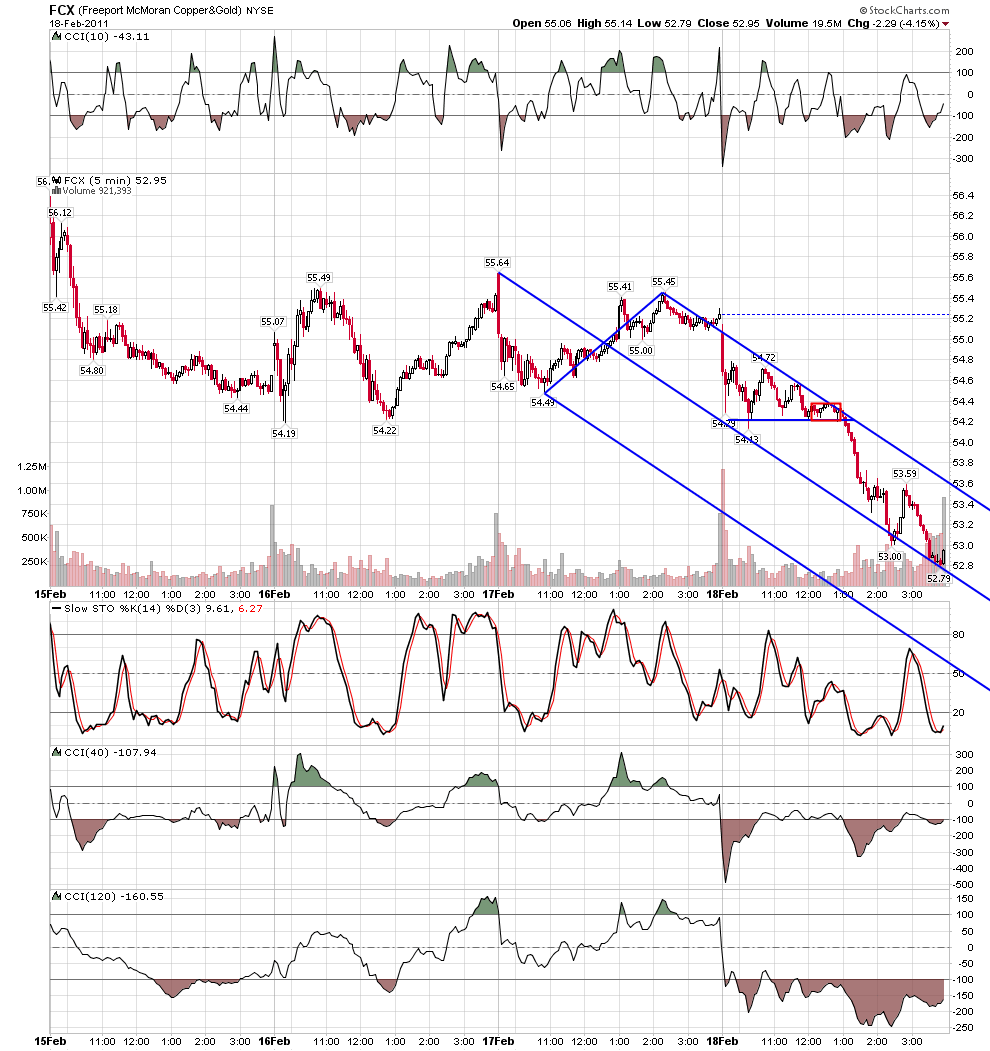
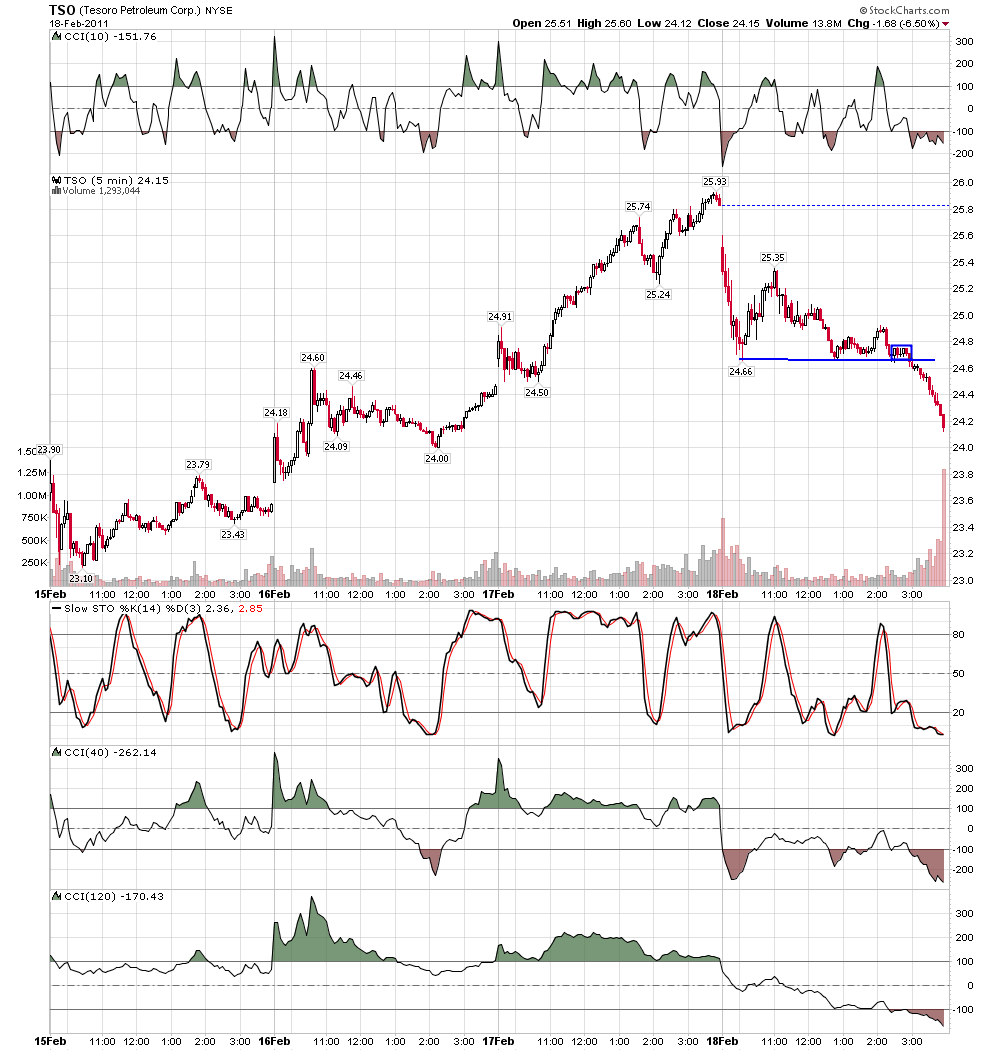
rat 89 will remember this one....it is a rare day when i will short into oversold.... but the pattern repeats over and over.....rapids and waterfall... the key is the flattening right before price goes..under the cover of opex, the computers were using the patterns to get price to the correct strike.... something else.... i feel a wave four triangle of some degree just ahead... the down in many stocks can be seen as the ab leg of abcd's that i think the c will setup just as the triangle leg is set to go....
Click image for original size

Click image for original size

Click image for original size