MyPivots
Sign In
JA
jarek
Rep: 94
Posts: 3,474
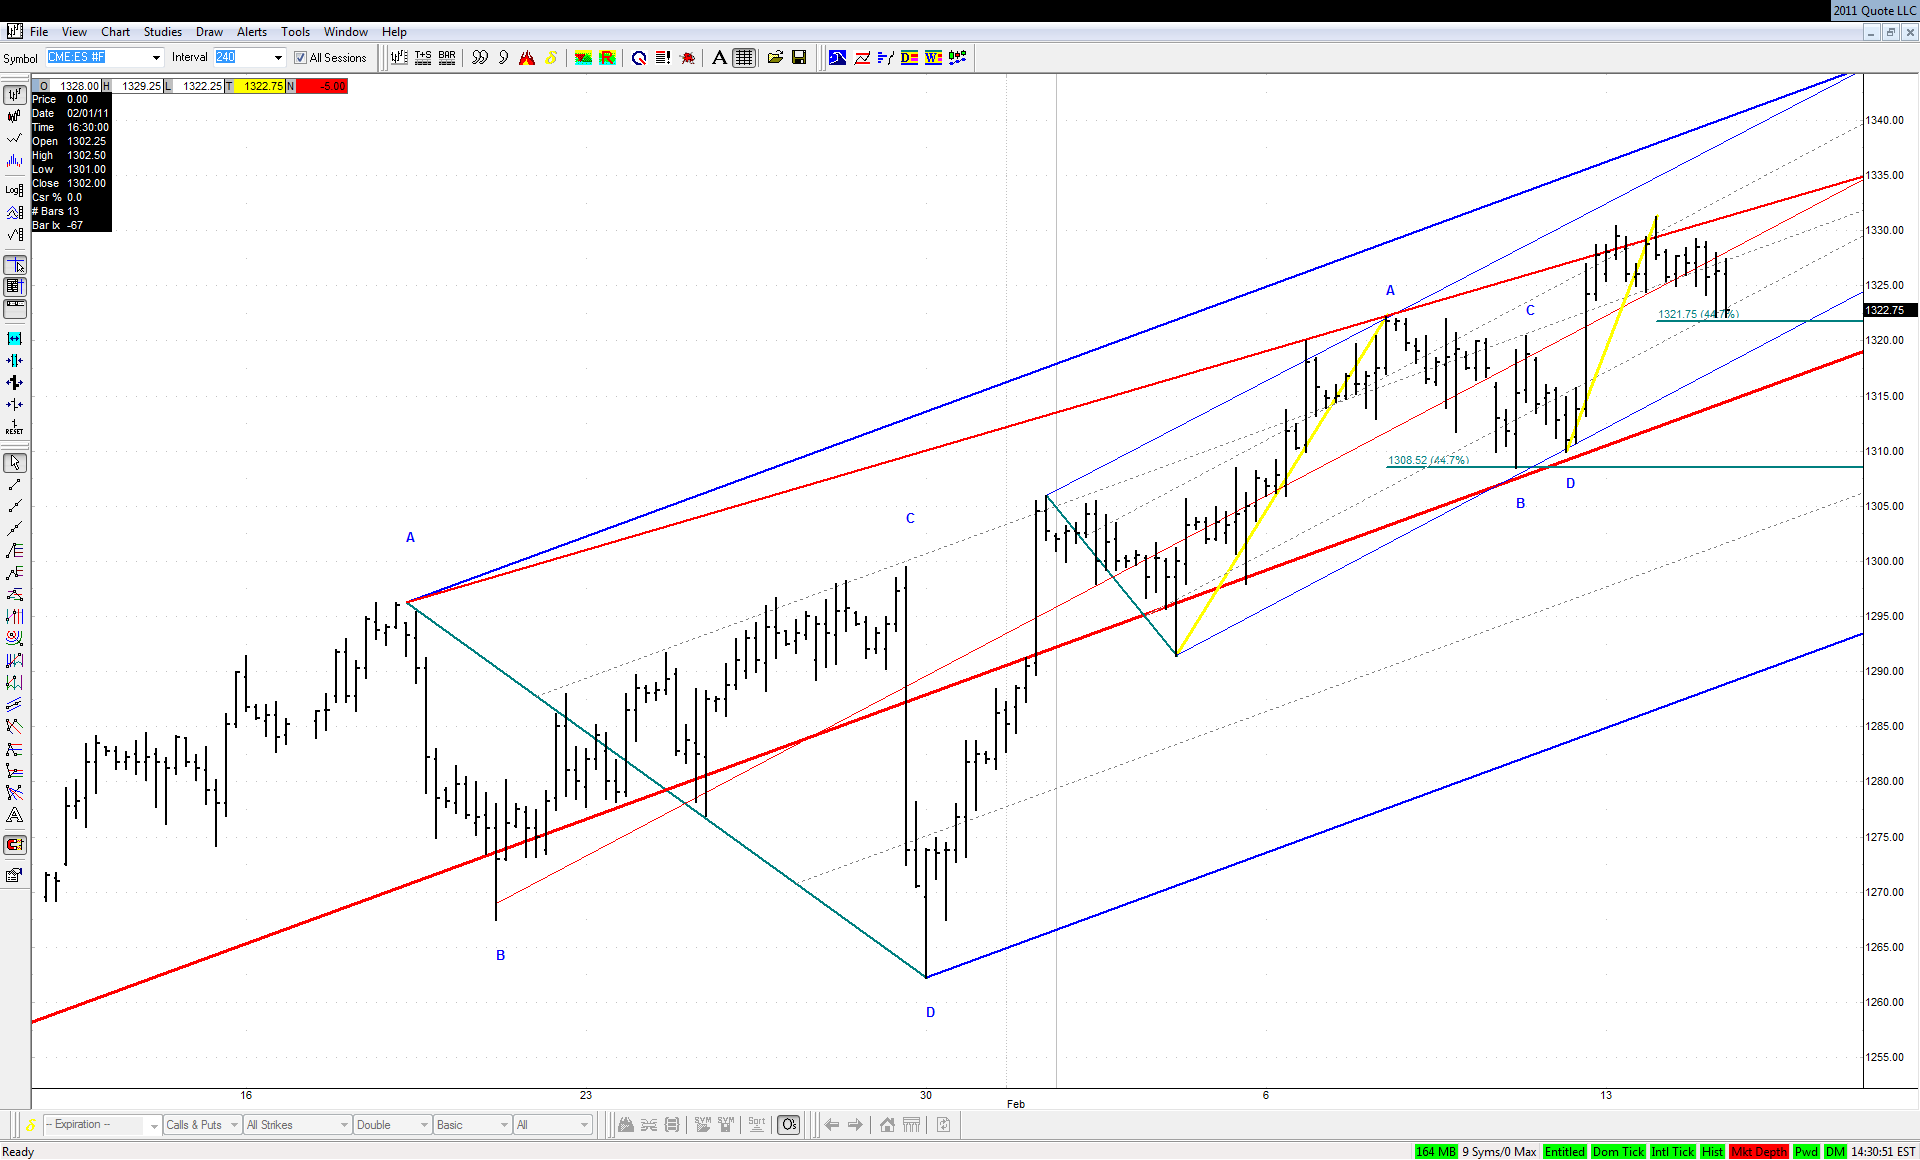
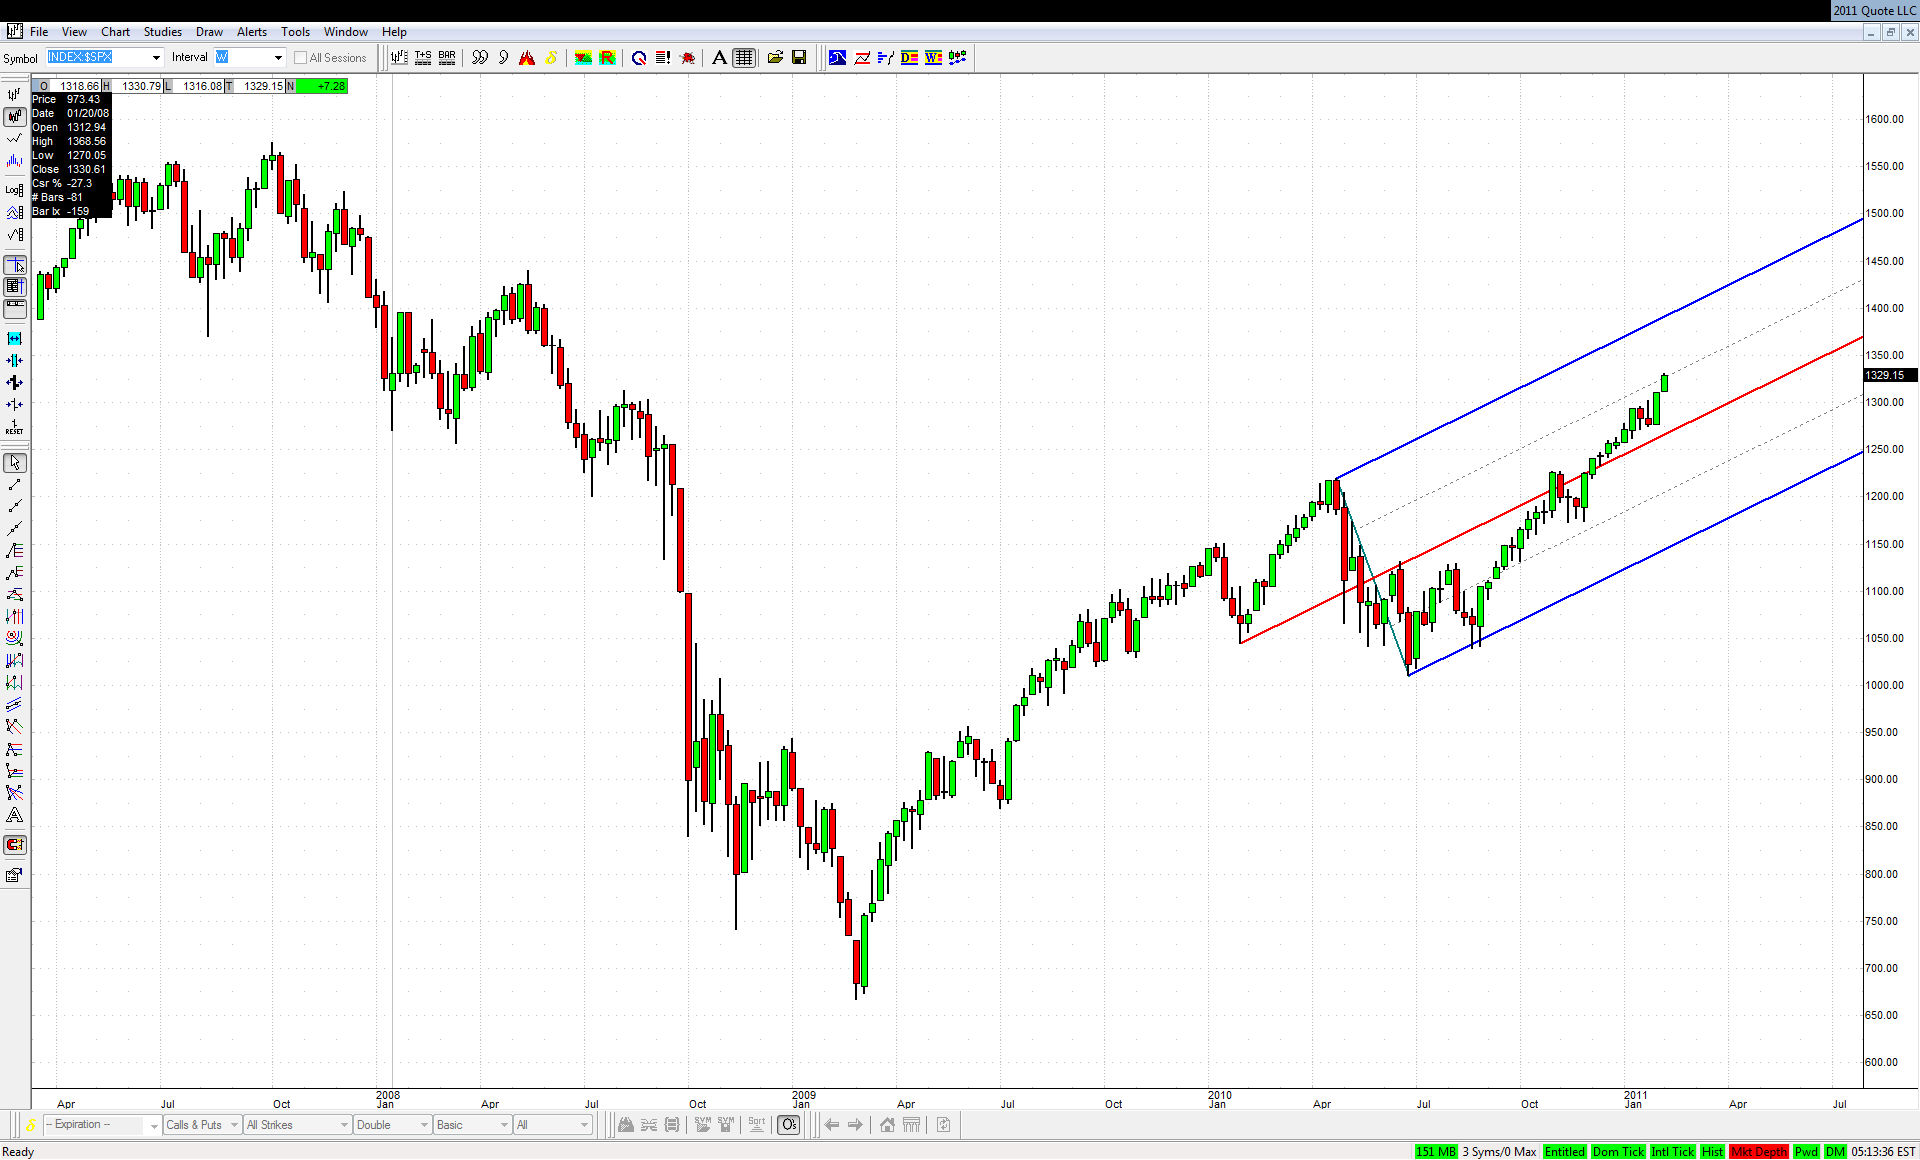
Is the move up that began on Friday a final acceleration to the 1330 area mentioned here couple of times? Or is it a start of something even bigger to the upside to finally convince everybody that this thing is never ever going to drop again? We'll have to wait to know the answer to this question. My personal opinion is closer to the second alternative, but of course I might be wrong. Some people say that the drop from May 2008 to the final 2009 bottom was an extended 5th wave. Such waves are usually fully retraced, and in such case the upper ML of the recent set needs to be met:


Click image for original size
JA
jarek
Rep: 94
Posts: 3,474
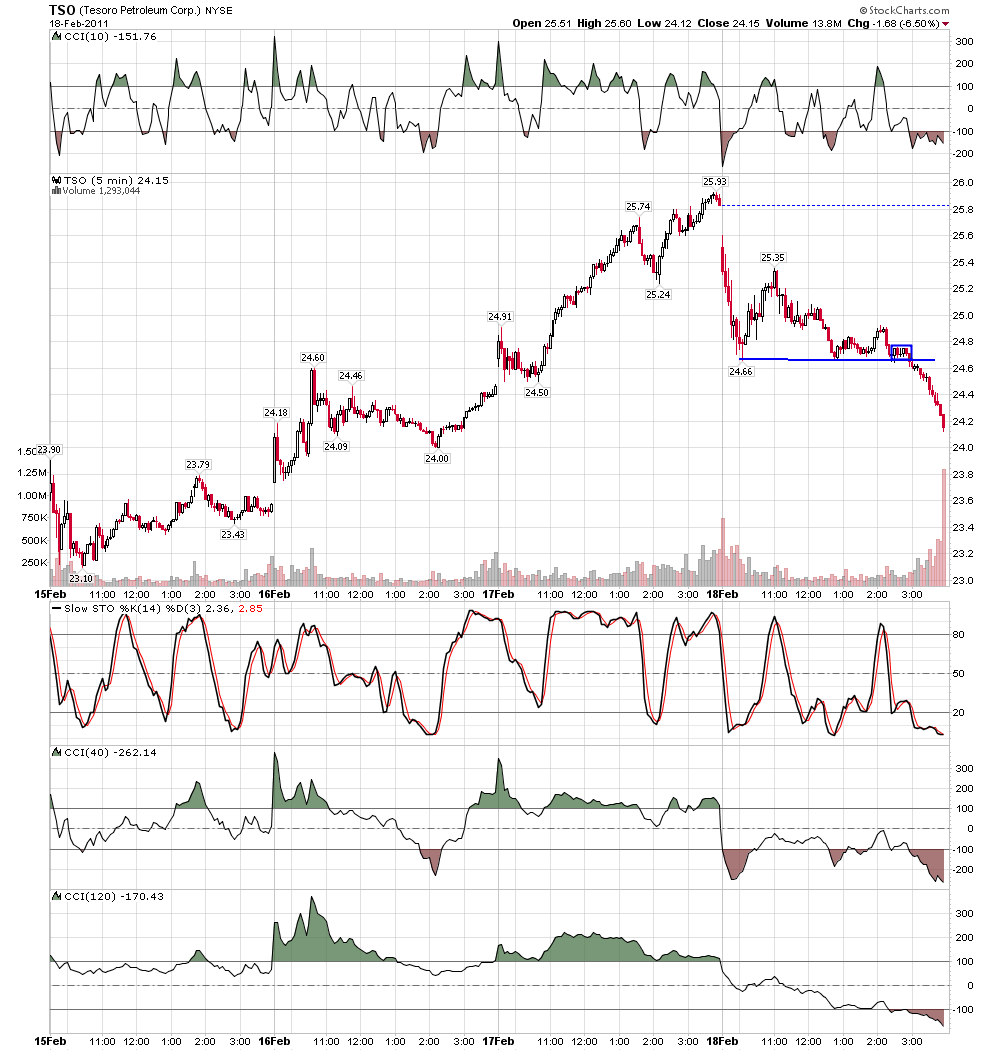
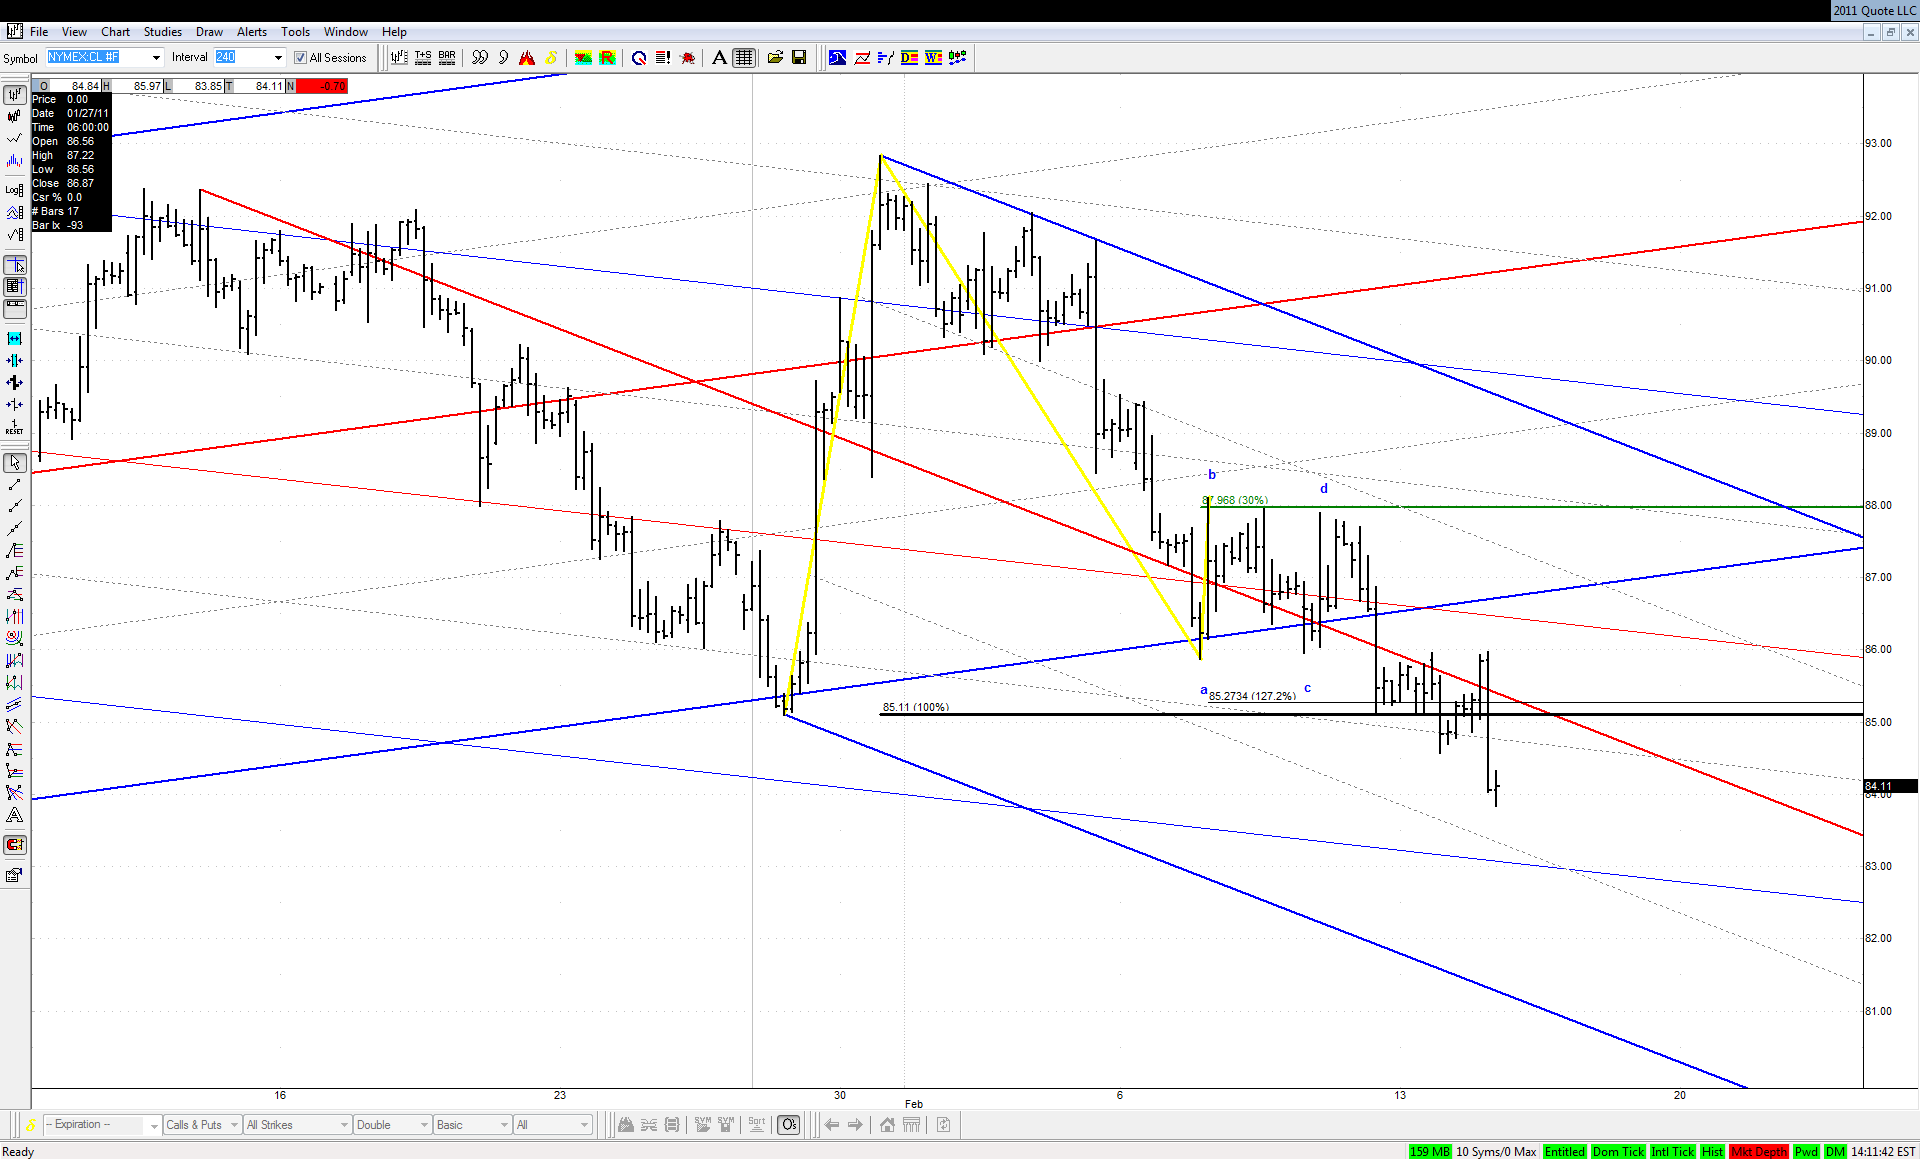
The journey towards lower ML has started in Crude:

Click image for original size
JI
jimkane
Rep: 3,058
Posts: 33,089
I'm leaning towards the latter.

Originally posted by jimkane

Time for this to turn, or time for roofer to get paid, big time.
JI
jimkane
Rep: 3,058
Posts: 33,089
This is interesting to watch. They are pushing this right to the 'meltdown' level, the level where if they don't stabilize it, they will lose control and, as roofer said, we get one of those monster down flushes. That's likely what they intend, I suspect. But, point is, they are teetering on that level in here, I think...
JI
jimkane
Rep: 3,058
Posts: 33,089
Nothing but air under 22.25. But, still watch for the trap and snap fakeout.
JA
jarek
Rep: 94
Posts: 3,474
On the higher timeframe it's still "business as usual" for bulls:

Click image for original size
JA
jarek
Rep: 94
Posts: 3,474
One has to admit that the line of least resistance is to the downside - it drops pretty easily and rises laboriously
JI
jimkane
Rep: 3,058
Posts: 33,089
Same old, same old.


Originally posted by jarek

One has to admit that the line of least resistance is to the downside - it drops pretty easily and rises laboriously
JI
jimkane
Rep: 3,058
Posts: 33,089
Rising strongly straight off my line and Fib area, right at the LOD level, as expected. They knew. Now we see if it sets a new high next, or rolls at the next expected area, and then they crush it.

For me, a lot of trading is taking the shots and then seeing what it does and acting accordingly. Most don't understand how little control we actually have over things (this is why, I suspect, most mathematicians, engineers, doctors, etc. fail at trading, they think in terms of absolutes, not probabilities). We can only control what we do. So, emphasis/focus in the 'Trading Plan' on what we do for every given situation that arises is critical.
JI
jimkane
Rep: 3,058
Posts: 33,089
26.00 was that next level, for sure. Now we see the intentions.
JA
jarek
Rep: 94
Posts: 3,474
Originally posted by jimkane

26.00 was that next level...


Was there something more than the Kane Zone of the whole drop?
RO
roofer
Rep: 3,689
Posts: 3,574
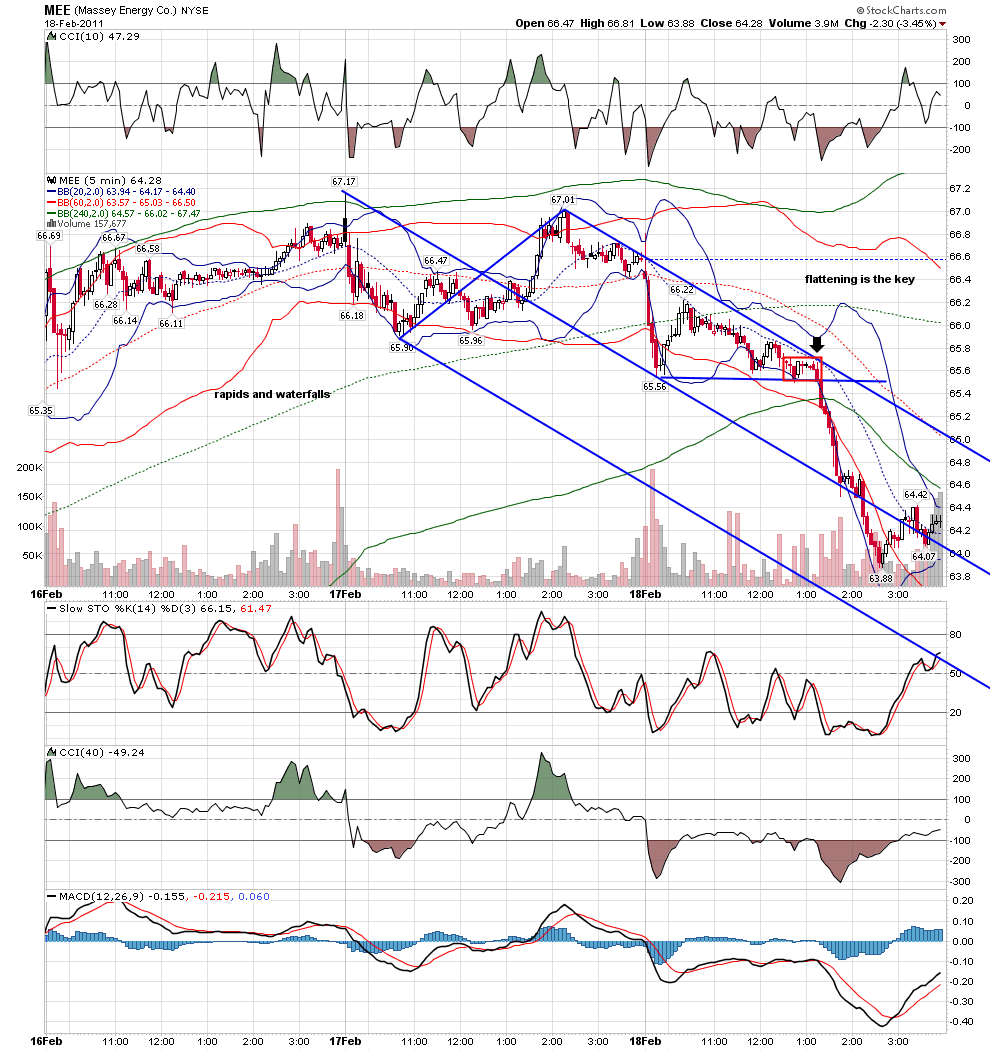
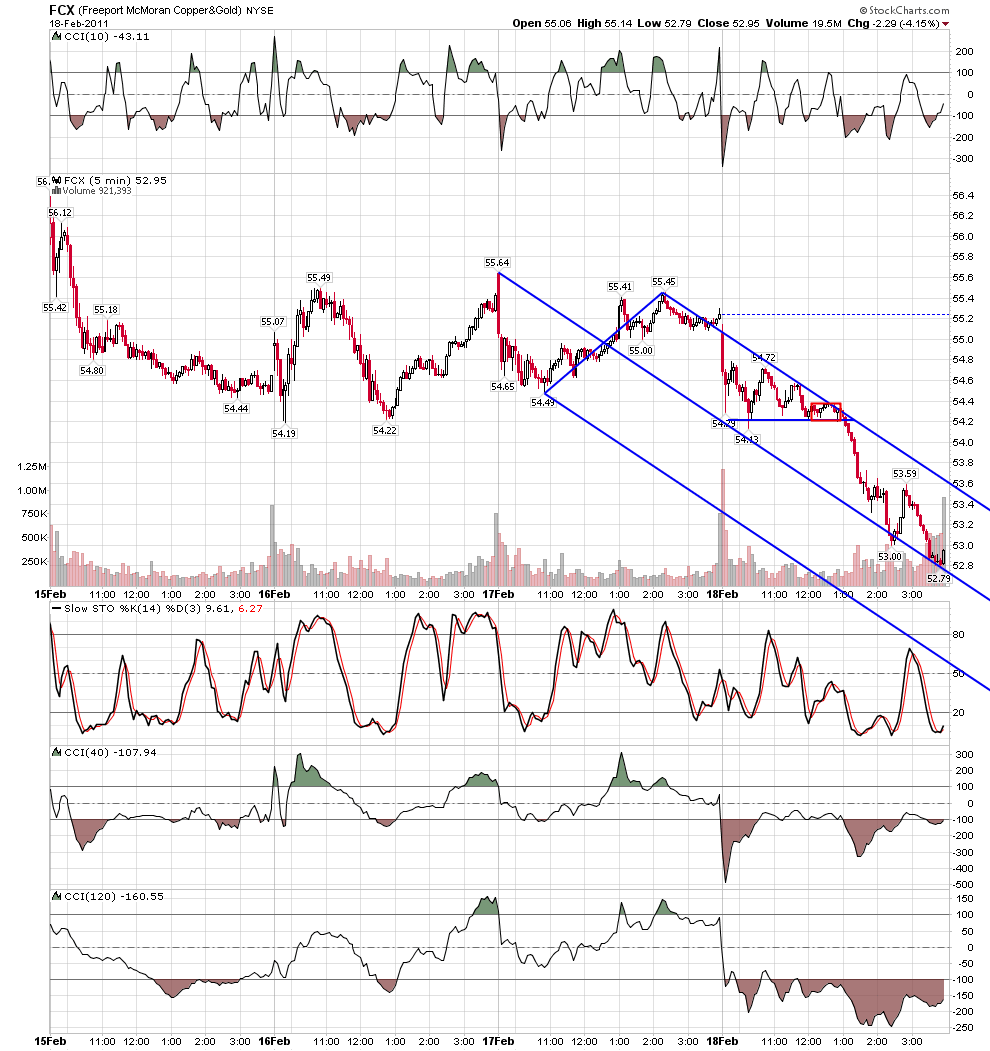
rat 89 will remember this one....it is a rare day when i will short into oversold.... but the pattern repeats over and over.....rapids and waterfall... the key is the flattening right before price goes..under the cover of opex, the computers were using the patterns to get price to the correct strike.... something else.... i feel a wave four triangle of some degree just ahead... the down in many stocks can be seen as the ab leg of abcd's that i think the c will setup just as the triangle leg is set to go....
Click image for original size

Click image for original size

Click image for original size