MyPivots
Sign In
JA
jarek
Rep: 94
Posts: 3,474
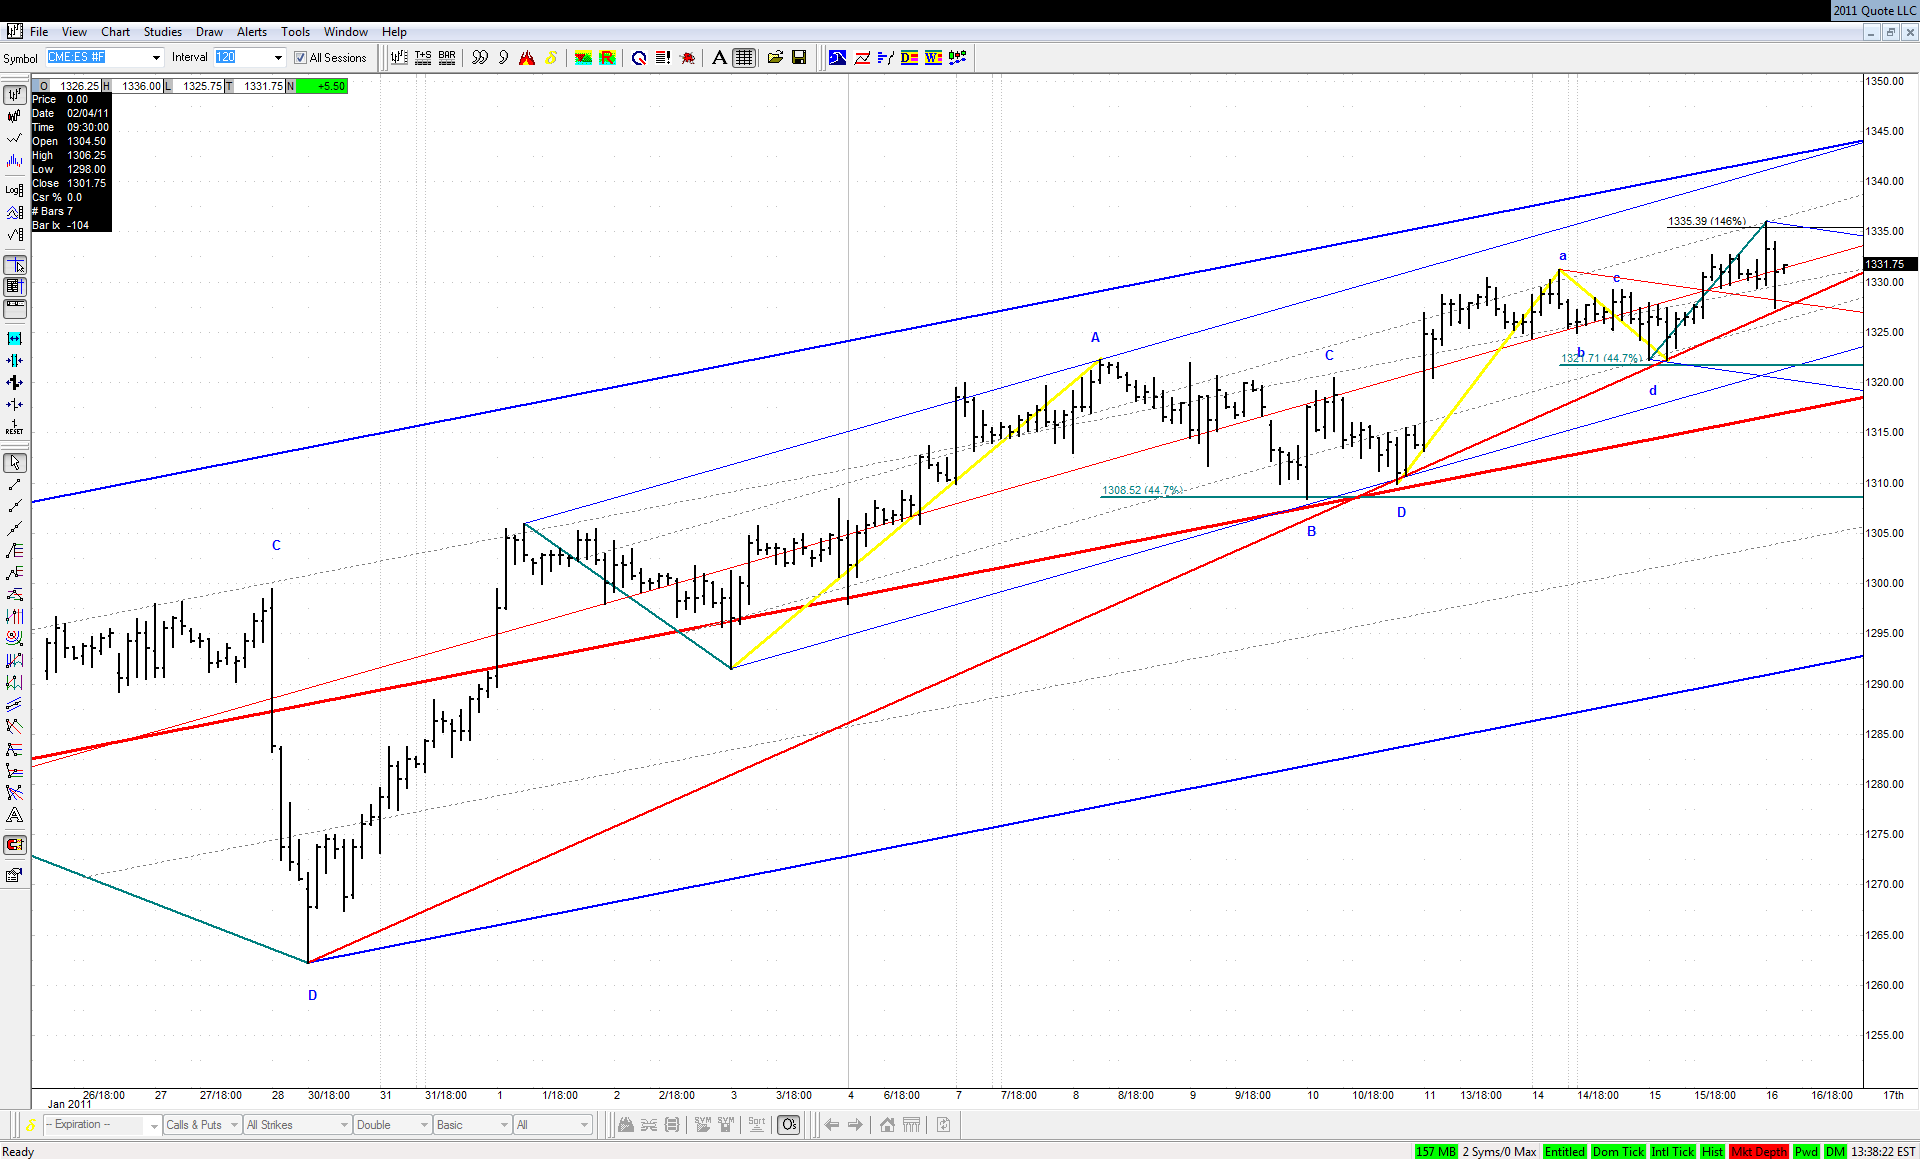
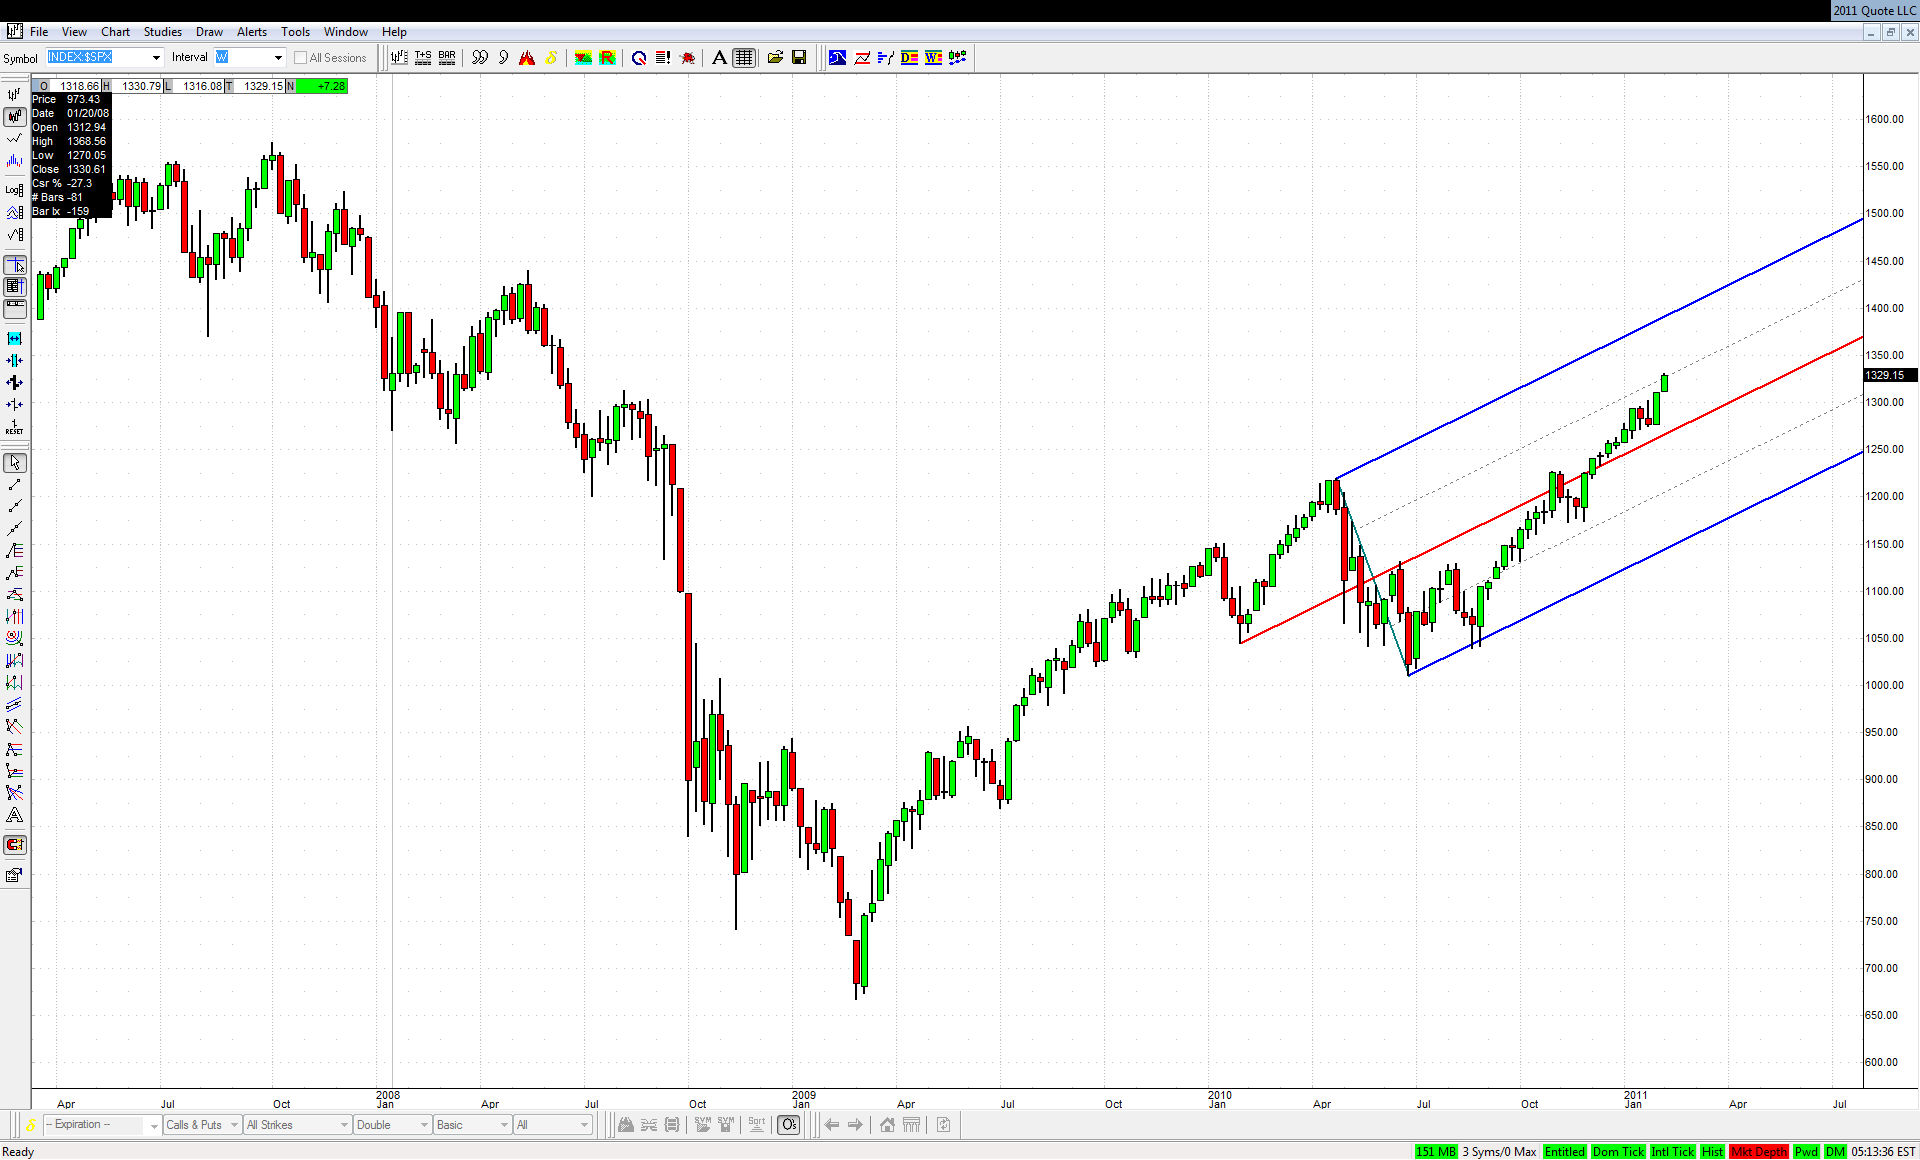
Is the move up that began on Friday a final acceleration to the 1330 area mentioned here couple of times? Or is it a start of something even bigger to the upside to finally convince everybody that this thing is never ever going to drop again? We'll have to wait to know the answer to this question. My personal opinion is closer to the second alternative, but of course I might be wrong. Some people say that the drop from May 2008 to the final 2009 bottom was an extended 5th wave. Such waves are usually fully retraced, and in such case the upper ML of the recent set needs to be met:


Click image for original size
JA
jarek
Rep: 94
Posts: 3,474
Once they decide to move away from this December bottom support/resistance in Bonds, the move should be long and sustainable:


Click image for original size
JA
jarek
Rep: 94
Posts: 3,474
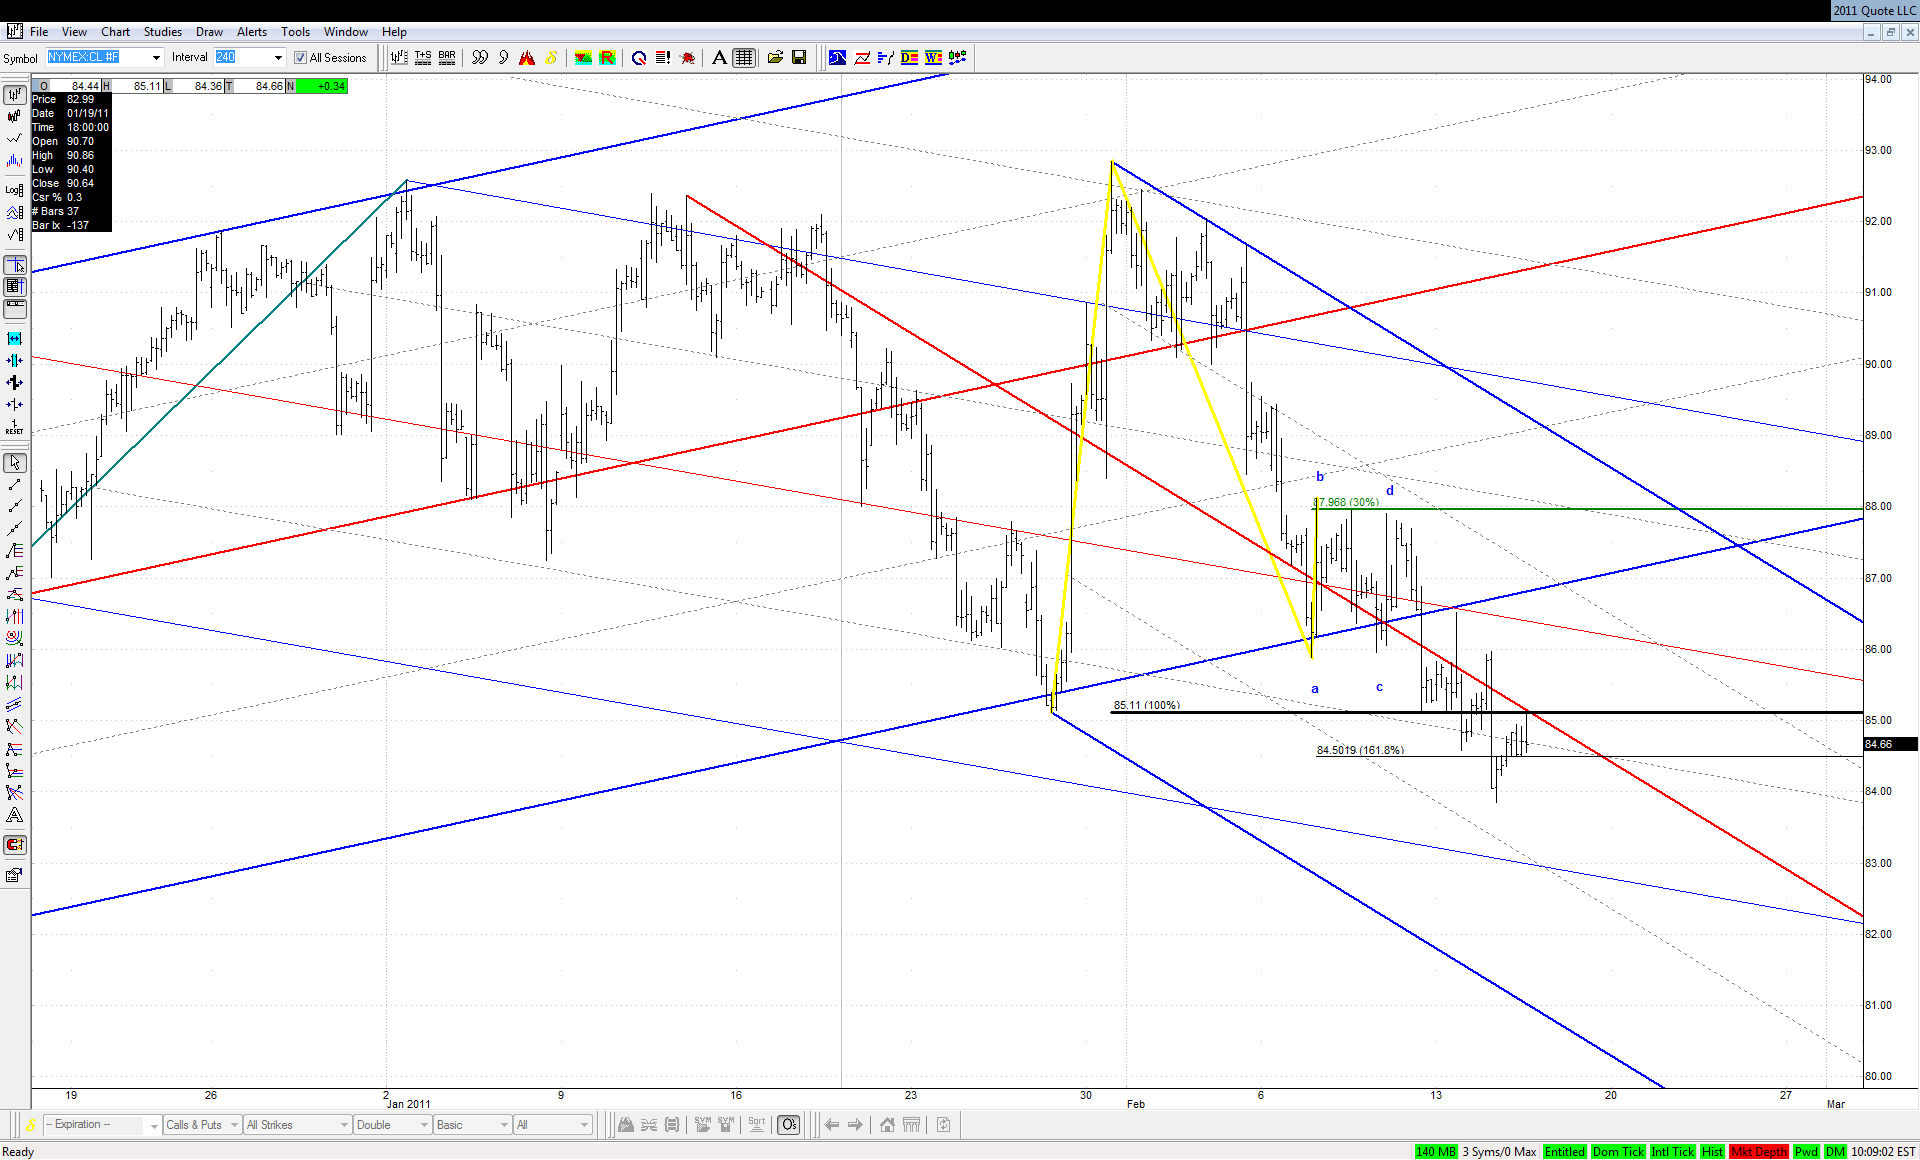
The length of the drop in Crude suggest that this bearish ABCD was not a W4:

Click image for original size


It found nice resistance today at last bottom and major ML
JA
jarek
Rep: 94
Posts: 3,474
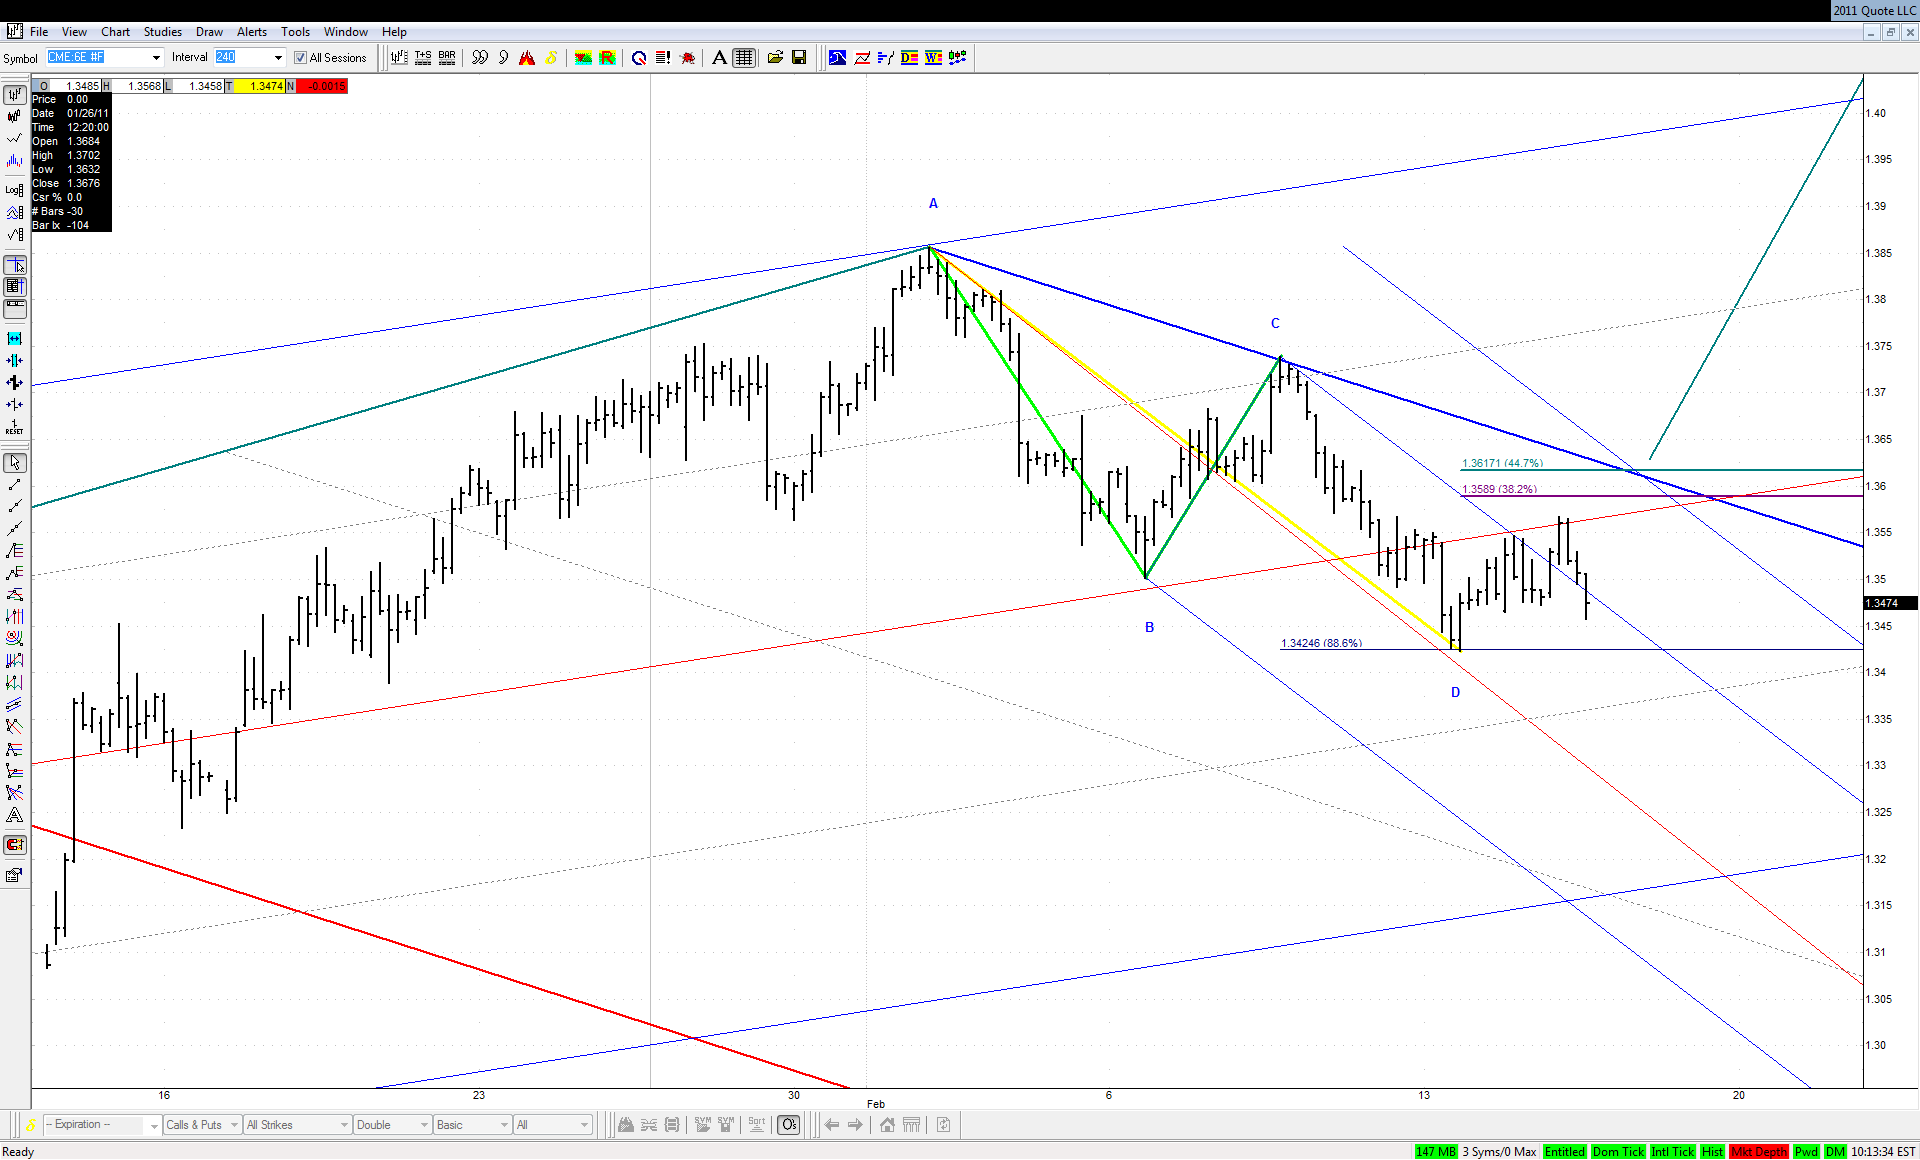
EUR saw Ixon's bullish ABCD, but the move off it doesn't look convincing so far:

Click image for original size


Will bulls manage to get to this nice spot in a small ABCD fashion?
JA
jarek
Rep: 94
Posts: 3,474
Life is so much easier on the long side these days...

Click image for original size
AL
albert
Rep: 99
Posts: 3,094
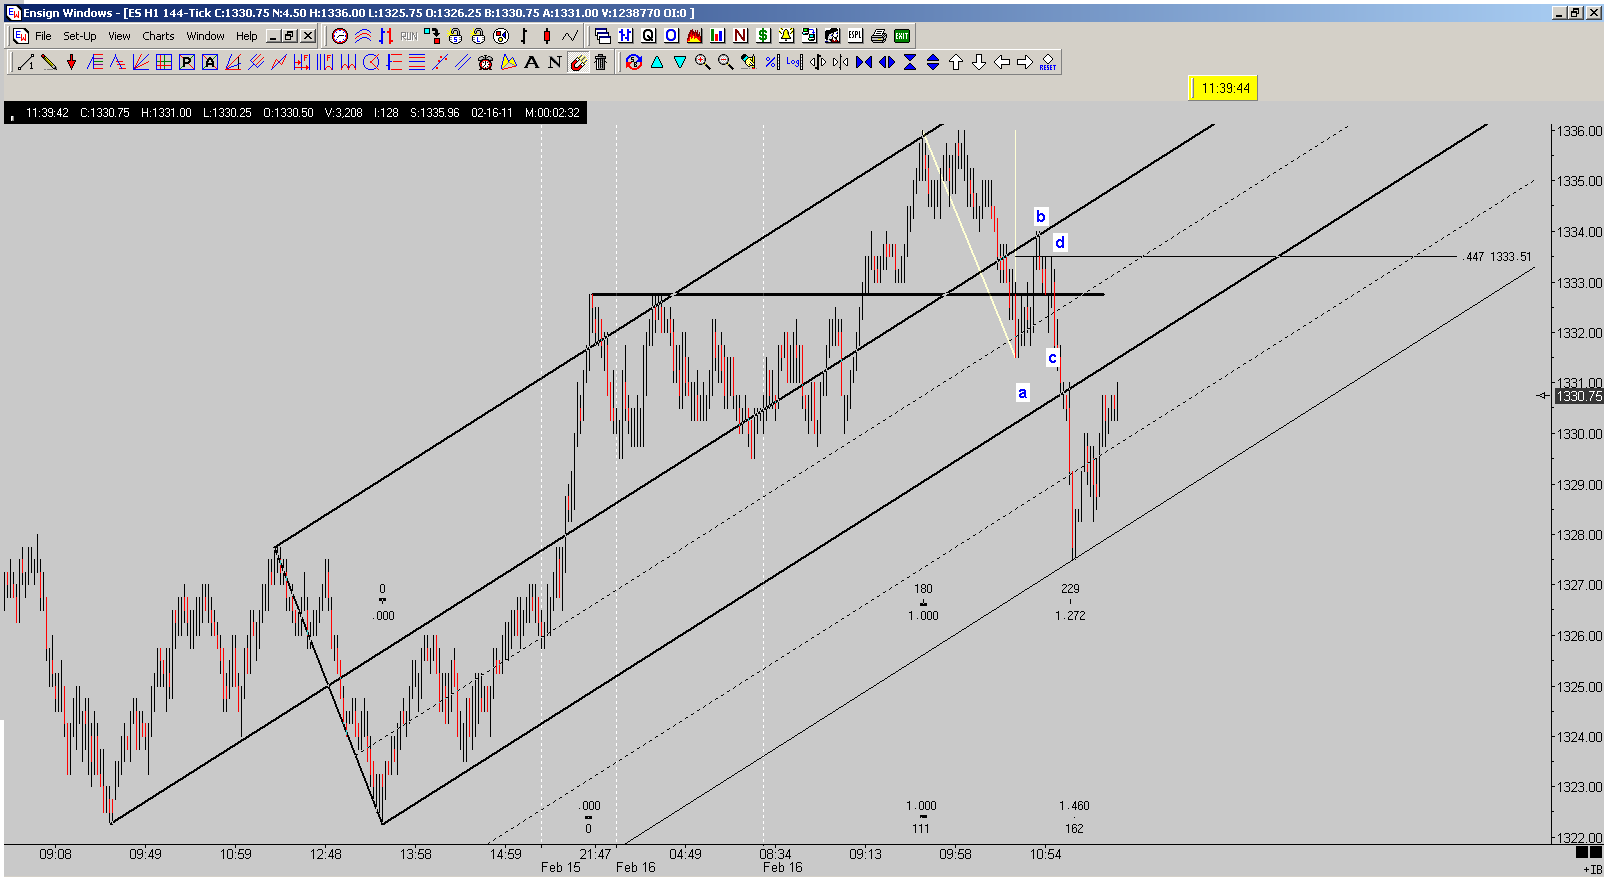
Kane 4 PCP ABCD completing at 0.447 fibo, and touching two lines, ML from set based on yesterday's LOD, and horizontal line drawn at GLOBEX Hi. Downward price action from that Kane ABCD is pretty "crisp", IMHO.

Al Kamego
Click image for original size
JA
jarek
Rep: 94
Posts: 3,474
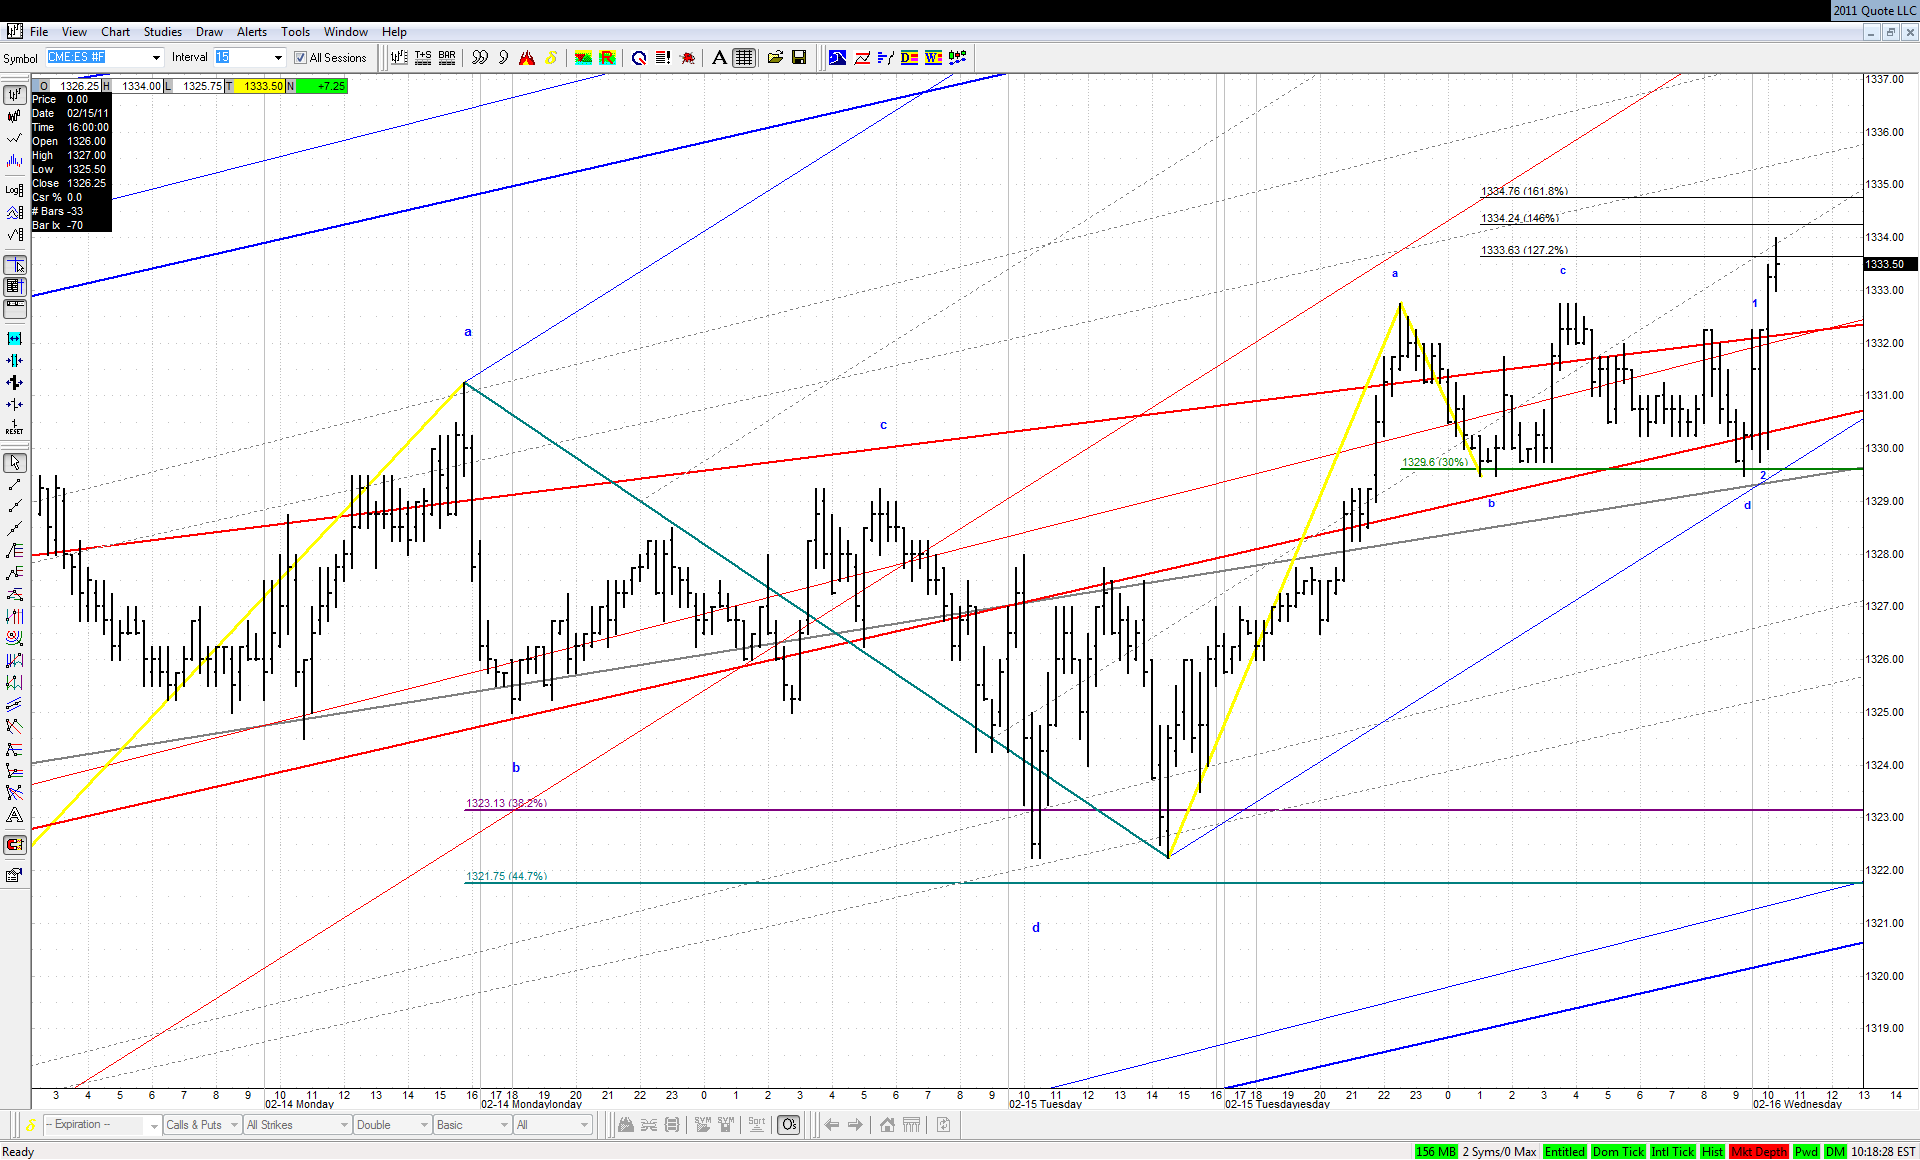
So it went to the typical target off the last KZ ABCD, corrected right to the TL and tries to rise again off it:

Click image for original size


So far so good for the bull
JI
jimkane
Rep: 3,058
Posts: 33,089
So, what are the odds the market doesn't explode to new highs on the imminent Fed minutes report, especially when they see they don't indicate any slowdown or early termination of QE2, and read between the lines at the small hints for QE3?
JI
jimkane
Rep: 3,058
Posts: 33,089
Not that this shouldn't all be priced in already, being at even yet another new 'bulls#%&' market high since my last post...

BTW, great charts, jarek, and everyone.
JI
jimkane
Rep: 3,058
Posts: 33,089
Point is, it is way overextended and due for a pullback. It's sitting right at my key line here. It should go down. But, the machines run the world, and they have only one goal. Higher prices.
JI
jimkane
Rep: 3,058
Posts: 33,089
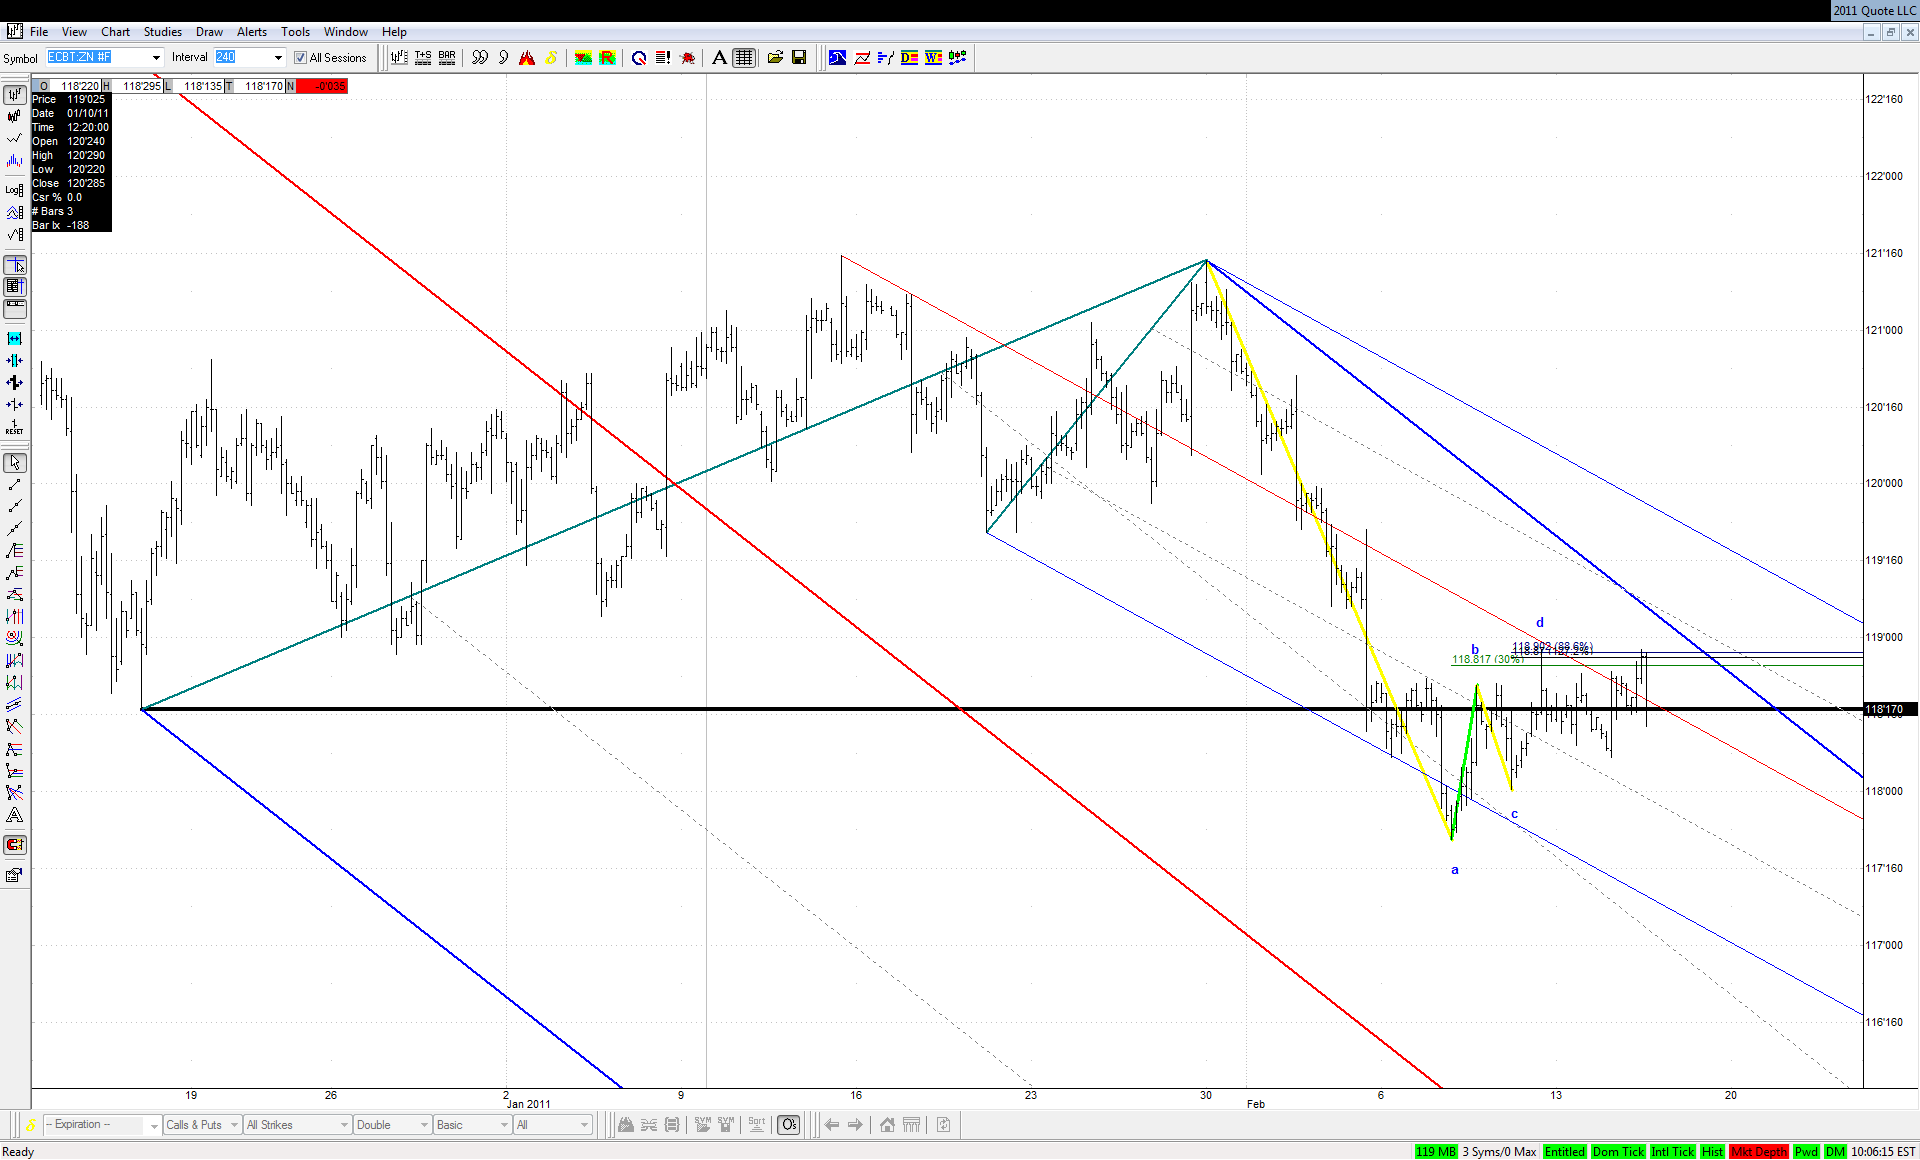
Oops, dumb a#%. I wasn't paying attention to the time, they had already released the minutes at this point, with no real reaction. Pardon my brain fade, trying to keep track of too many things at once. Anyway, they didn't explode up, how curious, if anything it put a slight downward pressure on things. I guess they are looking to get better prices after the big new high, as usual. Watch here in case this is a CD leg forming for an ABCD.


Originally posted by jimkane

So, what are the odds the market doesn't explode to new highs on the imminent Fed minutes report, especially when they see they don't indicate any slowdown or early termination of QE2, and read between the lines at the small hints for QE3?
RO
roofer
Rep: 3,689
Posts: 3,574
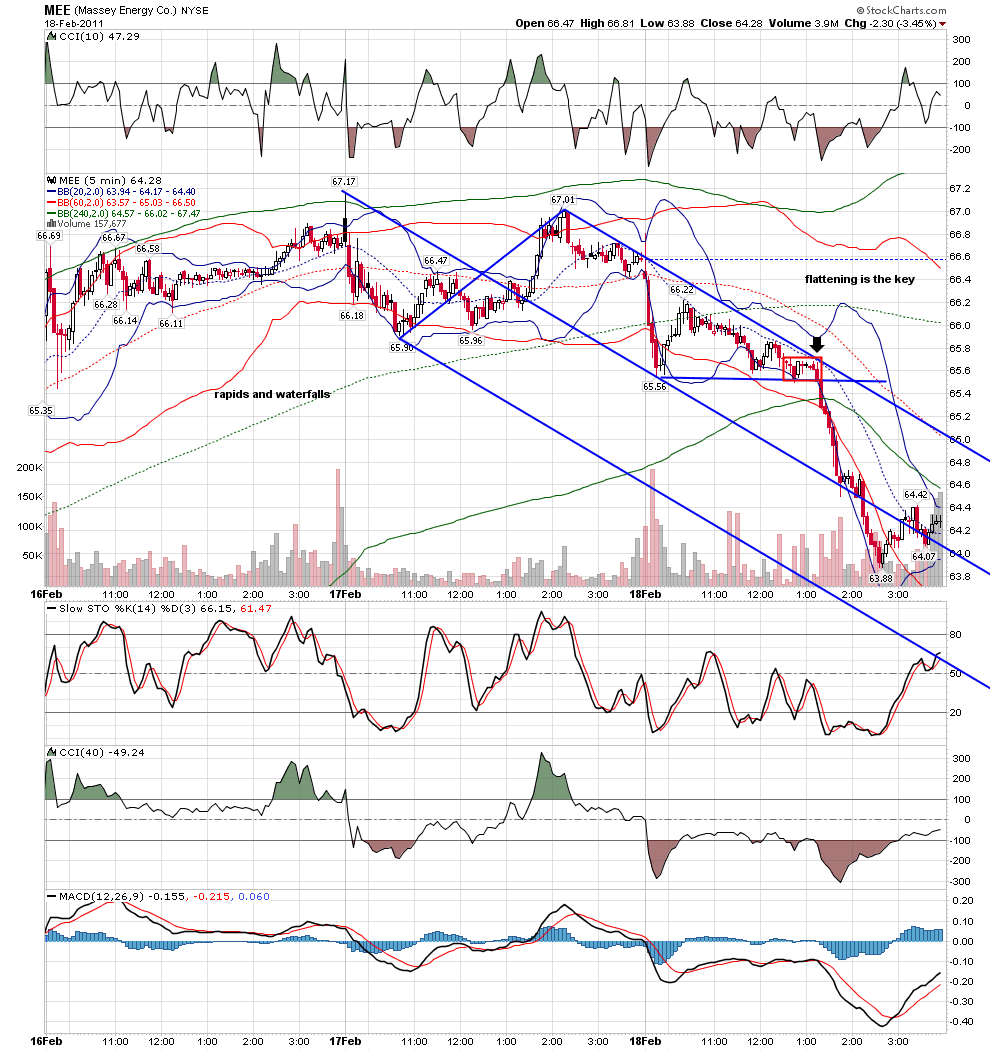
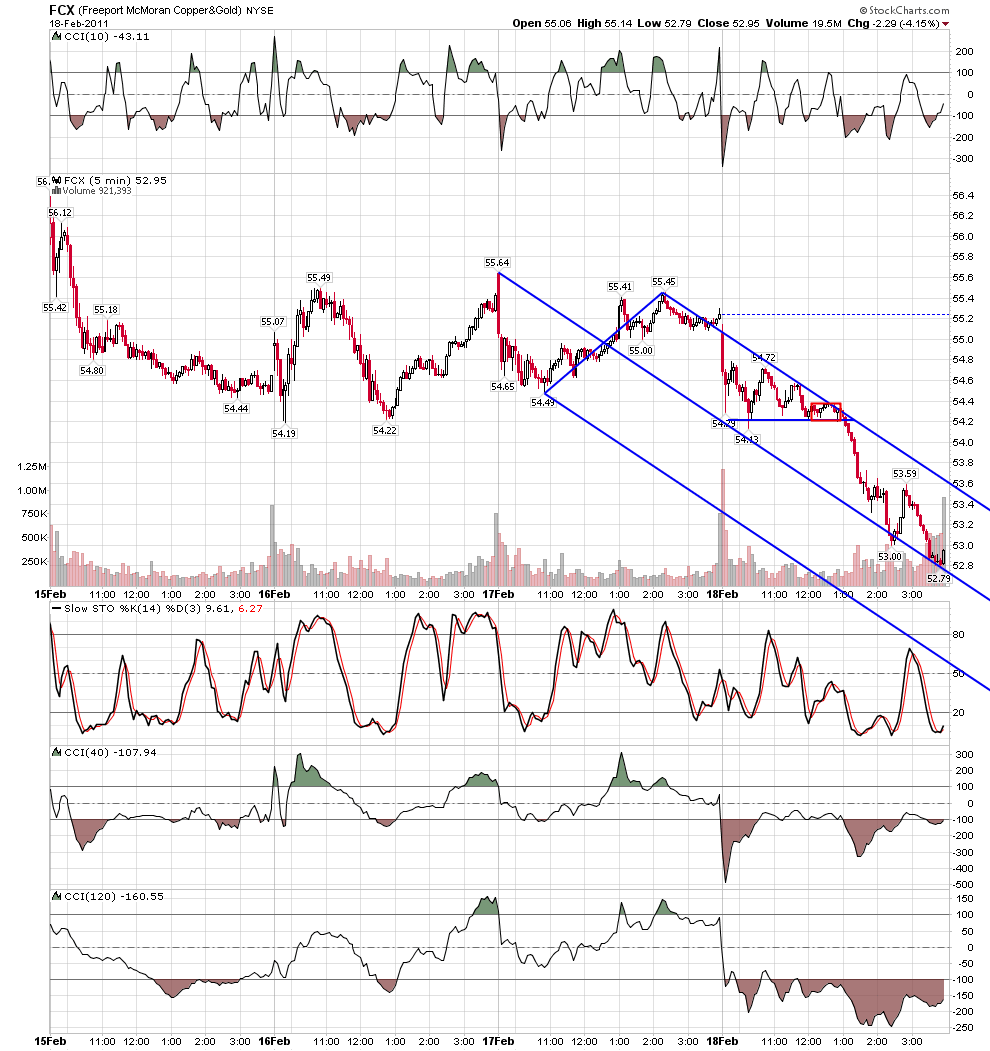
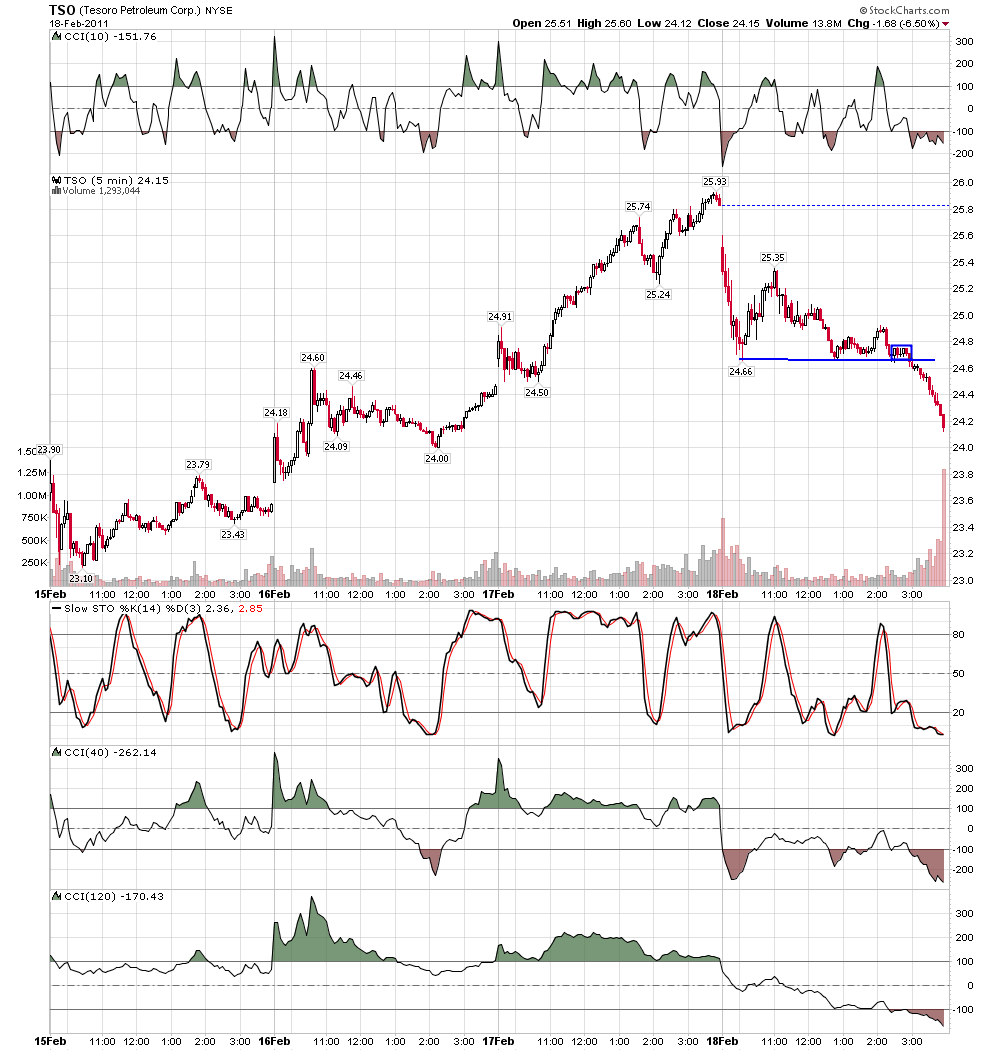
rat 89 will remember this one....it is a rare day when i will short into oversold.... but the pattern repeats over and over.....rapids and waterfall... the key is the flattening right before price goes..under the cover of opex, the computers were using the patterns to get price to the correct strike.... something else.... i feel a wave four triangle of some degree just ahead... the down in many stocks can be seen as the ab leg of abcd's that i think the c will setup just as the triangle leg is set to go....
Click image for original size

Click image for original size

Click image for original size