ES key number for 3-10-11
1300 - 1302
1306.75 - 1308.25
1313.50
1321
Watch to see if we are outside yesterdays range and then we get a 30 minute close back above YD lows and the LOWEST 30 minute close of YD
1306.75 - 1308.25
1313.50
1321
Watch to see if we are outside yesterdays range and then we get a 30 minute close back above YD lows and the LOWEST 30 minute close of YD
they don't usually just blow thorugh a key number 1300 without a retest...they suck in the shorts and then bring it back up to it...perhaps they sucked me in...volume diminishing on each push down now...
air still above...but I agree with ya....high risk down here..a bracket breakout so far!!
air still above...but I agree with ya....high risk down here..a bracket breakout so far!!
flat at 1301.25 on all but one contract......trade back to 98.75 will stop this out....last target is the O/N low.....key zone in here
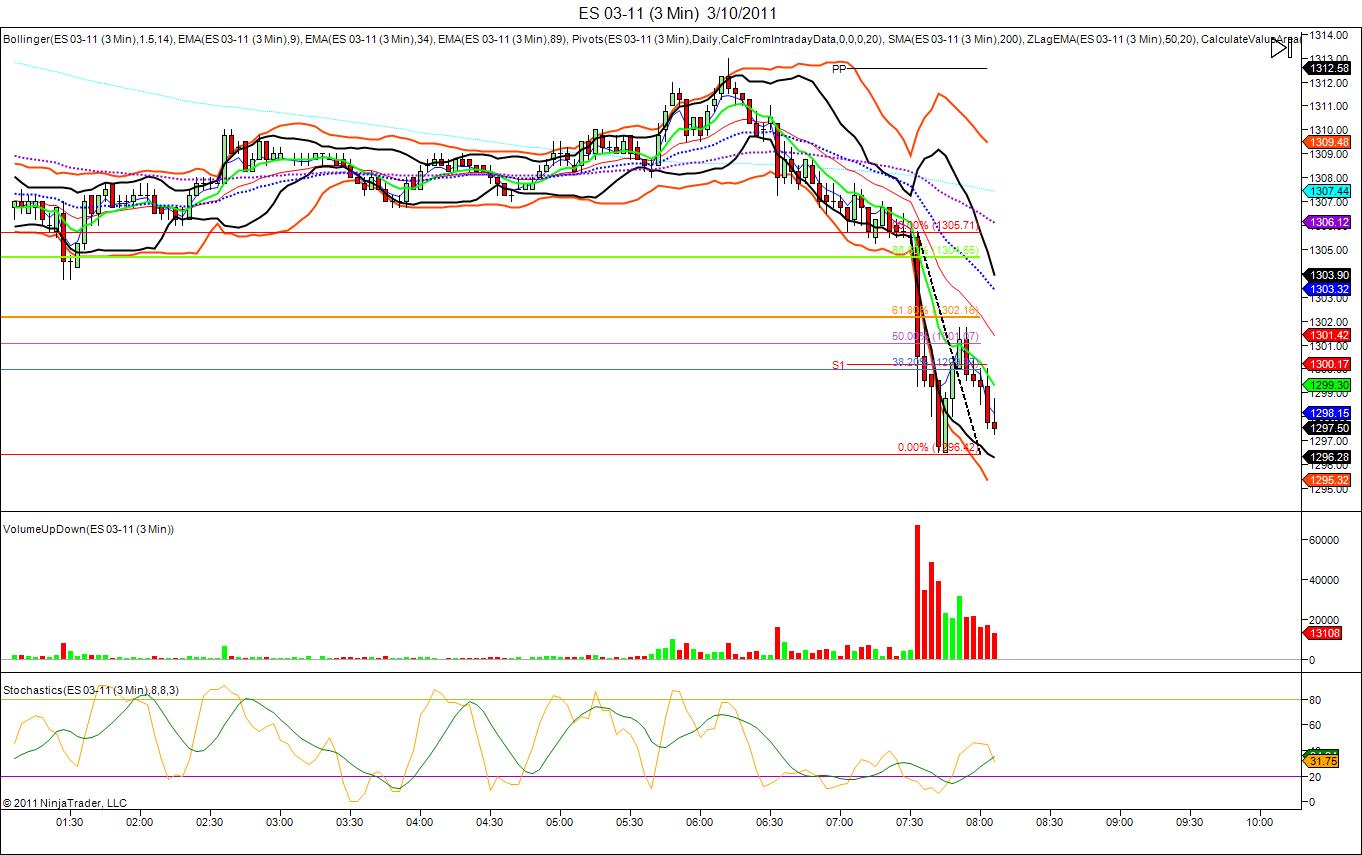
for anyone interested in the volume look at the first three 5 minute bars.......lower volume on each lower low....telling me that selling was POSSIBLY winding down...in other words the lower lows were not atrracting fresh participation on the short side
Originally posted by BruceM
for anyone interested in the volume look at the first three 5 minute bars.......lower volume on each lower low....telling me that selling was POSSIBLY winding down...in other words the lower lows were not atrracting fresh participation on the short side
that seems pretty obvious and ive looked at correlations of diminishing volume with price moves...gotta say though ive never managed to find any useful correlation that predicts a move is weakening because of diminishing volume or strengthening because of increasing volume. ive looked into this many times, though not in great detail.
maybe i didnt look hard enough?
Got off a couple shorts in the March on that initial break. While the market drifts around the lows / key support level I went ahead and rolled over to June, a little early for me but the volume is there. Floor is already trading June in the bigs.
ES/ cash SPX did hold this first touch of key support on the daily chart. Dow is down 200. My concern here is does this daily support hold or give way and volume surge in on the other side of support and we end up with Dow down something like 500 on the day. I would rather miss a fade than get caught on the wrong side of something like that.
ES/ cash SPX did hold this first touch of key support on the daily chart. Dow is down 200. My concern here is does this daily support hold or give way and volume surge in on the other side of support and we end up with Dow down something like 500 on the day. I would rather miss a fade than get caught on the wrong side of something like that.
3 minute chart shows the diminishing selling volume was simply a pullback and not exhaustion selling. that's my opinion and how i traded it anyway.
Click image for original size
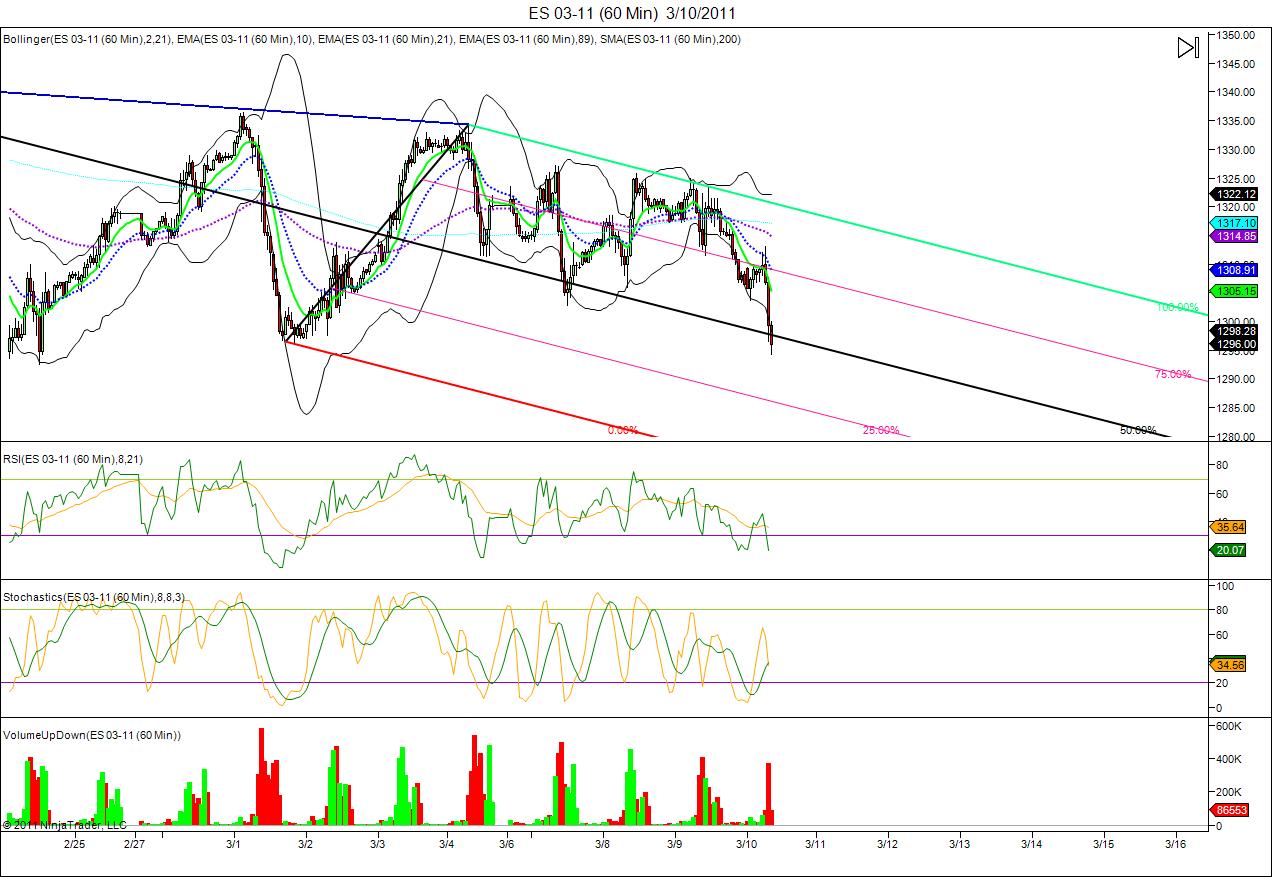
my 1 hour chart shows we can head much lower if we get a breakout bar to the down side at 1297-1298 , i would be looking for it to go to 1288 maybe?
Click image for original size
long and small at 95.50...
2 off at 97.50...trying to hold two
I suggest you filter looking for this concept two ways Feng and that is 1) the time of day
2) what happens when we break a KEY prices
Today we broke through 1300 on big volume and then the dry up came underneath it...that is the critical point
Looking for volume divergences at just some random place is a losing game IMHO....it's where they happen that matters
2) what happens when we break a KEY prices
Today we broke through 1300 on big volume and then the dry up came underneath it...that is the critical point
Looking for volume divergences at just some random place is a losing game IMHO....it's where they happen that matters
Originally posted by feng456
Originally posted by BruceM
for anyone interested in the volume look at the first three 5 minute bars.......lower volume on each lower low....telling me that selling was POSSIBLY winding down...in other words the lower lows were not atrracting fresh participation on the short side
that seems pretty obvious and ive looked at correlations of diminishing volume with price moves...gotta say though ive never managed to find any useful correlation that predicts a move is weakening because of diminishing volume or strengthening because of increasing volume. ive looked into this many times, though not in great detail.
maybe i didnt look hard enough?
great call optimus !
Emini Day Trading /
Daily Notes /
Forecast /
Economic Events /
Search /
Terms and Conditions /
Disclaimer /
Books /
Online Books /
Site Map /
Contact /
Privacy Policy /
Links /
About /
Day Trading Forum /
Investment Calculators /
Pivot Point Calculator /
Market Profile Generator /
Fibonacci Calculator /
Mailing List /
Advertise Here /
Articles /
Financial Terms /
Brokers /
Software /
Holidays /
Stock Split Calendar /
Mortgage Calculator /
Donate
Copyright © 2004-2023, MyPivots. All rights reserved.
Copyright © 2004-2023, MyPivots. All rights reserved.