ES 03-23-2011
Good morning all. Just a few thoughts I wanted to share. We have a unique situation here with at least two of the best traders you will find anywhere Kool and Bruce along with a number of others ( sorry for not mentioning all} sharing their thoughts thru out the day. They give price levels and reasons prior to making a trade. This is the most valuable assist a trader like myself can have. No I do not attempt to blindly piggyback their trades but knowing what price level they are interested in and why sure helps me. So that makes up the proticall here. Pls feel free to post but do it before the trade and say why.
[Admin edit - removed off-topic material]
[Admin edit - removed off-topic material]
Originally posted by koolbluebut what im sure everyone will overlook today is this decline is likely to be a SUPREME longer term buying opportunity for new highs ,mostlikely early April!
Originally posted by Lisa PThx Lisa, all the signs were there... small range yesterday, the lagging Nasdaq, and overbought nature of the markets(cumulative ticks), also all the small speculators unloading their shorts (from th cot reports)
Great trade, Kool. WTG
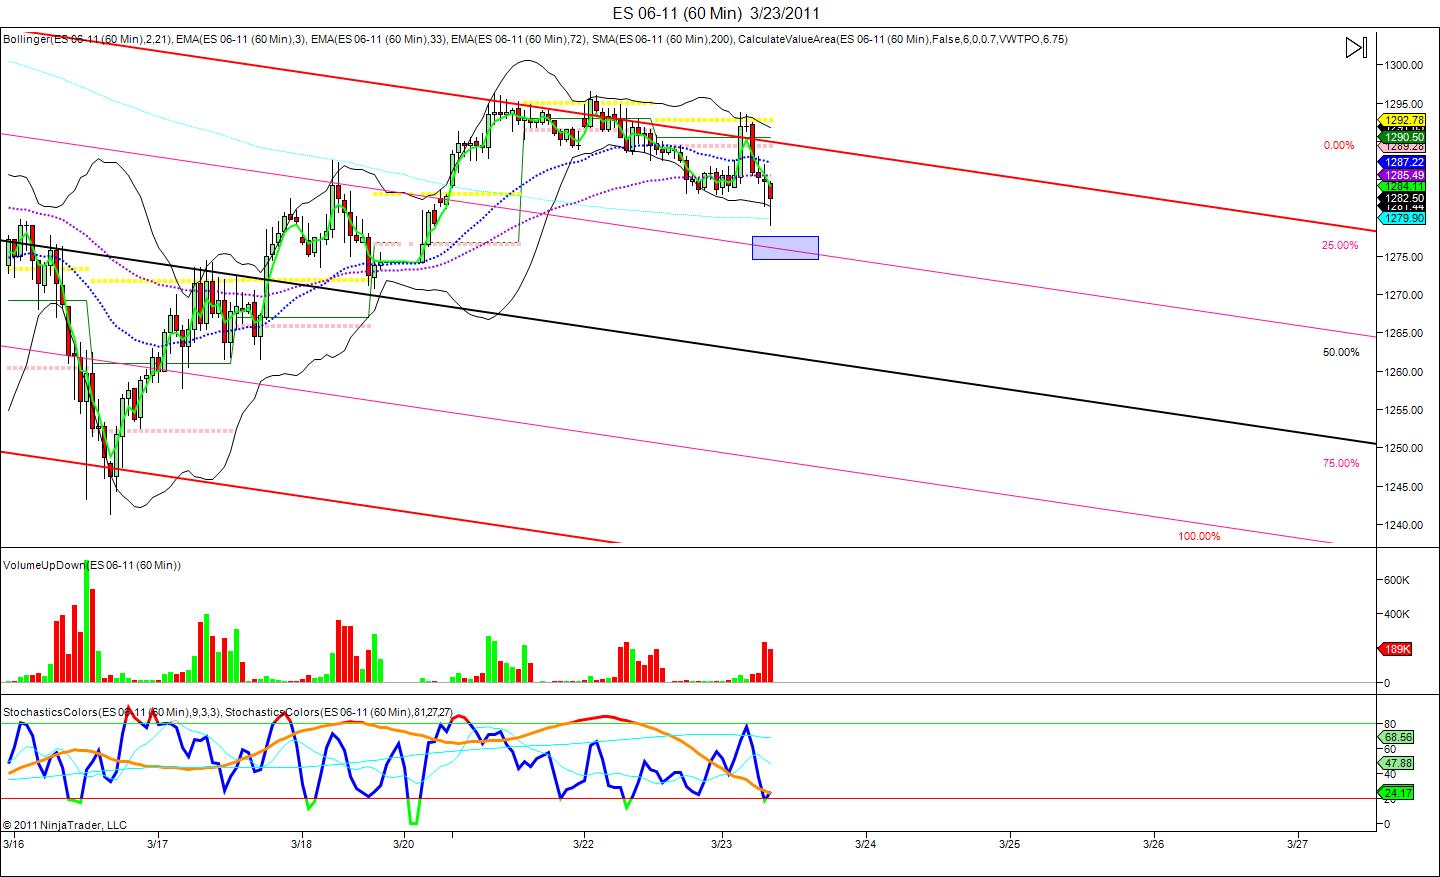
i am looking to buy at the 74 level but the cyan 200 MA on my 60 min chart is going to be tough to break though. IF we can get to the 74 level i am long term bullish to 1320. that's how i am playing it for now and trading scalps in the short term
Click image for original size
that was a great short kool...i missed the long from 79.5 (was trying to potty train my 2-year old !) which had a few things going for it...not only was the 1m projection down there but also there was volume dvg on both 1m and 5m charts...and ticks were showing a dvg too at that time...
Originally posted by apk781Yeah, i kinda wish i had taken that long too! Just happenned to quick after my trade exit and i was trying to post! Thats what makes posting and trading suck so much!..But im trying to show newer folk how ANYONE can use Kools tools (and other techniques) to enhance their own methods!..
that was a great short kool...i missed the long from 79.5 (was trying to potty train my 2-year old !) which had a few things going for it...not only was the 1m projection down there but also there was volume dvg on both 1m and 5m charts...and ticks were showing a dvg too at that time...
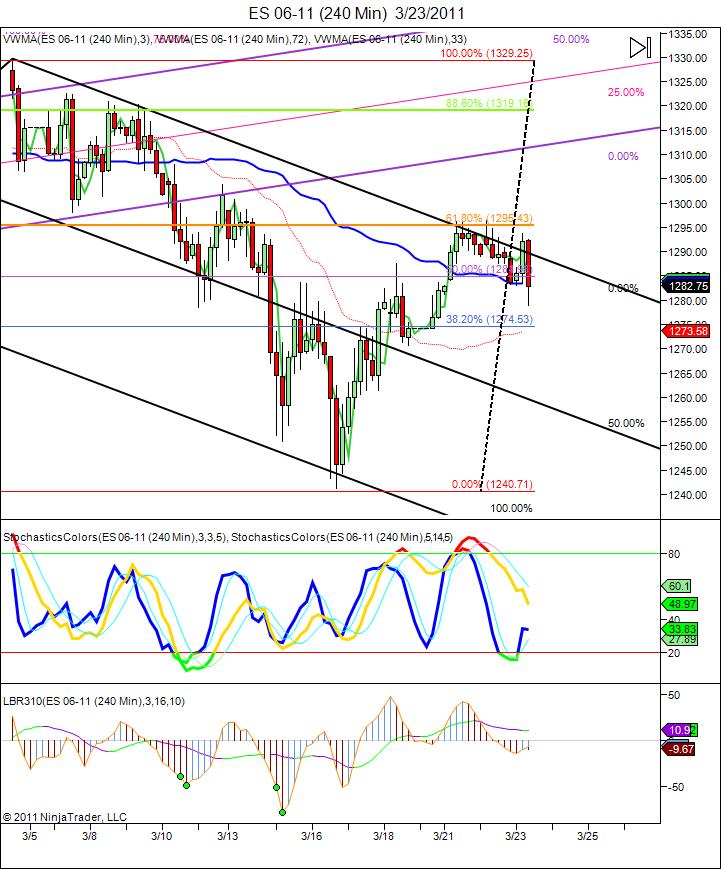
personally, i think this carries to 1261 or 1255 over the next day or so, before all is said and done.. but thats just a guess!
Watching retest of that level 1279.50-79.75 from caption I posted before
it's a good guess Kool... my long term 240 chart shows 1260 -1255 depending on how long it takes to get there. i am looking to be bullish at 1274 range but as always trying to stay flexible. i'm not into 15 pt stops you know? LOL
that's why i trade short term scalps which i struggle with. long term, great.. short term. well kind of like reaching my hand through a fan blade while it's on trying not to get clipped.
that's why i trade short term scalps which i struggle with. long term, great.. short term. well kind of like reaching my hand through a fan blade while it's on trying not to get clipped.
Click image for original size
Originally posted by koolblueon a longer term basis.. see how the Nas is down a higher % than the s&p cash again today? When the longer term bottom is finally in you will likely see that change!
personally, i think this carries to 1261 or 1255 over the next day or so, before all is said and done.. but thats just a guess!
Im with you Optimus! I dont really care what the long term is ,i just post it cause a lot of people have asked me too, and to show how an avg guy (me) can decipher the markets as well as any wall street guru . in fact i'll probably quit doing the weekend previews soon. D.T. is working on getting some sentiment charts going and i feel they can be very useful. Once he does i may back off a bit!
Originally posted by Lisa PHope you got in LISA!!! good call, btw..
Watching retest of that level 1279.50-79.75 from caption I posted before
Hey MM,
I traded FOSL, PLCM & BIDU, great trades!
Looking foward to your posts
Diana
I traded FOSL, PLCM & BIDU, great trades!
Looking foward to your posts
Diana
Originally posted by MonkeyMeat
That's GREAT Nigel! Even though the ES gapped down and sold down early, most of the stocks held up with most moving up pretty quickly and steadily when looking at their 5min charts. Of course there's always gonna be a lemon or few that don't behave as anticipated.
NFLX (which can be a mean bastard sometimes), FOSL,OPEN,DVA,SINA and BIDU were all good pretty much from the start ... looking at their 5min charts. Then again, it's where you get in and out that makes a good long trade work (or not).
PLCM was the skanky lemmon and AH kinda all over the map ... woulda been a psychic to pull any money outta those other than the late day rally in AH.
I'd invite others to take a peek at the daily and today's 5min charts on these to see what some good setups in equities can do. Anyway, no horn tootin' for me ... been doing this too long to have ego involved. Just glad someone made some coin with 'em!
Also, as I've mentioned before about equity picks I've posted ... they can act as an INDICATOR for ES trading. If the majority of good long picks just fall apart ... tends to signal more weakness in the market (ES). If they are holding up strong, then it can signal strength in the market with potential intraday upside asserting itself in the ES.
Btw, what stocks were you in NIGEL?
Originally posted by NIGEL68
Thank you MM for those stocks, took 3 of your stocks and made more than $400 today.
Keep posting
Originally posted by MonkeyMeat
For any equity traders out there, if the market moves up, here are some stocks that may offer some potential good long plays for a day trade (or more) today and perhaps the next couple of days.
NFLX, FOSL, AH, OPEN, PLCM, DVA, SINA, BIDU
Some look better than others ... but I'll be watching these. If the mkt sells down, then best to avoid 'em for now.
MM
Emini Day Trading /
Daily Notes /
Forecast /
Economic Events /
Search /
Terms and Conditions /
Disclaimer /
Books /
Online Books /
Site Map /
Contact /
Privacy Policy /
Links /
About /
Day Trading Forum /
Investment Calculators /
Pivot Point Calculator /
Market Profile Generator /
Fibonacci Calculator /
Mailing List /
Advertise Here /
Articles /
Financial Terms /
Brokers /
Software /
Holidays /
Stock Split Calendar /
Mortgage Calculator /
Donate
Copyright © 2004-2023, MyPivots. All rights reserved.
Copyright © 2004-2023, MyPivots. All rights reserved.