MyPivots
Sign In
JA
jarek
Rep: 94
Posts: 3,474
Broader indexes like IWM shown by Roofer and MID below should show us the way in the coming days:

Click image for original size
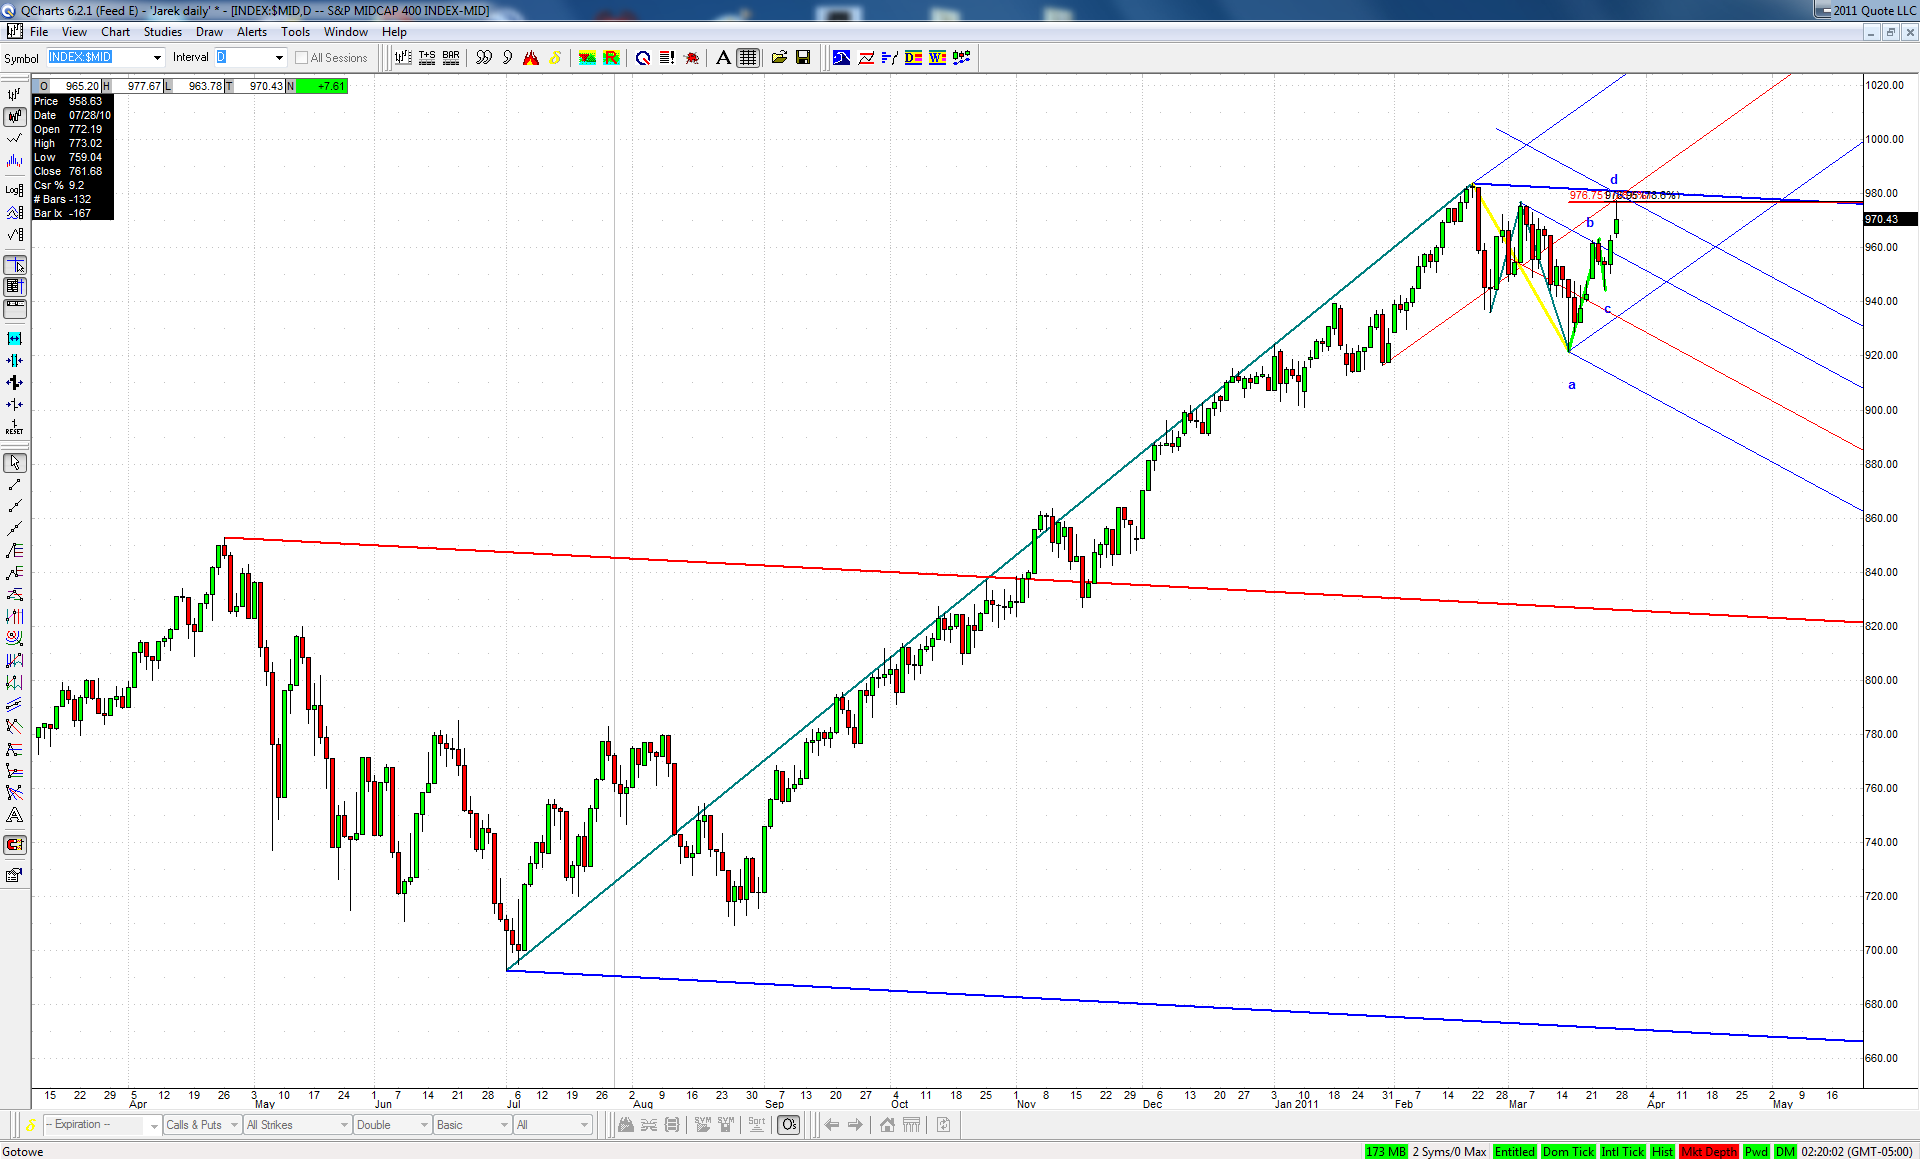

They were usually first to advance in the recent months and we'll see soon if this is the case this time as well
RA
rat89
Rep: 0
Posts: 7,015
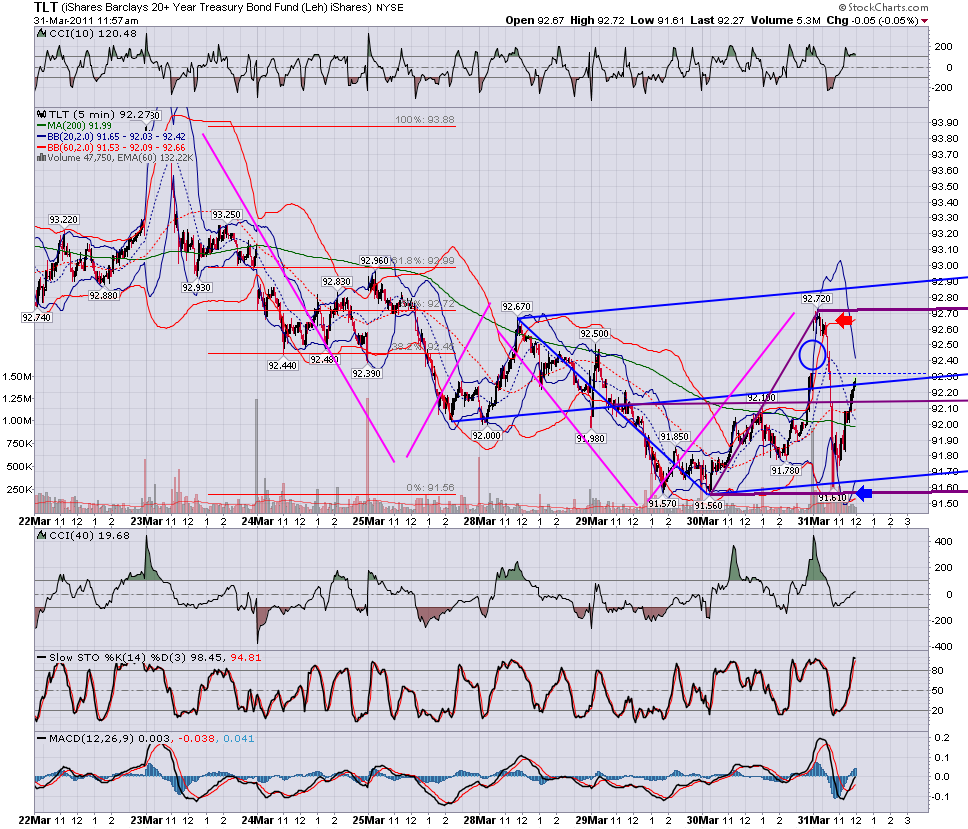
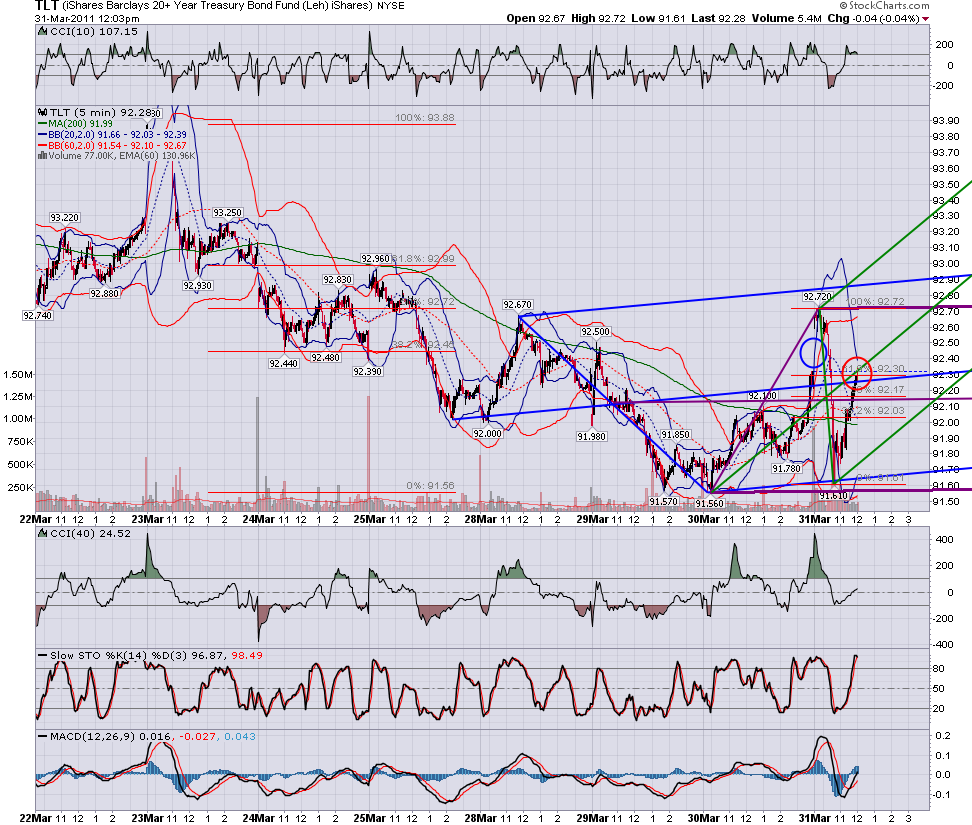
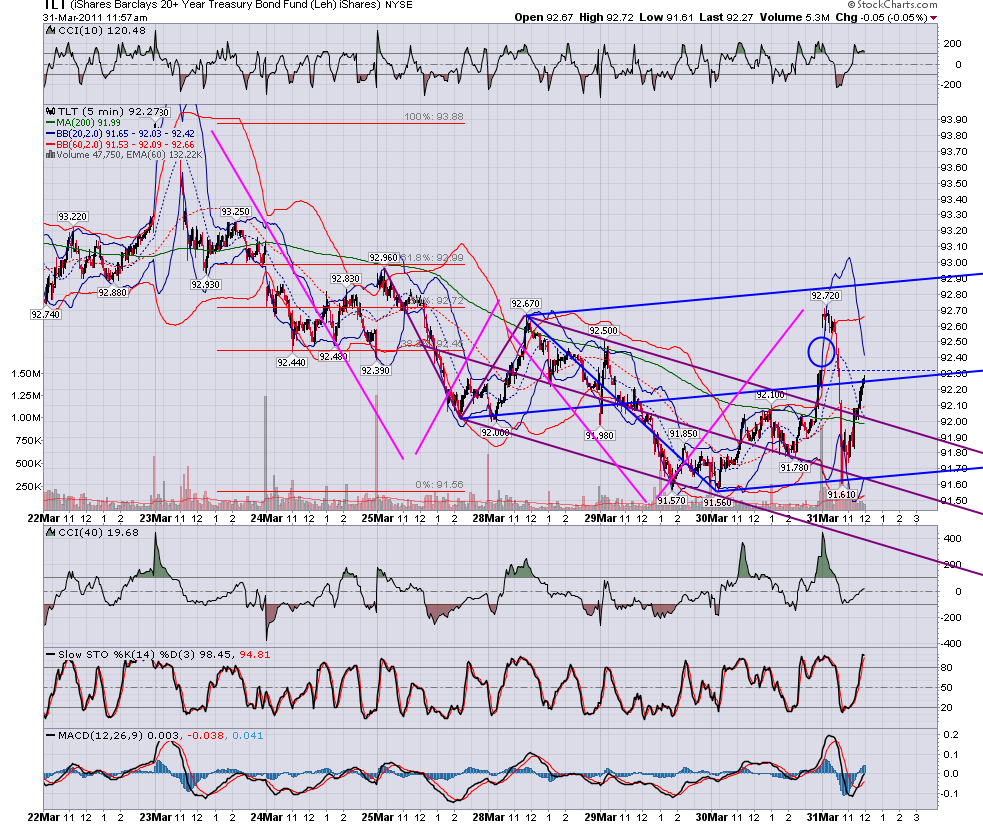
some interesting things happening with bonds today...
Click image for original size

Click image for original size

Click image for original size
RA
rat89
Rep: 0
Posts: 7,015
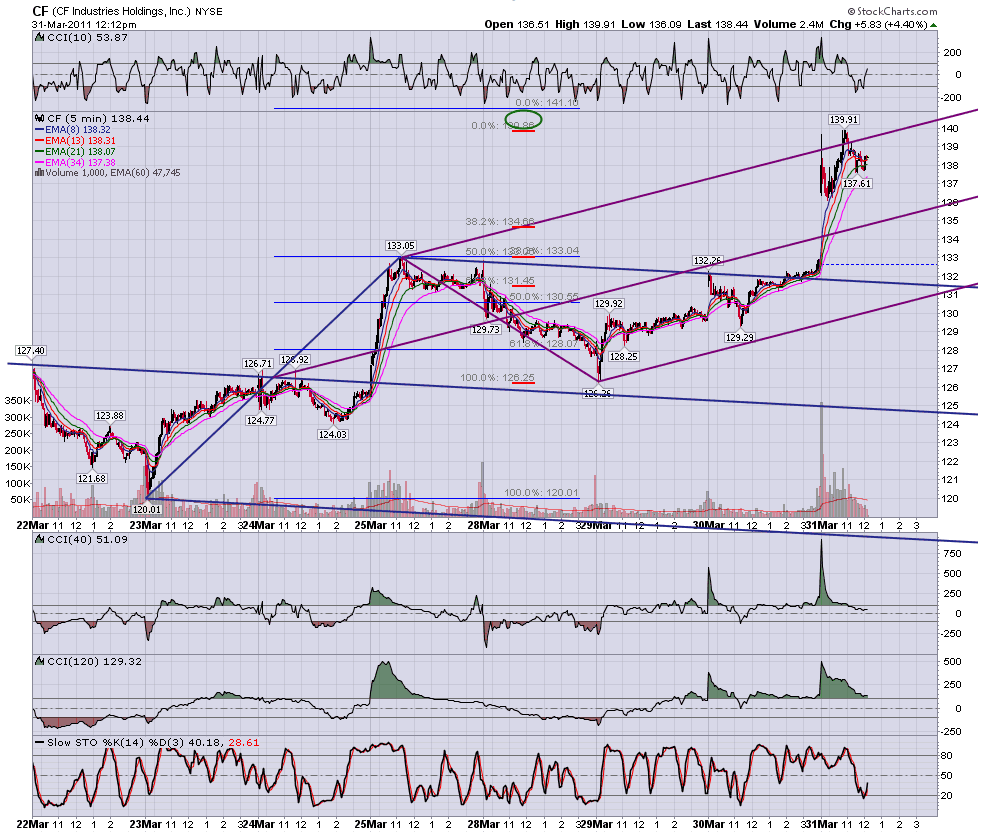
Since I'm still learning this, I'm probably not a good person to explain this....but here is a revised and cleaner chart....there is a consolidation pattern in the middle of the move, with approximately .618 below, and .618 above.....used the blue fibs to pull a 1.618 extension off the previous move up, and the red fibs to pull a 2.0 extension off the high>low swing. Price went right to that target area around the upper line of the schiff set....

Originally posted by tx_ches

Thanks for posting the CF chart. I finally understand what the saying means.


Click image for original size
JI
jimkane
Rep: 3,058
Posts: 33,089
I'm not sure how useful this comment is, but I'm intraday long side bias CL and ES. CL since the ABCD at report time this AM, and ES on the recent third 'test' of that .886 ABCD. The ES, though, I'm very cautious as it nears the highs in here. CL, I'm also not sure it will handle its 'retest' easily, or without a big checkback. In a sense, I'm watching them 'trade the range'.
RA
rat89
Rep: 0
Posts: 7,015
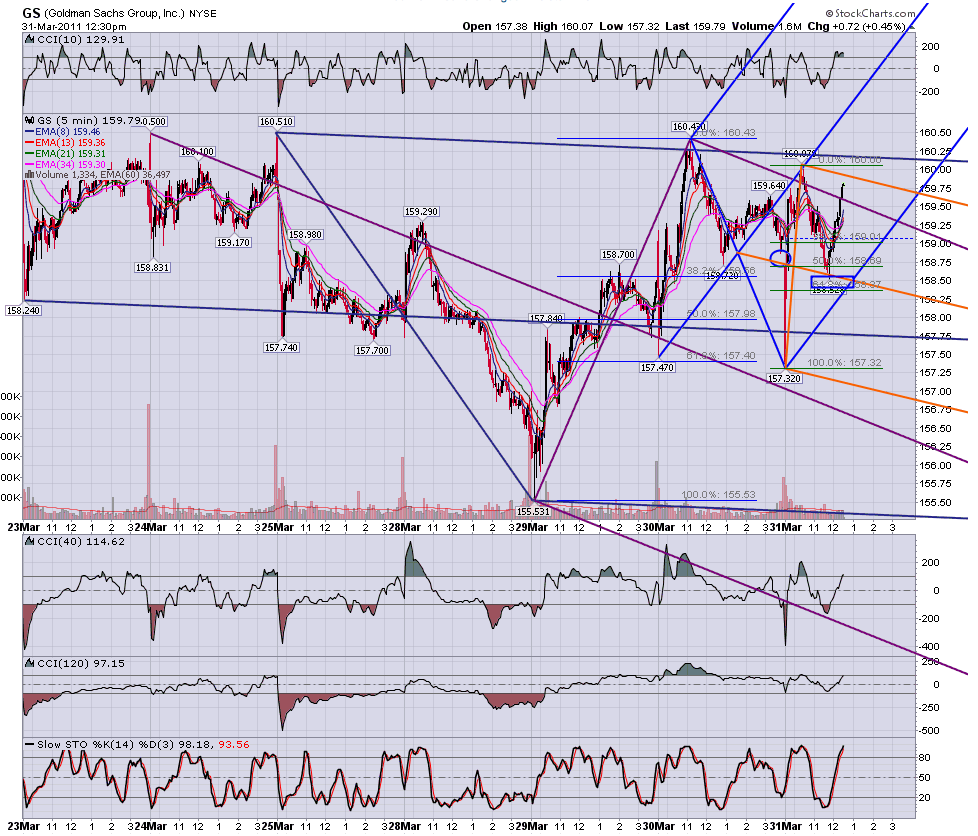
and here's what happened with gs on the pullback.....adjusted the orange set to be schiff set and buyers came in at the median line with 3 cents of the larger .382.....amazing stuff....
Click image for original size
JI
jimkane
Rep: 3,058
Posts: 33,089
ES and CL both seem to be gearing up for attempts at those highs. We'll see.
JI
jimkane
Rep: 3,058
Posts: 33,089
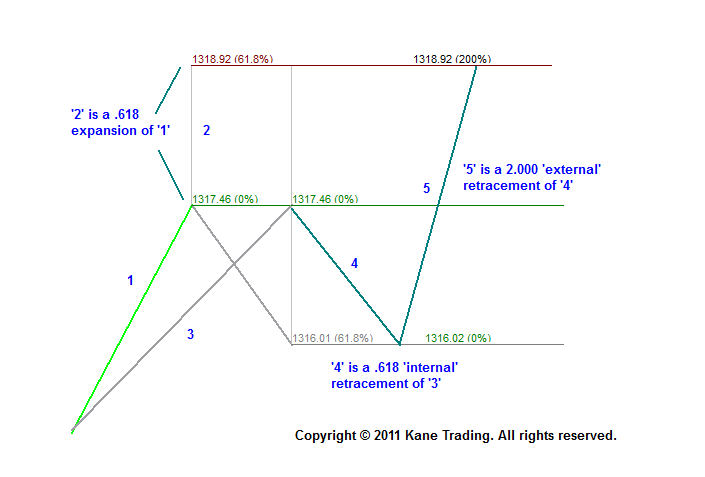
Let me just clarify some terms here, as I use them. I kept Miner's naming convention, and it is also explained in my AFTC book. The first calculation is an 'expansion', and is done by adding the Fib multiple to the swing high point. In this case .618 is added to the swing high point. Hence, if we called the first swing move a '1.000', to 'normalize' it, adding .618 of that to the swing high puts one 1.618 off the low.

The next calculation is a 2.000 external retracement of the pullback off that swing high. It is called an 'external' retracement because the value is over 1.000. Under a 1.000 retracement is called an 'internal' retracement. Mathematically, 'geometrically', and this is easy to show, the two calculations will exactly overlap when the retracement back off that swing point is a .618. I have discussed the above in another post, when roofer laid out 'The Trade'.

Although the levels are very easy to do via stockcharts and their tools, it can be very confusing to those using the more conventional tools in most platforms. All this is quite easy to grasp via QCharts tools. Here is a graphic, for those using the tools of most platforms, and for those that want to grasp the geometry of this a bit more.


Click image for original size
Expansion retracement overlap chart


Originally posted by rat89

Since I'm still learning this, I'm probably not a good person to explain this....but here is a revised and cleaner chart....there is a consolidation pattern in the middle of the move, with approximately .618 below, and .618 above.....used the blue fibs to pull a 1.618 extension off the previous move up, and the red fibs to pull a 2.0 extension off the high>low swing. Price went right to that target area around the upper line of the schiff set....

Originally posted by tx_ches

Thanks for posting the CF chart. I finally understand what the saying means.


Click image for original size

JI
jimkane
Rep: 3,058
Posts: 33,089
Watching this action at the highs very closely.
RA
rat89
Rep: 0
Posts: 7,015
thank you Jim!

Originally posted by jimkane

Let me just clarify some terms here, as I use them. I kept Miner's naming convention, and it is also explained in my AFTC book. The first calculation is an 'expansion', and is done by adding the Fib multiple to the swing high point. In this case .618 is added to the swing high point. Hence, if we called the first swing move a '1.000', to 'normalize' it, adding .618 of that to the swing high puts one 1.618 off the low.


JI
jimkane
Rep: 3,058
Posts: 33,089
You're welcome. As long as it helps the people in here, then it is worth my time to put it together.
JI
jimkane
Rep: 3,058
Posts: 33,089
Long side crude bias sure was the 'trade o' the day', in my opinon. Not looking to be off that side for awhile...
JI
jimkane
Rep: 3,058
Posts: 33,089
Yeah, that 1338 rings a bell, but I confirmed the high by various sources and feel it is correct. I even checked several other contracts, but couldn't find that 1338. I've seen it before, though...