MyPivots
Sign In
JA
jarek
Rep: 94
Posts: 3,474
Broader indexes like IWM shown by Roofer and MID below should show us the way in the coming days:

Click image for original size
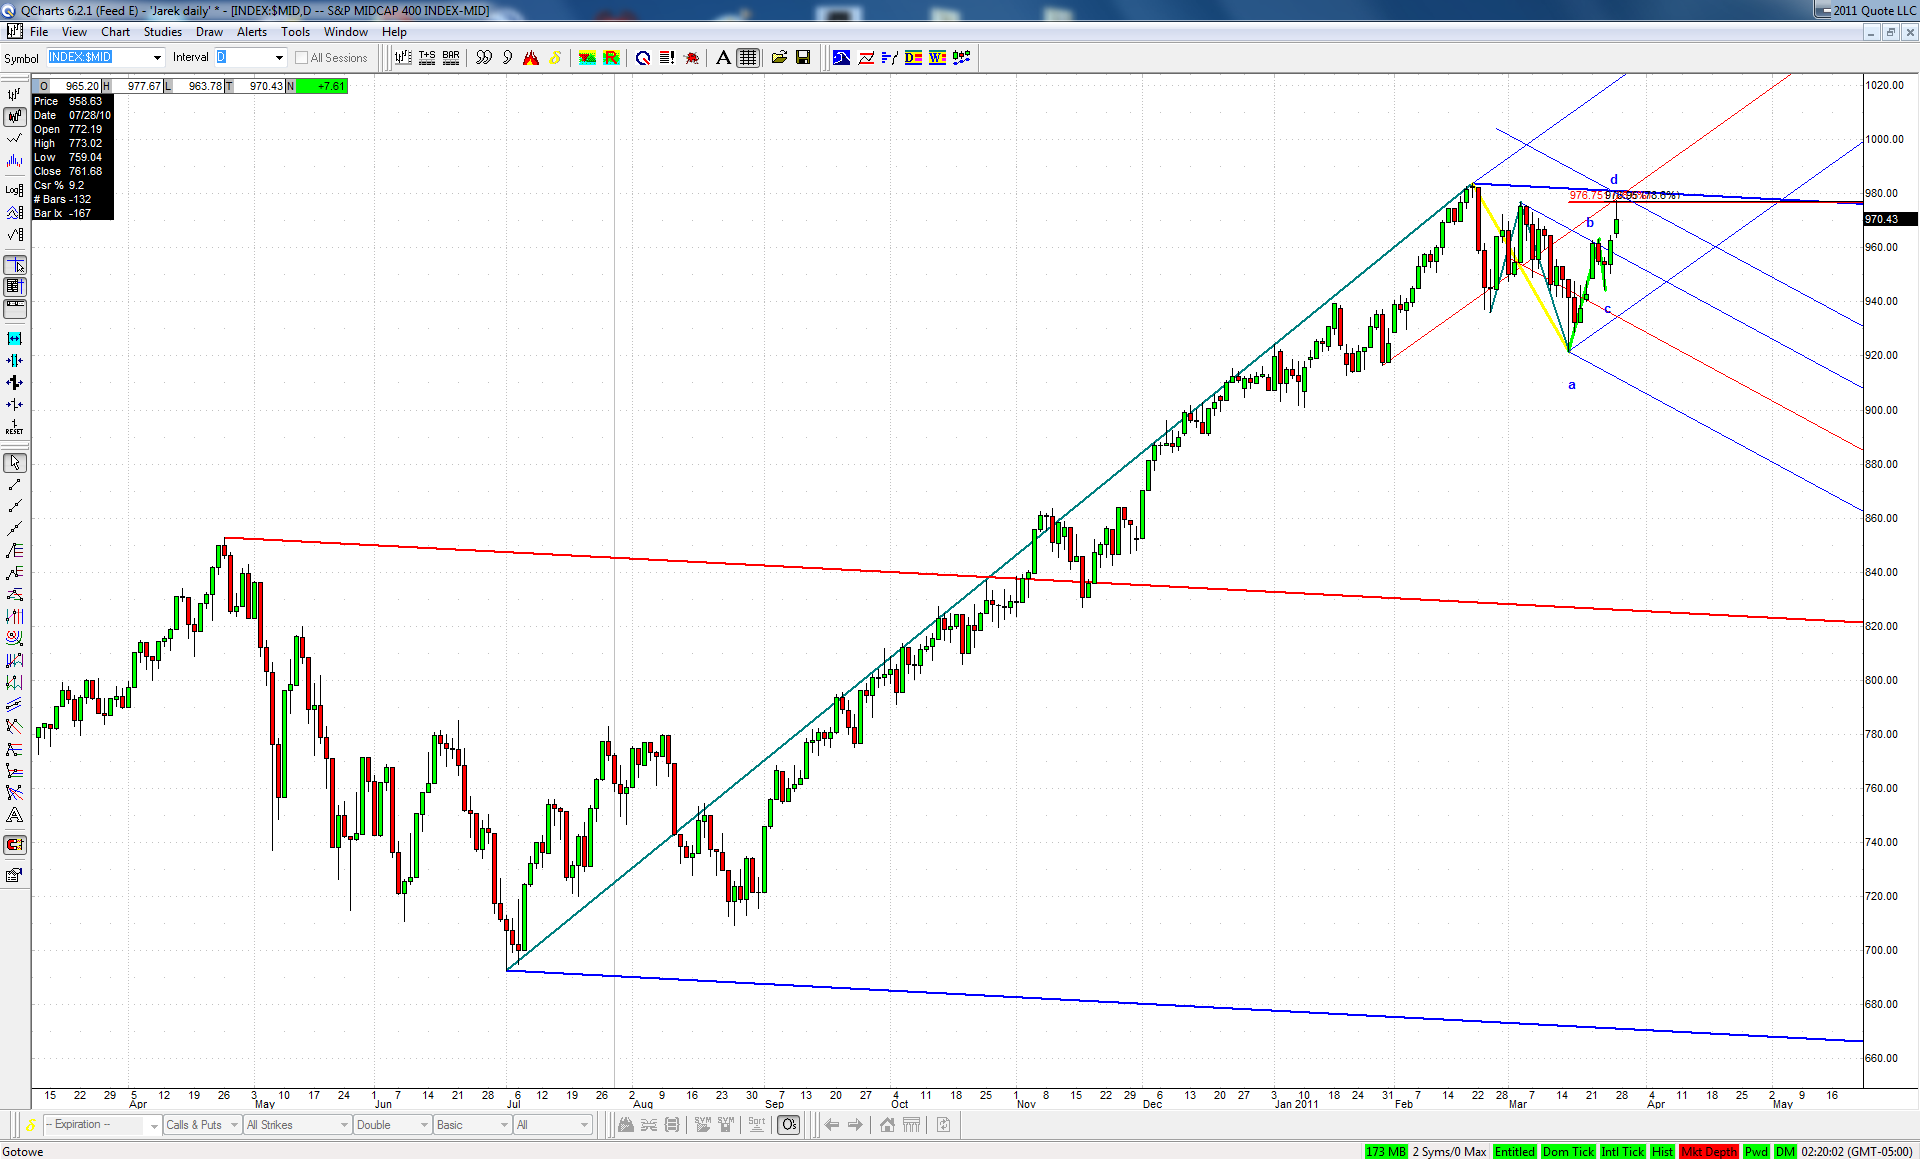

They were usually first to advance in the recent months and we'll see soon if this is the case this time as well
RO
roofer
Rep: 3,689
Posts: 3,574
again... i was looking for a 3 of 3 of 3....but when the volume and A/D and the semi's were not along for the ride... l had precalculated where price might turn....so thinking it might be my last shot at a decent short for a few weeks, as i expect 3 of 3 of 3 to setup next week, i took it....
TX
tx_ches
Rep: -10
Posts: 514
Eric or Jim,
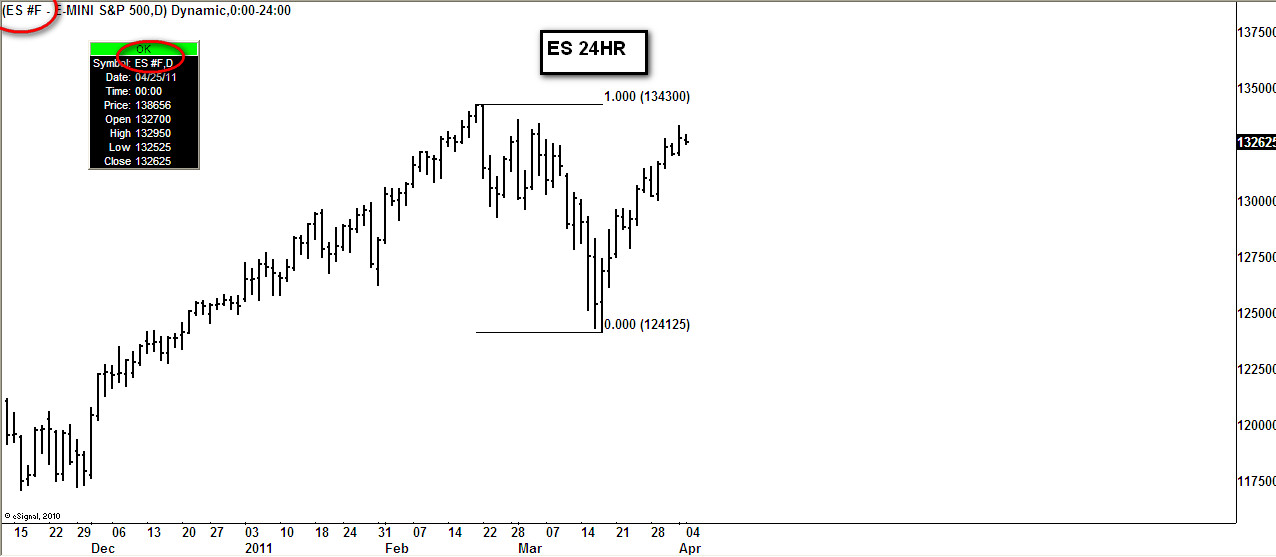
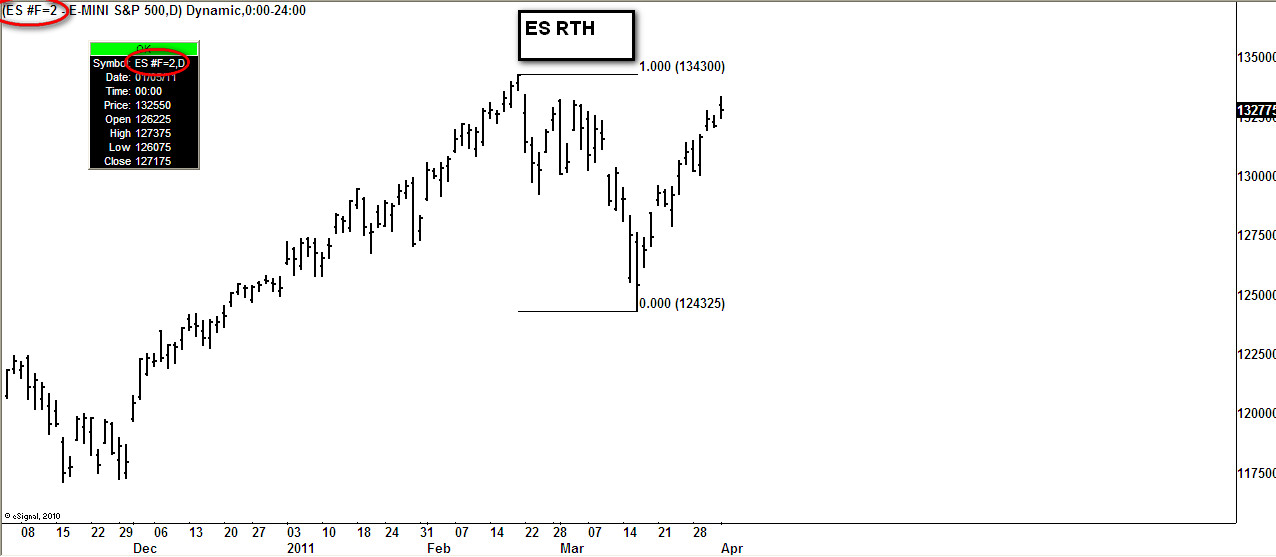
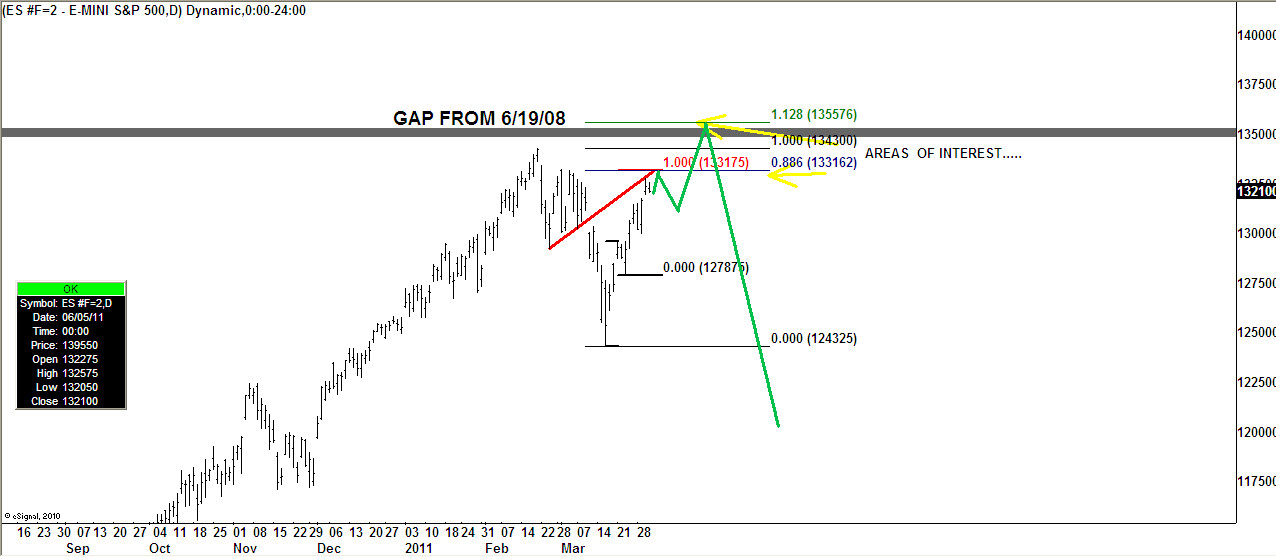
I was duplicating the action on this ES daily chart from Eric and was getting more in the 1350-1351 area. When I looked closer at the numbers I realized mine were not the same.
Just so I can check my data from tradestation vs your esignal,
is the high bar 1338 or is it 1343?
is the low bar on the pullback 1241.25 or is it 1243.25?
Thanks in advance.

Originally posted by EricD

I am on the same page of higher prices with Jim and Roofer. I am looking for 1355ish by 4/7-4/15. Just watching areas and making decisions if the setups permit.
Click image for original size
JI
jimkane
Rep: 3,058
Posts: 33,089
Hey tx, I have 1343.00 for the high, and 1241.25 for the low. Not sure why Eric's data is showing the low at 43.25...


Originally posted by tx_ches

Eric or Jim,
I was duplicating the action on this ES daily chart from Eric and was getting more in the 1350-1351 area. When I looked closer at the numbers I realized mine were not the same.
Just so I can check my data from tradestation vs your esignal,
is the high bar 1338 or is it 1343?
is the low bar on the pullback 1241.25 or is it 1243.25?
Thanks in advance.

Originally posted by EricD

I am on the same page of higher prices with Jim and Roofer. I am looking for 1355ish by 4/7-4/15. Just watching areas and making decisions if the setups permit.
Click image for original size


ER
EricD
Rep: 63
Posts: 692
it is a RTH ES Daily Chart...the highs and lows of the 24hr. Globex Chart don't always line up with the Day Session Chart.
JI
jimkane
Rep: 3,058
Posts: 33,089
So, eSignal has a way to do an RTH daily chart for futures? QCharts, which is running off the same eSignal data manager and database, when set to daily, always is a 24-hour daily chart. You can get an RTH by putting in 405 minutes, but it doesn't say 'daily'. How do you tell eSignal when you want daily RTH or daily 24-hour? Interesting.
ER
EricD
Rep: 63
Posts: 692
ES #F IS 24HR AND ES #F=2 IS RTH...ALL BASED ON CONTINUOUS DATA.
Click image for original size

Click image for original size
JI
jimkane
Rep: 3,058
Posts: 33,089
Holy crow, that works for QCharts, too! Wow, is that cool.
TX
tx_ches
Rep: -10
Posts: 514
Thanks for that clarification.
In Tradestation, I get the discrepancies in the lows on globex vs RTH but I get a different high - 1338 and it is the same on both.
JI
jimkane
Rep: 3,058
Posts: 33,089
Yeah, that 1338 rings a bell, but I confirmed the high by various sources and feel it is correct. I even checked several other contracts, but couldn't find that 1338. I've seen it before, though...