ES Thu 9-8-11
Today is rollover day so adjust your trading platforms and charts to trade the December 2011 contract from today going forward.
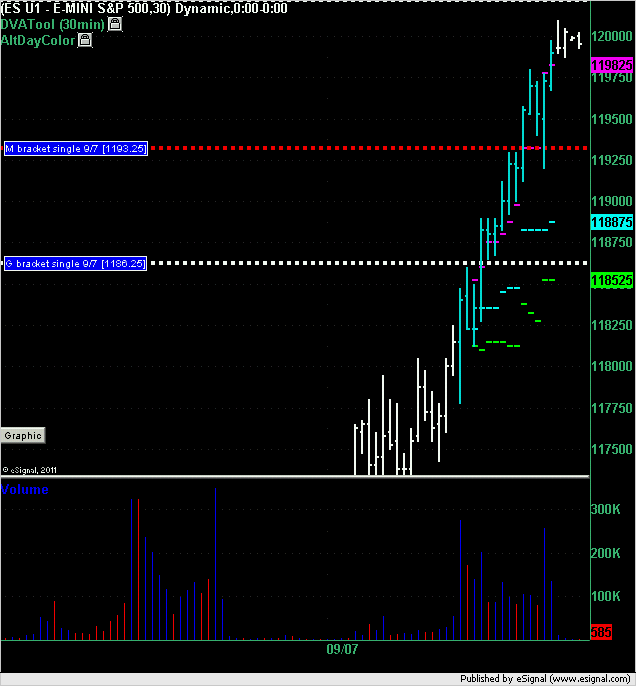
Market Profile Single prints from Wednesday in the September contract.
The market created 2 single prints on Wednesday. The second single print filled in a triggered a long at 1193.25 which had a 1.25 point draw down to 1192 even and then a best run up of 6.5 points to the high of the day of 1199.75. The following chart shows the single prints from Wednesday for the September contract.
In trading today (Thursday) there will be singles left from Wednesday at different price points because you will be trading the December contract.
Click image for original size
Magic of Single prints and ACD continues. I did not traded /es as my hands were full with /cl.
http://screencast.com/t/rOLQXXjUw
http://screencast.com/t/rOLQXXjUw
Would anyone mind posting the ESU VAH, POC, and VAL? Still new to MP and not sure how to get them. Thanks.
Sean
Sean
Originally posted by Capitalista
Would anyone mind posting the ESU VAH, POC, and VAL? Still new to MP and not sure how to get them.
If you have the 30 minute highs and lows for the RTH session then drop them into the Market Profile Calculator to generate those values.
Thank you.
Originally posted by day trading
Originally posted by Capitalista
Would anyone mind posting the ESU VAH, POC, and VAL? Still new to MP and not sure how to get them.
If you have the 30 minute highs and lows for the RTH session then drop them into the Market Profile Calculator to generate those values.
Whippy!
Most I read say short. Makes one want to be long.
Watch DJI 11400 as it's 50% level of 11150 and 11650.
I will stay on Sept contract a few days. I can make a case for both directions as usual. 1200 looms large and targets up would be 1220 and 1236.
Down target would be 1030,really.
Before that, I'd watch 1190 here and lod after that.
1198 the nut here as it's 23.6 retrace level of large ascent to 1363.
Just an idea of internals.
AMZN almost back to previous high
AAPL could exceed previous high in a blink,30 points below here.
GS,could pop to 124, currently at 107.
Looking like what most call a squeeze here so far.
1198 and 11400.
1196,1190,and 1185 below.
3rd lower high at 99.5 there.
94.25 the 50% level
1198 the level to brake and hold
Could be a back and forth day.... the day after strong trend yesterday..still inside O/N range after first hour
True.Could be sideways all day.
Break of that high would be a start. I have R levels at 1203 and 1210.
Current daily 50 SMA at 1243 and descending.
I'm thinking up, then down. Could be wrong fast.
Break of that high would be a start. I have R levels at 1203 and 1210.
Current daily 50 SMA at 1243 and descending.
I'm thinking up, then down. Could be wrong fast.
10:55 bar on the 5min was a H1 after 7 consec. HH good buy scalp for 2pts....H3 now
Still looking for 1210ish area before shorts. 55ish area after that
Nice! Thanks for the response. I think I got the basics and appreciate the time. Didn't mean to get you to write so much in rth and should have stated so in my post.
Anytime you want if you got more.
Anytime you want if you got more.
Originally posted by CharterJoe
I don't know what you call it, I'll post more later. basically no counter trend trades other than early morning. Look at the open this am 3 HH and 3 LL back to the open or when it books 3 LL's on the 5min. Short the first LL as its an imbalance and will most likely trade back to the open print. Rest of day look for H3 or better and take the first H1 after a pull back or the first L1 after a L3 or better all trades should be above ema for long and below for short, also best if above open print for longs and below for shorts. Same principle on the longer TF best if they all line up.
Emini Day Trading /
Daily Notes /
Forecast /
Economic Events /
Search /
Terms and Conditions /
Disclaimer /
Books /
Online Books /
Site Map /
Contact /
Privacy Policy /
Links /
About /
Day Trading Forum /
Investment Calculators /
Pivot Point Calculator /
Market Profile Generator /
Fibonacci Calculator /
Mailing List /
Advertise Here /
Articles /
Financial Terms /
Brokers /
Software /
Holidays /
Stock Split Calendar /
Mortgage Calculator /
Donate
Copyright © 2004-2023, MyPivots. All rights reserved.
Copyright © 2004-2023, MyPivots. All rights reserved.