ES Tuesday 11-22-11
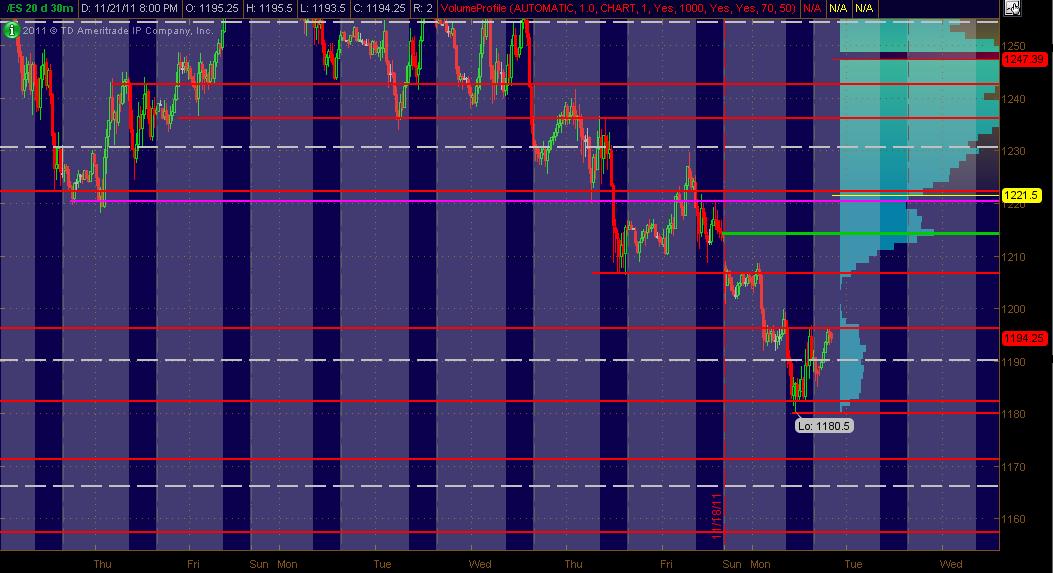
Here's what I've got for my ES MAP of PASR ZONES using a 30min chart of 20 days of data coming into Tuesday's trading. The Red lines are potential significant levels with Magenta lines as semi-significant. The White dashed lines are the Weekly Pivots and the Green line is a Gap to be closed. The Light Blue Volume Profile of the past "rolling" 20 days is displayed on the right vertical axis. The Gray background shows non-RTH price activity. Hope some find this useful!
1214 Gap Close level / 20day & 2day HVN / Fib Cluster
1206 PASR / Daily R2 (RTH calc's) / Fib Cluster
1182 - 1180 PASR / Daily S1 (RTH calc's) / Fib Cluster
1172 - 1171 PASR / Daily S2 (RTH calc's) / DeMark Daily S1
Click image for original size
1214 Gap Close level / 20day & 2day HVN / Fib Cluster
1206 PASR / Daily R2 (RTH calc's) / Fib Cluster
1182 - 1180 PASR / Daily S1 (RTH calc's) / Fib Cluster
1172 - 1171 PASR / Daily S2 (RTH calc's) / DeMark Daily S1
here is yesterday, last night and todays developing profile levels...today is split out
Click image for original size
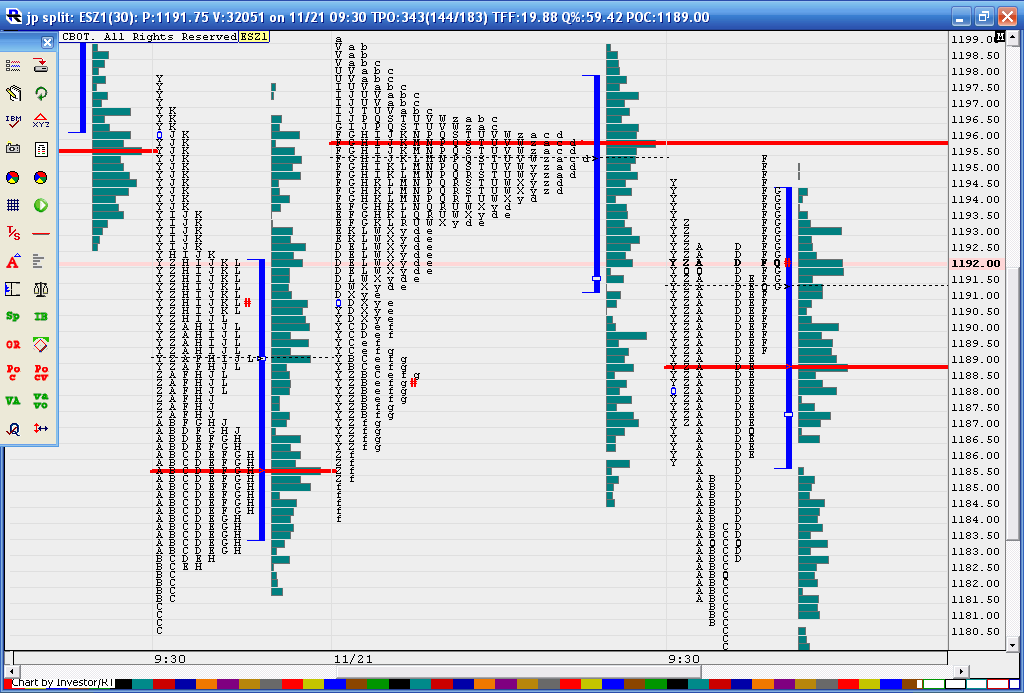
a look at how the single prints that formed in "c" period became support during "G" period. We had the close above that single print in "F" period. That helps signal that the single prints will reverse polarity!
Click image for original size
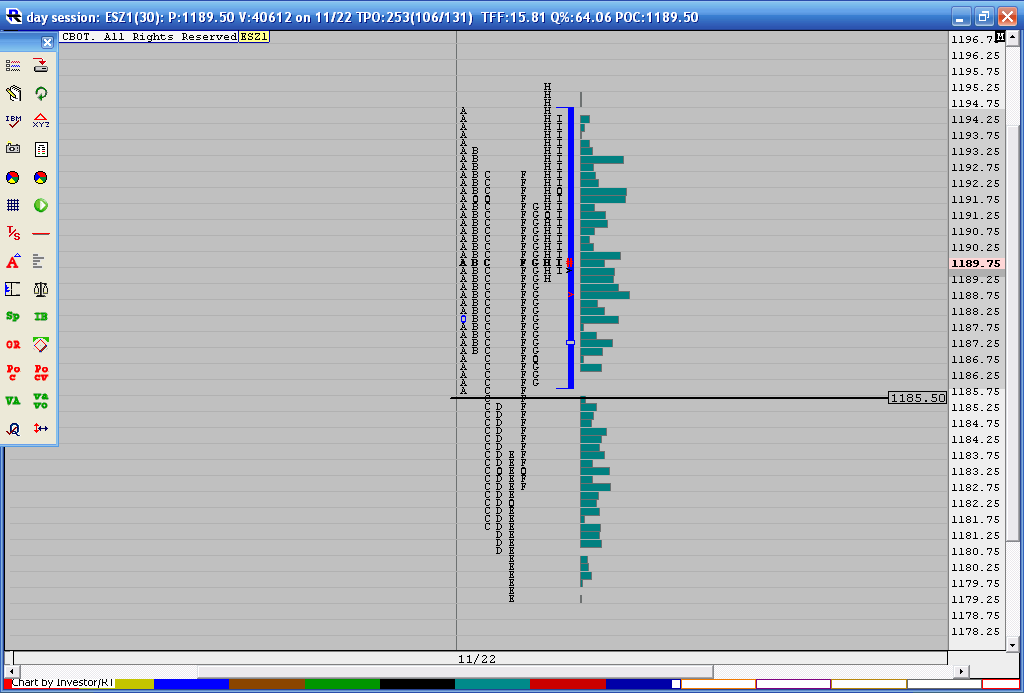
Neutral day and inside yesterdays range...watch the middle of the range!
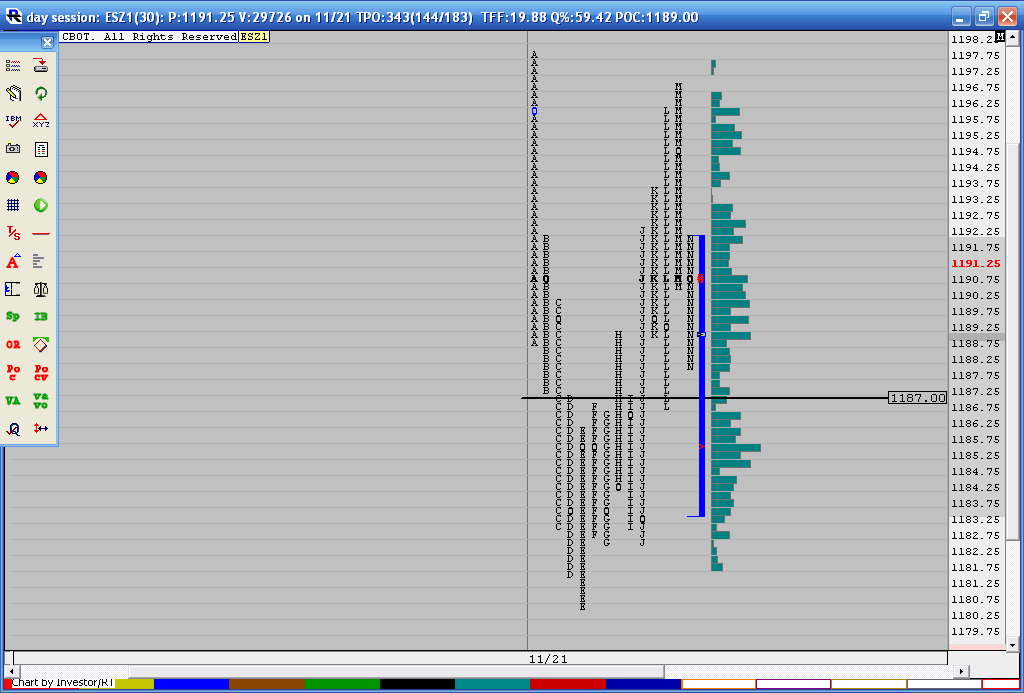
same thing happened yesterday...we had single prints form in "C" period but we didn't get a 30 minute close above there until "J" period...then polarity is reversed...then L period comes back for the retest of the reversed single prints....
Will most remember this concept..? Hope so...
Will most remember this concept..? Hope so...
Click image for original size
Very interesting concept Bruce, thank you for your insight. Would you say the successful retest confirms the polarity switch ?
A few brief comments: Most have read before that I use a matrix which I am not currently looking to share with the forum. This matrix helps me qualify my trades and how many contracts I will trade. It is based on high and low volume areas, the Ib, air pockets and previous days ranges which includes the overnight. It is also based on my account size so it may be quite useless to most. Your risk tolerance will also be different than mine.
yesterday I was offended by the accusation that I was a paper trader. If I hadn't been doing this for years or admit that I only hold runner contracts to final targets less than 15% of the time then I might agree with the possibility that I am only pushing paper day after day.
I've tried my best to describe what I see and "WHY" I take contracts off at certain targets. Often you will "see" me run out of ammo too as a trade keeps going. I feel sorry for the non- believers but until the day comes when all are posting their account statements I will continue to post as I do. I don't care what a few people choose to believe.
I wish all of you a Happy Thanksgiving and enjoy the days off for those of you who don't celebrate the holiday.
Bruce
there is LV at 86.25 will that have anything to do with that surport?
Originally posted by BruceM
same thing happened yesterday...we had single prints form in "C" period but we didn't get a 30 minute close above there until "J" period...then polarity is reversed...then L period comes back for the retest of the reversed single prints....
Will most remember this concept..? Hope so...
Click image for original size
For me it is the Close that is most important but just the fact that we are trading above/below a point that once was single prints is telling us a lot about the ENERGY of the participants who drove the market....we can also use our Cummulative delta to look at the various levels once the singles get filled.
The concept applies also to previous days lows and highs in RTH. You will get those great buying and selling tails when they can't get closes to confirm breakouts.Todays lows are a good example. Like everything, it isn't perfect but I know you don't expect it to be PT and you will do your own work if you think it has value.
The concept applies also to previous days lows and highs in RTH. You will get those great buying and selling tails when they can't get closes to confirm breakouts.Todays lows are a good example. Like everything, it isn't perfect but I know you don't expect it to be PT and you will do your own work if you think it has value.
Originally posted by pt_emini
Very interesting concept Bruce, thank you for your insight. Would you say the successful retest confirms the polarity switch ?
Yes Richard...that shows the driving force..I chose the single print concept which is based on time but monitoring the low volume areas with 30 minute closes does the same basic thing..
Originally posted by della
there is LV at 86.25 will that have anything to do with that surport?Originally posted by BruceM
same thing happened yesterday...we had single prints form in "C" period but we didn't get a 30 minute close above there until "J" period...then polarity is reversed...then L period comes back for the retest of the reversed single prints....
Will most remember this concept..? Hope so...
Click image for original size
Richard..the fact that we have that low volume down there and the middle of the range was there helps the fade....always get out with the biggest part of your contracts at whichever target comes first...In this case u would want to take off at the 87.25 target and try to hold something small for the low volume node.
89.75 - 91.75 is now key resistance....lets see if they can get a close back under that low volume node at 3 PM....not trading anymore today...neutral days in the afternoon are my least favorite..
89.75 - 91.75 is now key resistance....lets see if they can get a close back under that low volume node at 3 PM....not trading anymore today...neutral days in the afternoon are my least favorite..
I am new in the this room, only from some months ago. Bruce, I apreciate a lot your concepts, ideas and more the everything your explanations about MP and volumen, something that I am realizing works very well and for me it is different of all the concepts that I learned until now. Thanks everybody for share your knowledge.
Emini Day Trading /
Daily Notes /
Forecast /
Economic Events /
Search /
Terms and Conditions /
Disclaimer /
Books /
Online Books /
Site Map /
Contact /
Privacy Policy /
Links /
About /
Day Trading Forum /
Investment Calculators /
Pivot Point Calculator /
Market Profile Generator /
Fibonacci Calculator /
Mailing List /
Advertise Here /
Articles /
Financial Terms /
Brokers /
Software /
Holidays /
Stock Split Calendar /
Mortgage Calculator /
Donate
Copyright © 2004-2023, MyPivots. All rights reserved.
Copyright © 2004-2023, MyPivots. All rights reserved.