JI
jimkane
Rep: 3,058
Posts: 33,089
Okay, let's crank up another great week in here. The market action should be awesome again, I suspect.
MA
MarcinO
Rep: 67
Posts: 5,506
Jim, with respect to time analysis, do you use all the Fib levels you apply to price with a similar hierarchy of primary, secondary and tertiary numbers? I am asking, because Robert Miner excluded some numbers used in price retracements, e.g. .786, claiming they are not that useful in time analysis.
Originally posted by jimkane
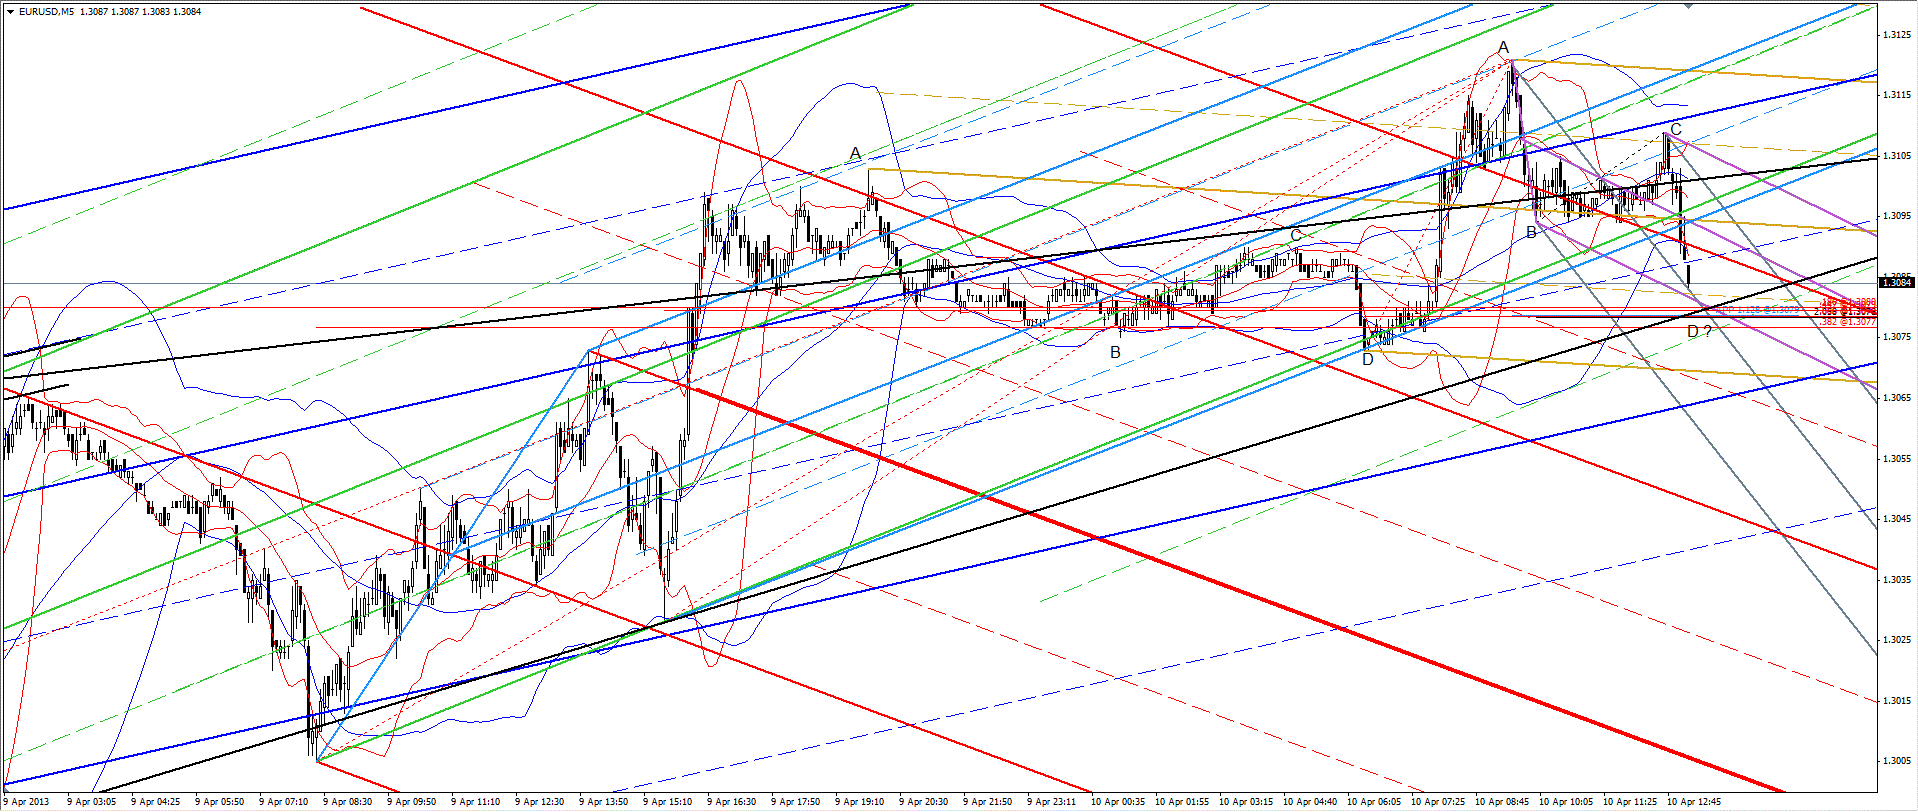
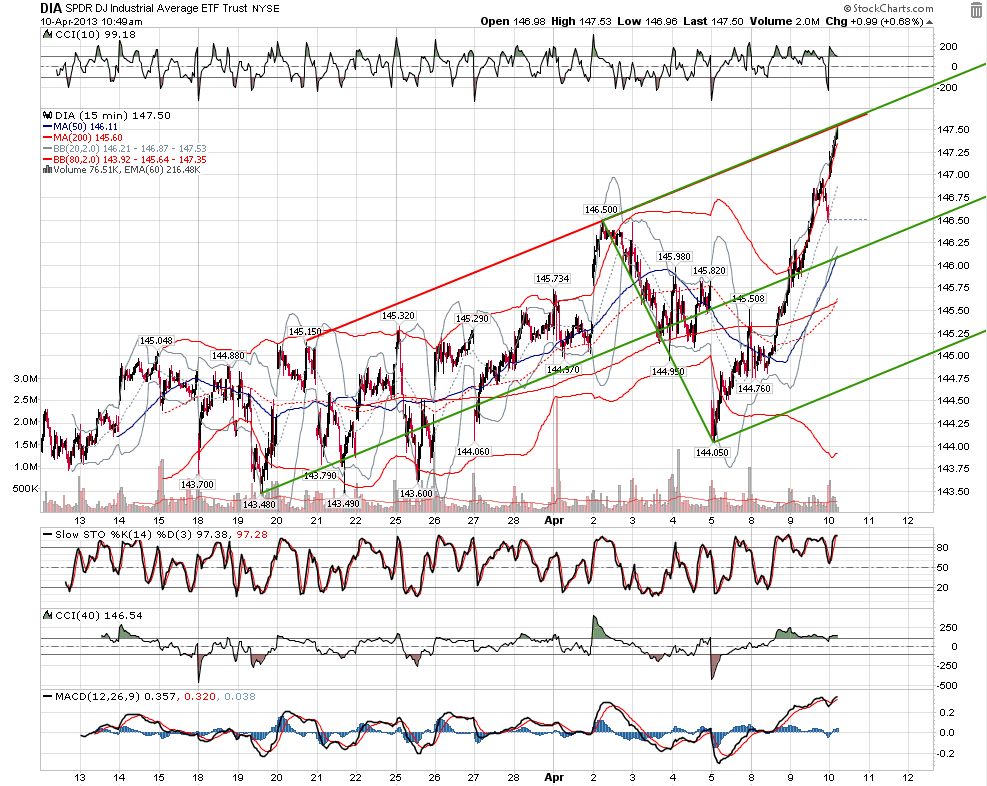
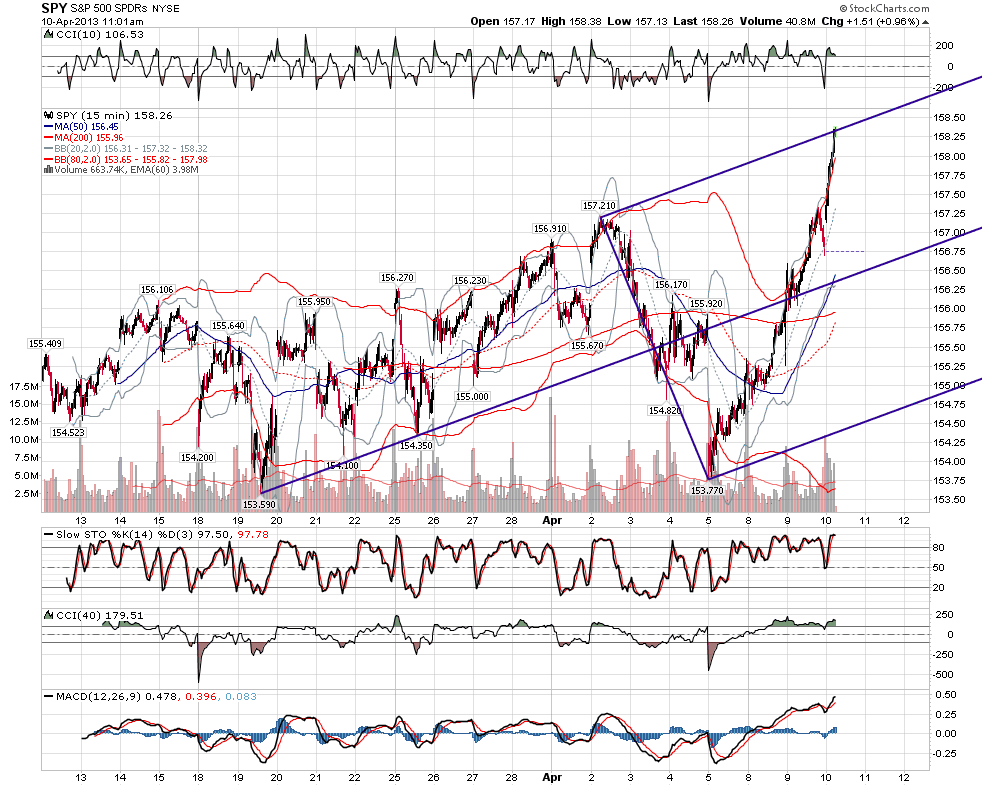
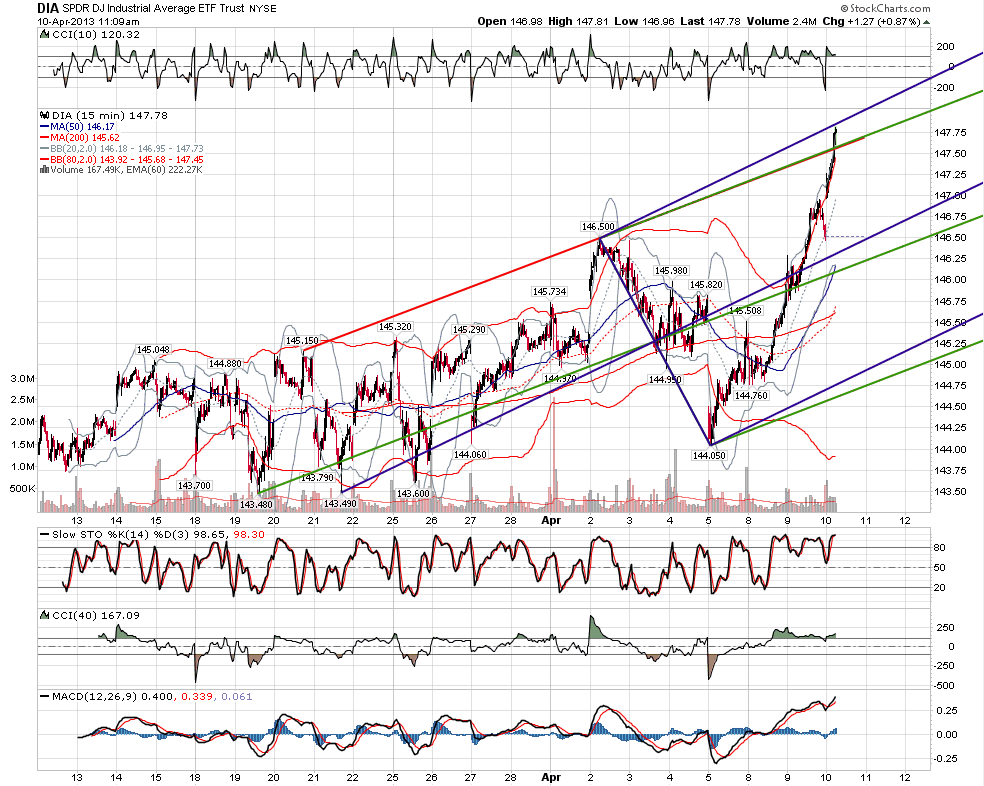
It seems the perfect price and time balance was too much for it. This is not the teaching point I mentioned earlier, that will have to wait until tomorrow. I just wanted to show what happened there. You really should do the work to see why I had this spot.
Originally posted by jimkane
Moving up off that area. It was a perfect price and time balance there. Everything hit in one precise spot, with the time factor, it went right there, and reacted...
JI
jimkane
Rep: 3,058
Posts: 33,089
Okay, now we see if the spectacular play (right off my posted area...) will allow for any countertrend or not.
JI
jimkane
Rep: 3,058
Posts: 33,089
My time levels come from line intersections overlapping Fib levels. Here there was a tight Fib level that overlapped, almost dead on, a line intersection of at least four key lines. Tim Morge I believe it was coined the phrase 'X marks the spot'. I coined the phrase 'Asterisk (*) marks the spot' because I frequently have a slew of lines hitting at a spot that looks like an asterisk. Anyway, that's how I get timing factors, Fib grouping and line intersection overlaps.
Originally posted by MarcinO
Jim, with respect to time analysis, do you use all the Fib levels you apply to price with a similar hierarchy of primary, secondary and tertiary numbers? I am asking, because Robert Miner excluded some numbers used in price retracements, e.g. .786, claiming they are not that useful in time analysis.
Originally posted by jimkane
It seems the perfect price and time balance was too much for it. This is not the teaching point I mentioned earlier, that will have to wait until tomorrow. I just wanted to show what happened there. You really should do the work to see why I had this spot.
Originally posted by jimkane
Moving up off that area. It was a perfect price and time balance there. Everything hit in one precise spot, with the time factor, it went right there, and reacted...
JI
jimkane
Rep: 3,058
Posts: 33,089
If the ES breaks above this level by more than a nominal amount other work I have implies trend until close. Just tossing that out there.
JI
jimkane
Rep: 3,058
Posts: 33,089
Here's an update of the chart I posted last night. I will still try to get to posting my teaching point later today if I feel up to it. We have a storm right now and the power could go out, so if I disappear, that's why.
Chart created on QCharts, courtesy eSignal
Click image for original size
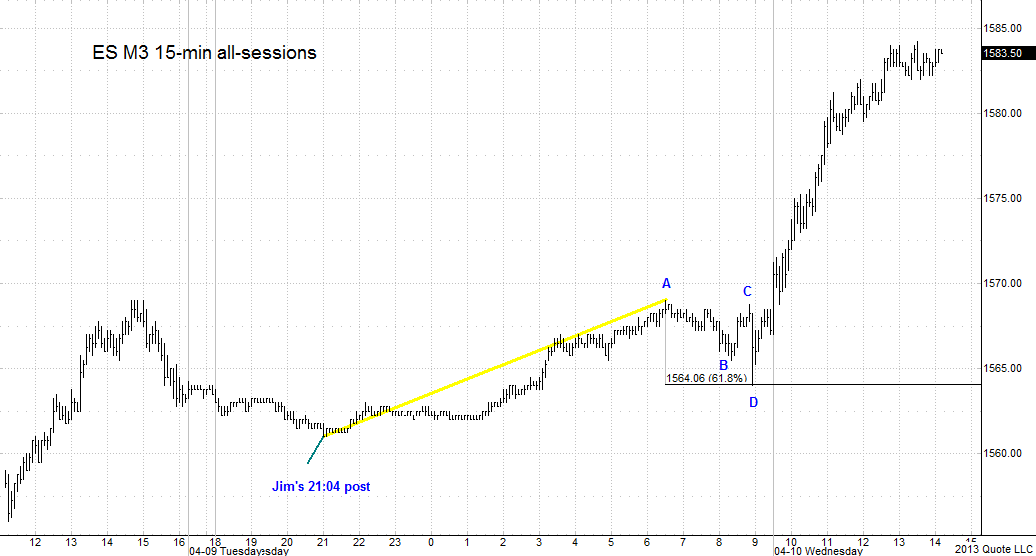
Chart created on QCharts, courtesy eSignal
JI
jimkane
Rep: 3,058
Posts: 33,089
I was going to ask you, roofer, if you caught that gold move, and I decided to look back again at your posts, and I see you caught it via the GDX, and the oil move, too. Nice. Wait a minute, I just realized, what's the point of this post? Hmmm, I guess there is none? At least it will up my post count by one.