JI
jimkane
Rep: 3,058
Posts: 33,089
Okay, let's crank up another great week in here. The market action should be awesome again, I suspect.
JI
jimkane
Rep: 3,058
Posts: 33,089
But, alas, the countertrend does give us a little move. Now we see if that was the base for the trend until close, or the start of a countertrend move. I'm greatly hoping the latter. But it's a tough row to hoe to fight a 50 point move up...
JI
jimkane
Rep: 3,058
Posts: 33,089
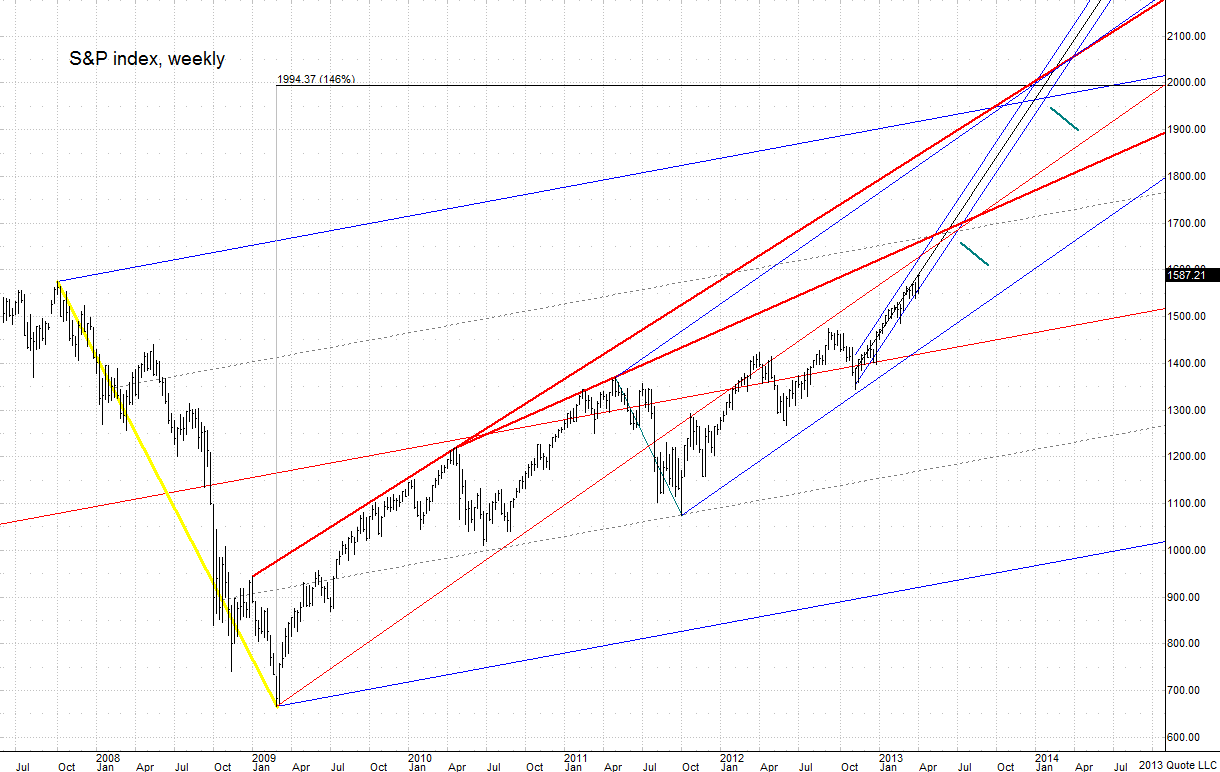
Today's pop puts the S&P cash over the previous all-time intraday high. Before the closing high was taken out, now the intraday high. The S&P index has never traded at these levels before, as Tim Knight says, 'in human history'. Anyway, in my opinion, get used to it. I'm looking well into the 1600's next on the higher timeframe, and if they truly go nuts on it recall I have that area that hits at the end of the year at S&P 2000. I think that's entirely on the table. Entirely.
JI
jimkane
Rep: 3,058
Posts: 33,089
Here's some work for that weekly S&P index. The first chart here is to show how the key set is anchored.
Here's some basic work that shows the two areas, the 1600's stuff, and the year end 2000 stuff. Recall when I posted on this before, describing how the majority may get fooled. No one, and I mean no one mainstream that I can find, is calling an end to the bull this early summer. That's the first area. Everyone is calling for the end of the year, early next year.
Maybe it fools everyone because if it hits 2000 right at year end they will all say it's different this time and this bull will never end, and then they get hammered and won't capitulate/sell for a long time as they call the bottom all the way down. Just some scenarios. Probably what it finally does will come as a total surprise to me. In the meantime, these are working premises.
Charts created on QCharts, courtesy eSignal
Click image for original size
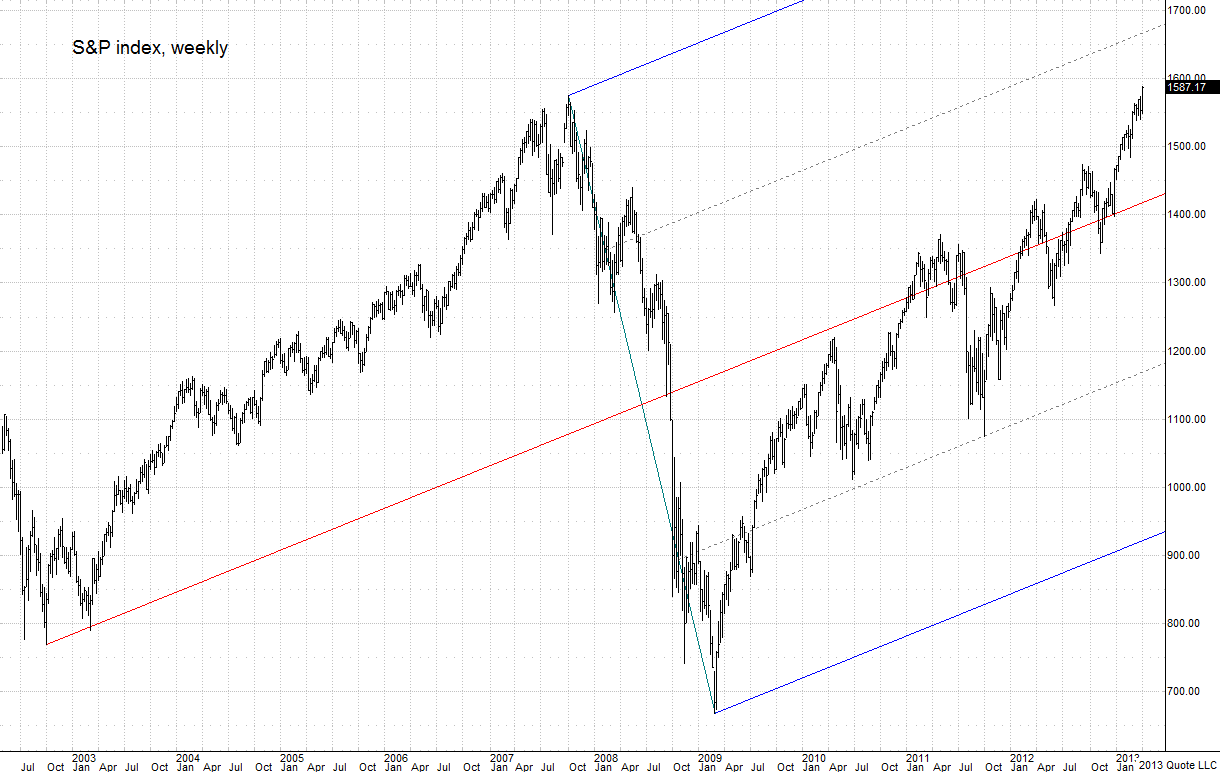
Here's some basic work that shows the two areas, the 1600's stuff, and the year end 2000 stuff. Recall when I posted on this before, describing how the majority may get fooled. No one, and I mean no one mainstream that I can find, is calling an end to the bull this early summer. That's the first area. Everyone is calling for the end of the year, early next year.
Maybe it fools everyone because if it hits 2000 right at year end they will all say it's different this time and this bull will never end, and then they get hammered and won't capitulate/sell for a long time as they call the bottom all the way down. Just some scenarios. Probably what it finally does will come as a total surprise to me. In the meantime, these are working premises.
Click image for original size
Charts created on QCharts, courtesy eSignal
JI
jimkane
Rep: 3,058
Posts: 33,089
No, not yet, not until one of my two areas above is reached.
Originally posted by rat89
all we need now is for robert prechter to throw in the towel and go long
JI
jimkane
Rep: 3,058
Posts: 33,089
Watch the bullish 3-min ABCD here for clues on that countertrend. Or, if you are still long the move up, of course.
JI
jimkane
Rep: 3,058
Posts: 33,089
Right up to an area where it could weaken, and it does. In 'the old days' I'd expect some profit takers to come in at day's end, especially short-term traders, and this would sell a bit. Nowadays, all this will likely be is a little fake down, and then another blast right up. I'm just pointing out how things have changed. As long as we see this, and adapt, it's still very tradeable. I'm just saying, it sure is different in that regard.
JI
jimkane
Rep: 3,058
Posts: 33,089
And then entire little fast drop is made right back up super-fast. Ho-hum. Yawn.
JI
jimkane
Rep: 3,058
Posts: 33,089
I was going to ask you, roofer, if you caught that gold move, and I decided to look back again at your posts, and I see you caught it via the GDX, and the oil move, too. Nice. Wait a minute, I just realized, what's the point of this post? Hmmm, I guess there is none? At least it will up my post count by one.