JI
jimkane
Rep: 3,058
Posts: 33,089
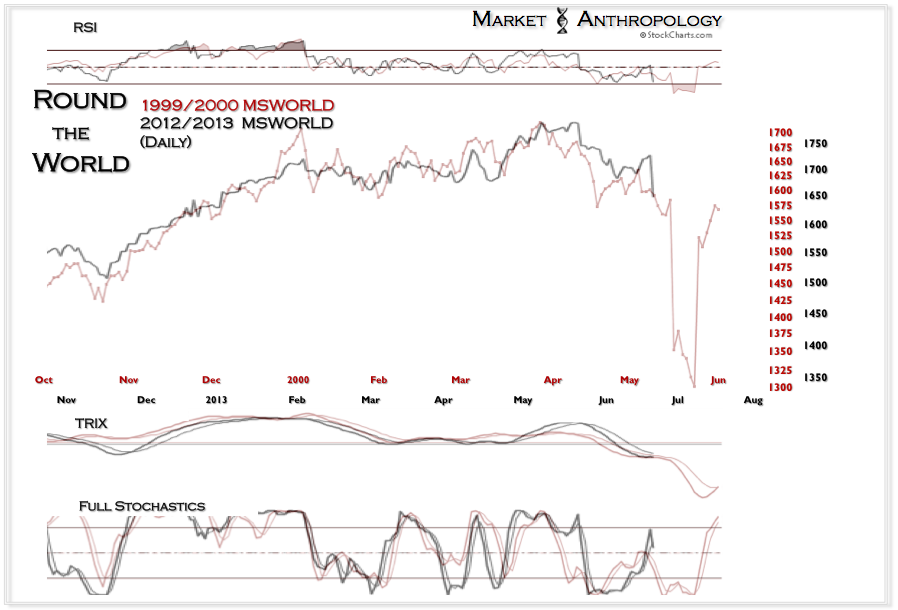
Wow, I haven't followed those guys lately. Interesting how I'm getting that feeling, and then they are showing this. I think it's coming. That shows ES 1300's? That's about what I was thinking, 20% in short order. Gosh, I hope so... Nice post, roofer.
Originally posted by roofer
wicked asset selloff
Click image for original size
JI
jimkane
Rep: 3,058
Posts: 33,089
Yes, I know that they are showing the MS world index there, but if the ES followed (it may greatly lag the other countries, but on the other hand, they are beat down a lot already, so the ES may play 'catch up', too), it would be in the 1300's. That's what I meant, not that the chart values were ES values.
MA
MarcinO
Rep: 67
Posts: 5,506
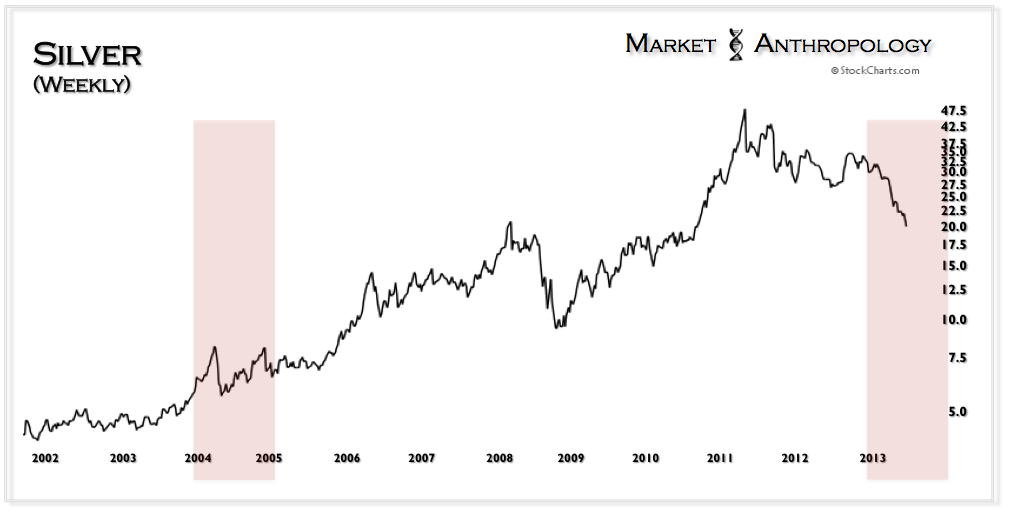
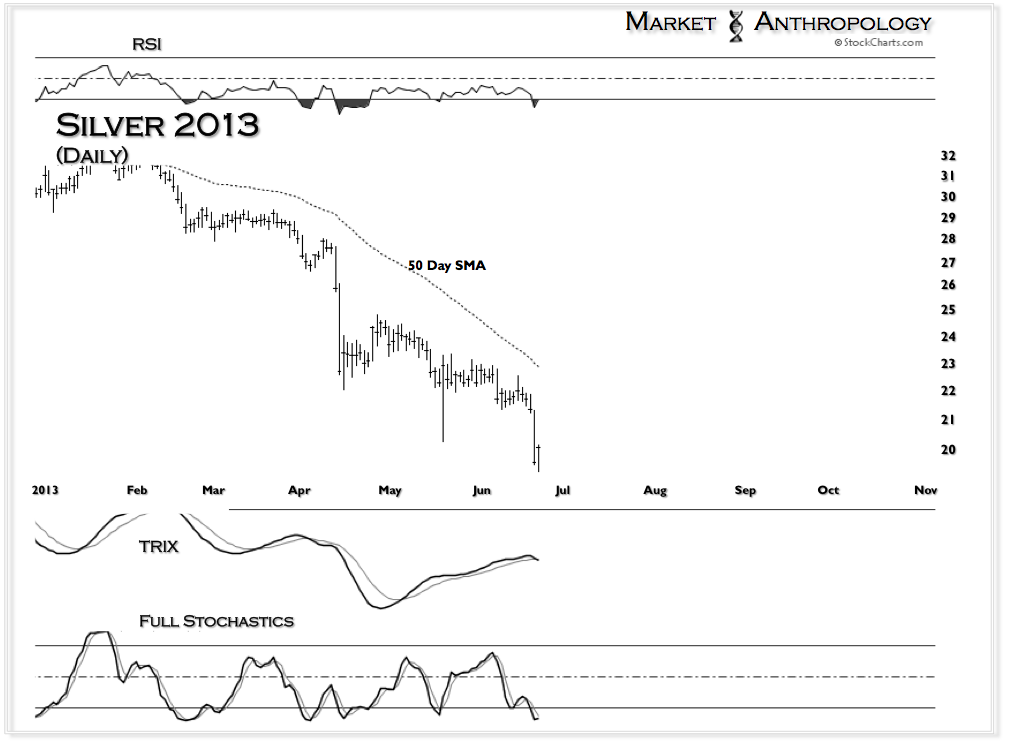
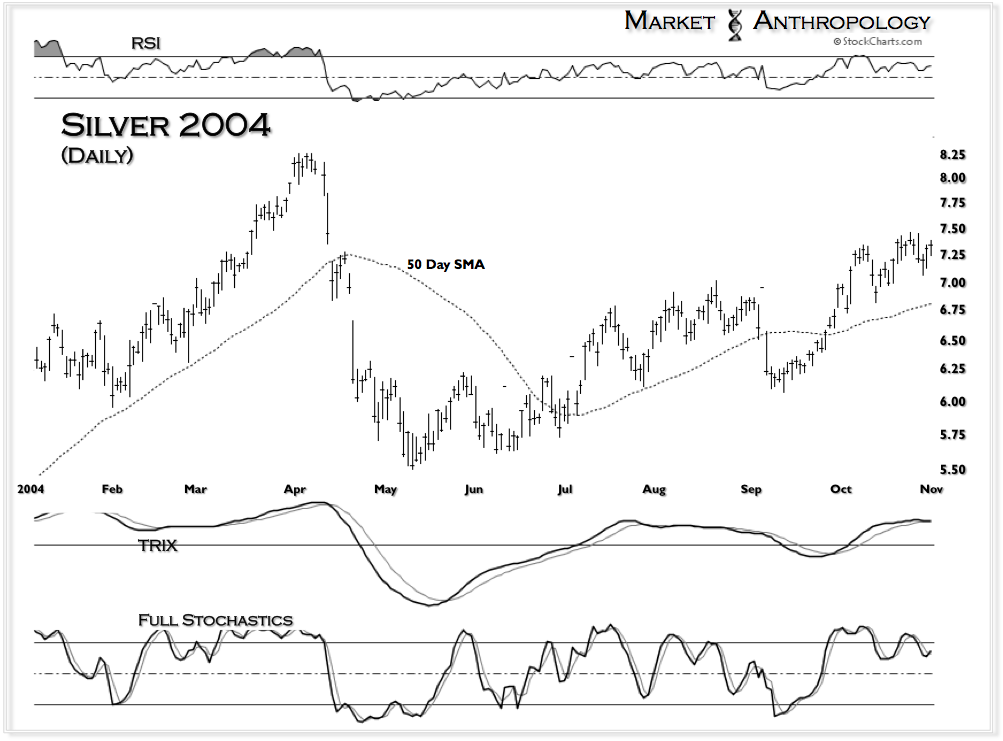
Looks like Market Anthropology supports importance of reversal area in silver, indicated by Jim.
Notice 3D marking the reversal in 2004.
I also came back to their site just after roofer's post.
Notice 3D marking the reversal in 2004.
I also came back to their site just after roofer's post.
Click image for original size
Click image for original size
Click image for original size
JI
jimkane
Rep: 3,058
Posts: 33,089
My ES workup shows 1350-80 as the key area, but it depends on how long it takes. If it's in early July (like in the next two weeks?) like the MA chart shows, it may go as low as 1340 or even a stab below there, but that violates some nice Fib stuff and other key lines by quite a bit. That area, though, is the obvious TL from the 2009 low. So, I'd expect games there.
If it takes a little more time and the upsloping lines start to meet the other things, then the confluence gets better. But, the tightest I can get it now is 1350-80, or so. I may be able to do better if it gives me something on the way down. Even if all this happens, the darn uptrend from 2009 would still be intact! This would also be 20% down from the high, just about dead on (at 1350). My basis is the eSignal #F contract. I'll do some work on the S&P cash index later.
BTW, this confluence is insane. But will we even see it?
MA
MarcinO
Rep: 67
Posts: 5,506
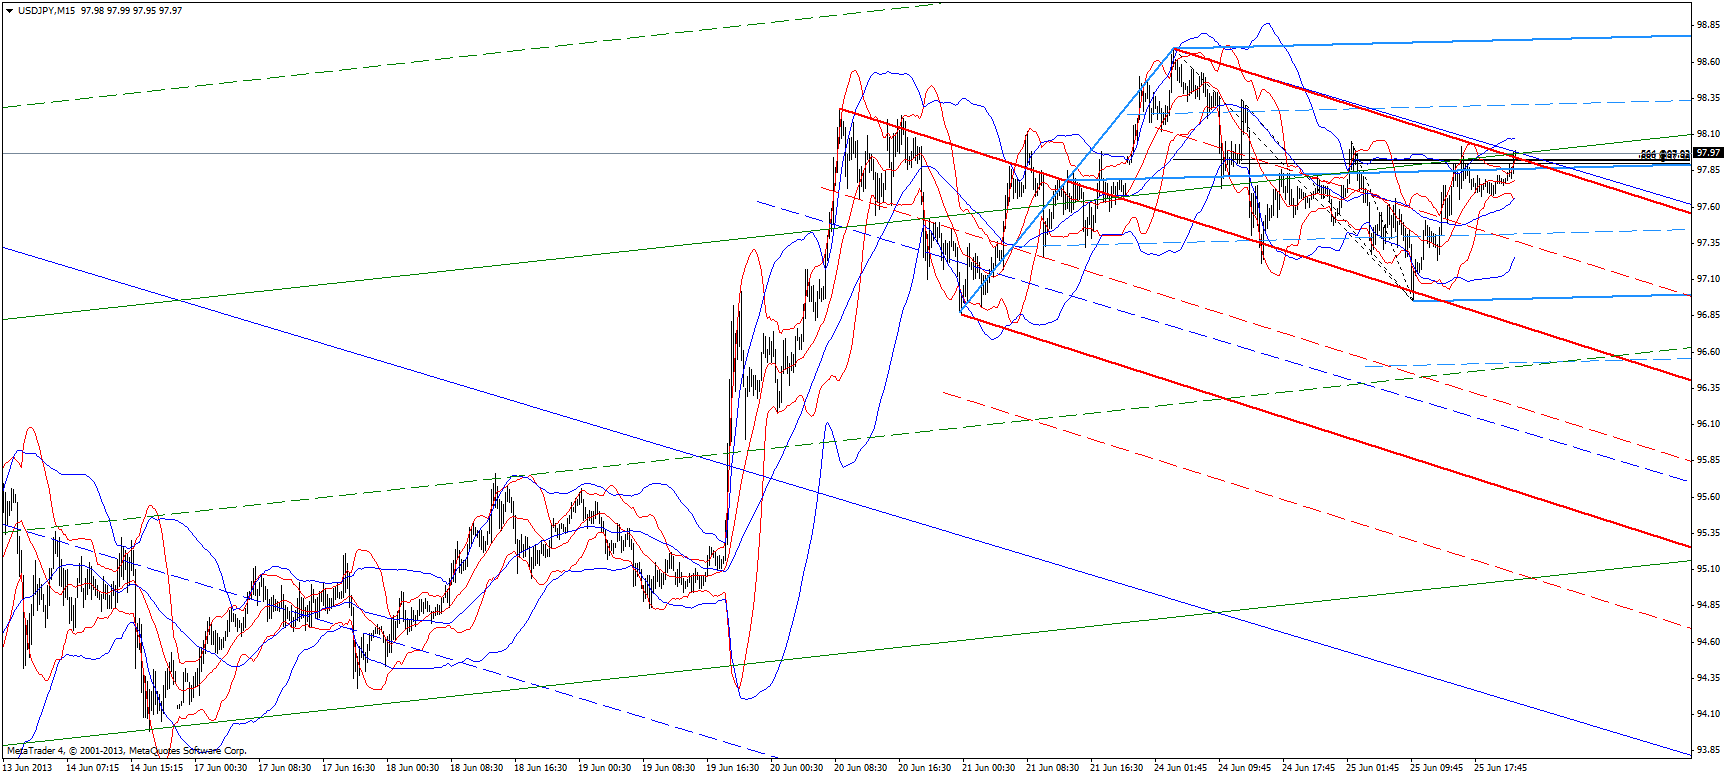
The most optimistic scenario for the Yen is that this area marks retest of right shoulder of H&S. Let's see how it unfolds.
Click image for original size
JI
jimkane
Rep: 3,058
Posts: 33,089
Also, on the way down, around 1450 is just a wicked area. Low 1500's also has some nice stuff.
JI
jimkane
Rep: 3,058
Posts: 33,089
I think some truly thrilling times are about to unfold from a trading standpoint.
JI
jimkane
Rep: 3,058
Posts: 33,089
If we get this drop (ah, talk about building up false hope, only to be let down, again...) I expect crude to drop around 10, taking out that April low. We'll see... I'm not getting my hopes up too much.
JI
jimkane
Rep: 3,058
Posts: 33,089
The crazy thing is, and I'm just fantasizing out loud, when I look at the weekly chart, blank and then with just a few lines on there, all I see is the 1200 area (actually, just below). Nothing else. It's what jumps off the chart at me. It's 'price flow' there. And let's see, using the S&P cash, 30% off the high is... drum roll... about 1181, dead on all my key lines. That would be a nice bear market. Imagine if that happened, dead off my weekly chart posted multiple times in advance. Wow, that would be cool.
BTW, the 50% retracement of the entire manipulation 'bull' market is, one more drum roll... 1177. Hmmmm.
BTW, the 50% retracement of the entire manipulation 'bull' market is, one more drum roll... 1177. Hmmmm.
JI
jimkane
Rep: 3,058
Posts: 33,089
I checked it out, it was Mar 11 that I first posted that weekly S&P chart, showing my most preferred 'bull' market ending spot. It would be cool if it played out. But, I'd be happy if this about 8% correction was it, too, since it hit the time and price just about dead on and reacted. I'd be happier, though, if this was it...
RO
roofer
Rep: 3,689
Posts: 3,574
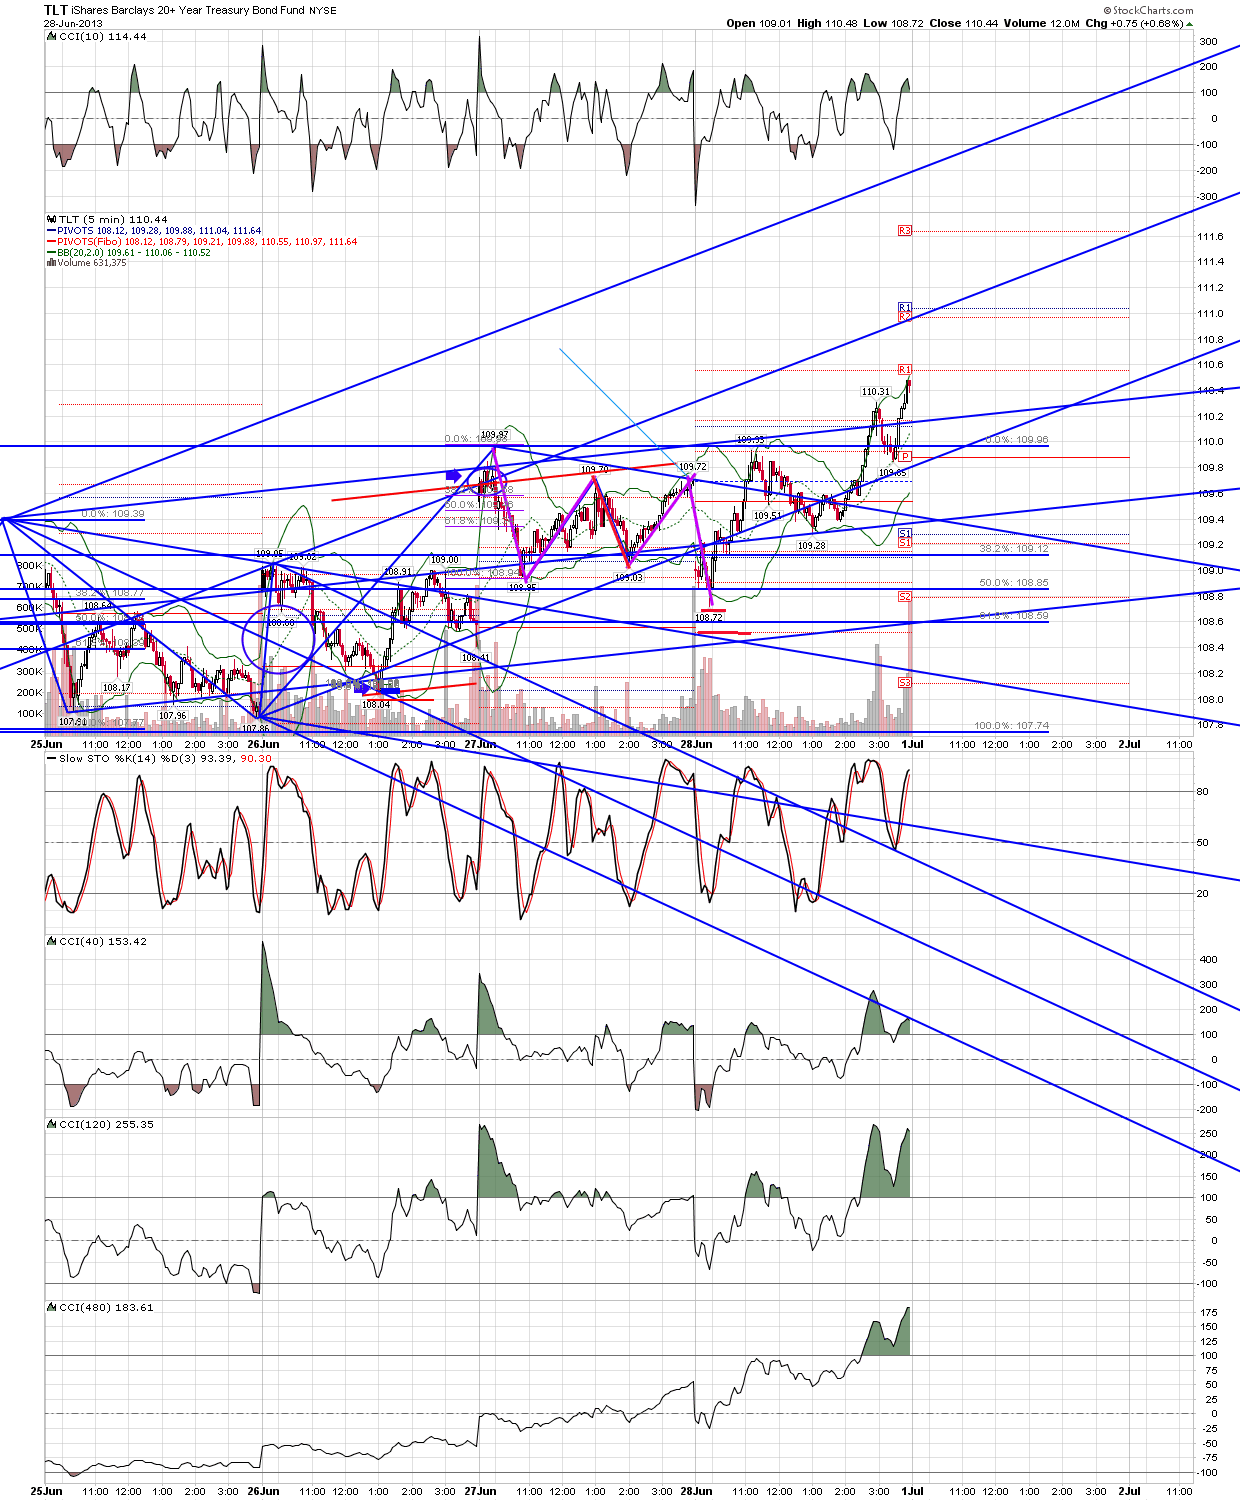
TLT update from previous... after taking half off on thursday morning as shown, the close on thursday left me with the same quandry we often get using the tools of this forum... price had thrust down, then done an abcd to line.. classic sell signal.. but given that our longer term charts suggest a larger low in bonds, the bullish scenario would have price completing abcd with equal legs with abcd as middle leg... so i marked an equal leg and placed stop twenty cents below... so far so good .. but time will tell...
Click image for original size