JI
jimkane
Rep: 3,058
Posts: 33,089
Marcin, I can't figure out why your S&P charts are like 5 points higher than mine?
BA
Barkley
Rep: 0
Posts: 58
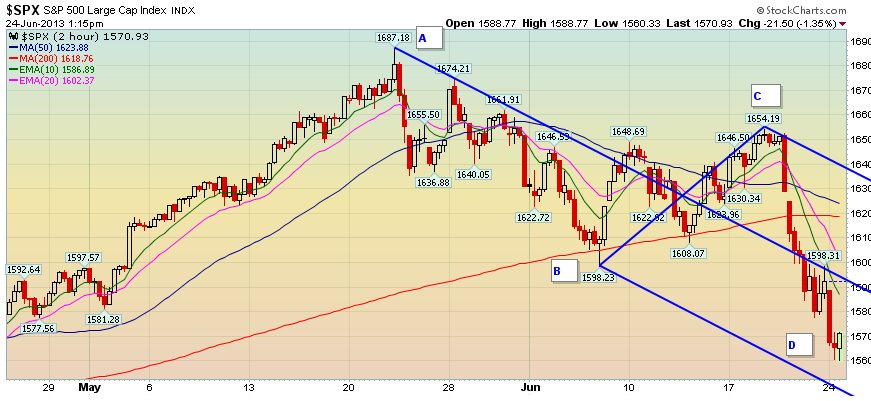
Seems to me that the ES daily is a nice ABCD with a nice ABCD in the BC leg.
Click image for original size
JI
jimkane
Rep: 3,058
Posts: 33,089
I'd just say it is because it's the index, but don't you have overnight data on there? Then it couldn't be the index.
Originally posted by jimkane
Marcin, I can't figure out why your S&P charts are like 5 points higher than mine?
JI
jimkane
Rep: 3,058
Posts: 33,089
Yes, but it may be a 'W3'. Maybe not, but it is worth considering.
Originally posted by Barkley
Seems to me that the ES daily is a nice ABCD with a nice ABCD in the BC leg.
Click image for original size
MA
MarcinO
Rep: 67
Posts: 5,506
S&P500 I use is not an actual index, but CFD. I don't know the details on how my broker calculates its value.
It's a drawback for me as I have to check the difference between the ES quote and my data to figure out value of the ES levels you provide.
It's a drawback for me as I have to check the difference between the ES quote and my data to figure out value of the ES levels you provide.
Originally posted by jimkane
I'd just say it is because it's the index, but don't you have overnight data on there? Then it couldn't be the index.
Originally posted by jimkane
Marcin, I can't figure out why your S&P charts are like 5 points higher than mine?
JI
jimkane
Rep: 3,058
Posts: 33,089
It's just soooo grindy and weak looking. But, sometimes, since Mar '09, they grind and overlap then explode it up in an impulse. I just suspect this hasn't got much if anything more to give here.
JI
jimkane
Rep: 3,058
Posts: 33,089
Ah, I didn't even think about a CFD. Thanks.
Originally posted by MarcinO
S&P500 I use is not an actual index, but CFD. I don't know the details on how my broker calculates its value.
It's a drawback for me as I have to check the difference between the ES quote and my data to figure out value of the ES levels you provide.
Originally posted by jimkane
I'd just say it is because it's the index, but don't you have overnight data on there? Then it couldn't be the index.
Originally posted by jimkane
Marcin, I can't figure out why your S&P charts are like 5 points higher than mine?
RO
roofer
Rep: 3,689
Posts: 3,574
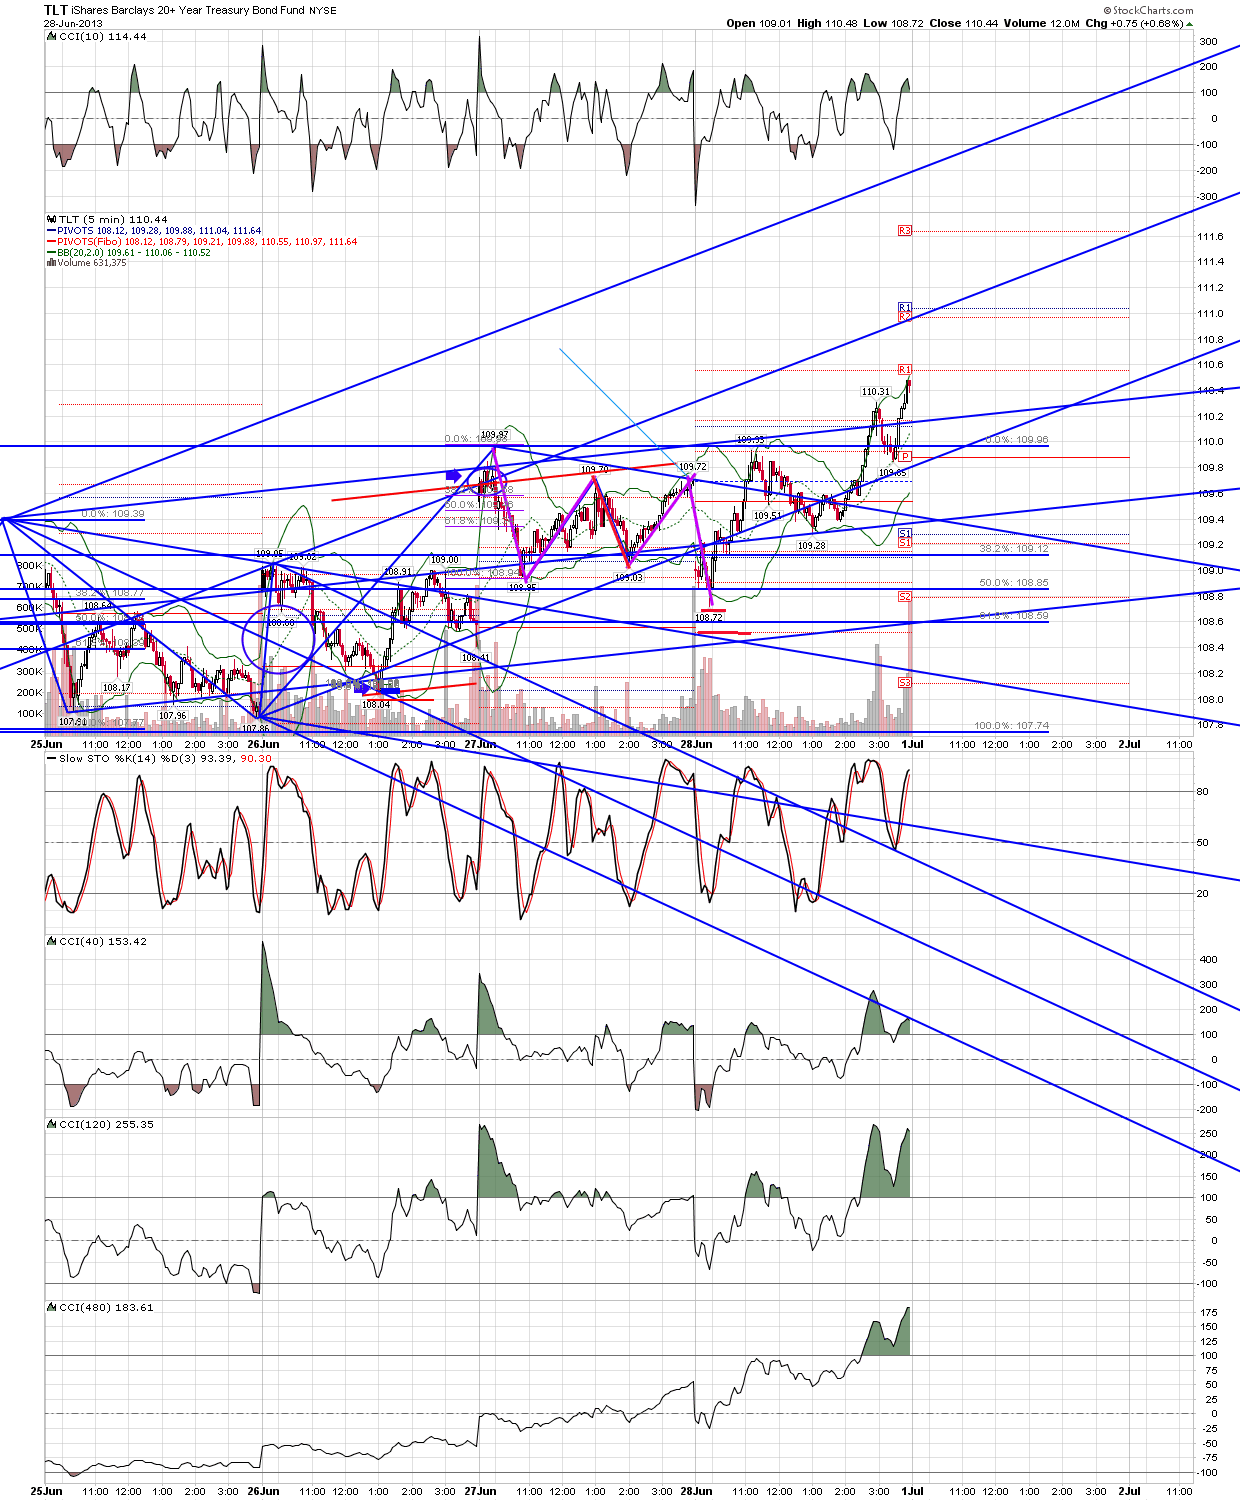
TLT update from previous... after taking half off on thursday morning as shown, the close on thursday left me with the same quandry we often get using the tools of this forum... price had thrust down, then done an abcd to line.. classic sell signal.. but given that our longer term charts suggest a larger low in bonds, the bullish scenario would have price completing abcd with equal legs with abcd as middle leg... so i marked an equal leg and placed stop twenty cents below... so far so good .. but time will tell...
Click image for original size