BA
Barkley
Rep: 0
Posts: 58
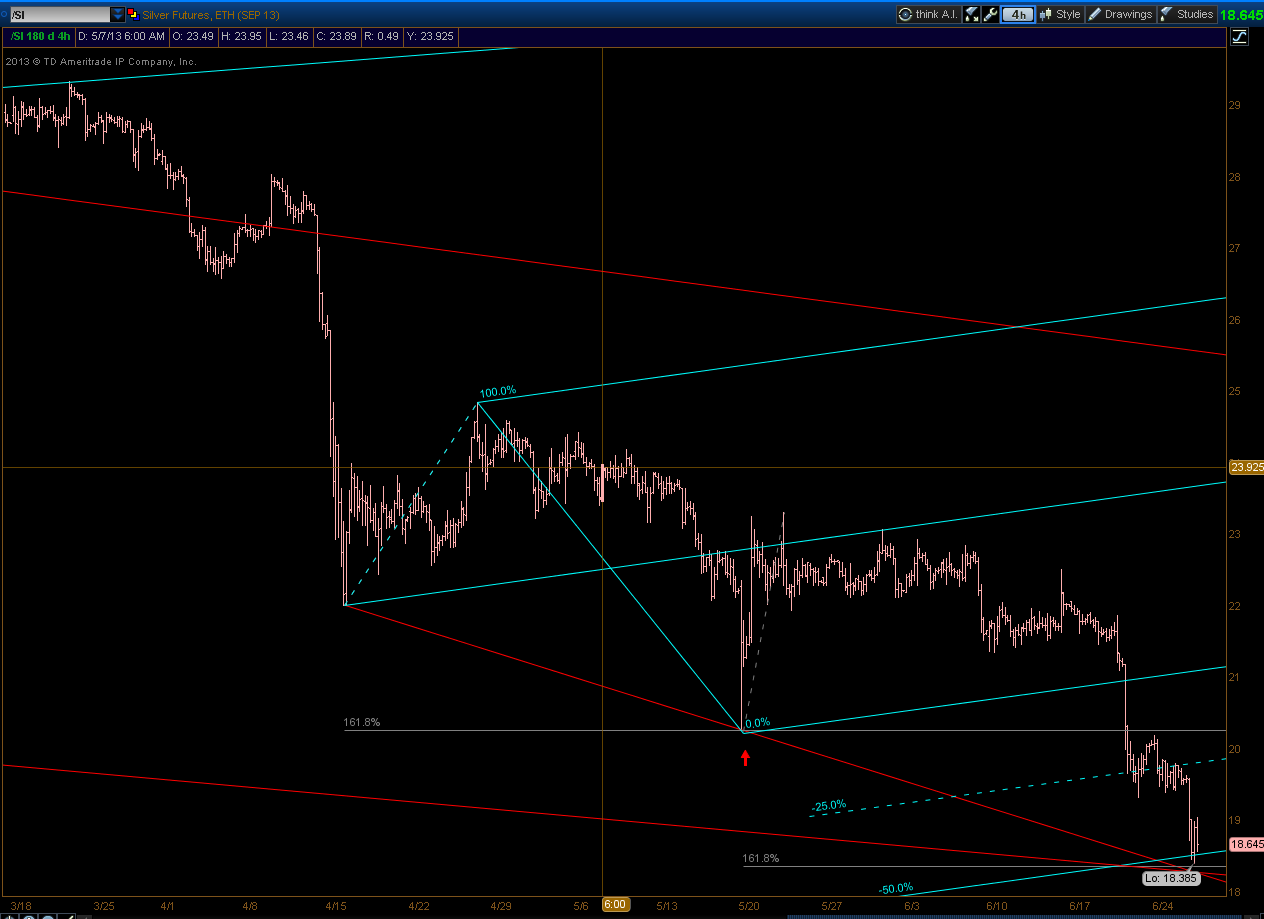
Silver is at a very interesting spot... 1.618 twice on the bottoms.
Click image for original size
JI
jimkane
Rep: 3,058
Posts: 33,089
Imagine if this was right, and after this dump gold did hit my $5,000 level I thought it might when things hit the fan. This was posted August 15, 2011.

Chart is from this page (although I have seen it many other places):
http://www.etf-corner.com/markets/2011/08/gld-gold-crash-gold-bubble-.html
Chart is from this page (although I have seen it many other places):
http://www.etf-corner.com/markets/2011/08/gld-gold-crash-gold-bubble-.html
JI
jimkane
Rep: 3,058
Posts: 33,089
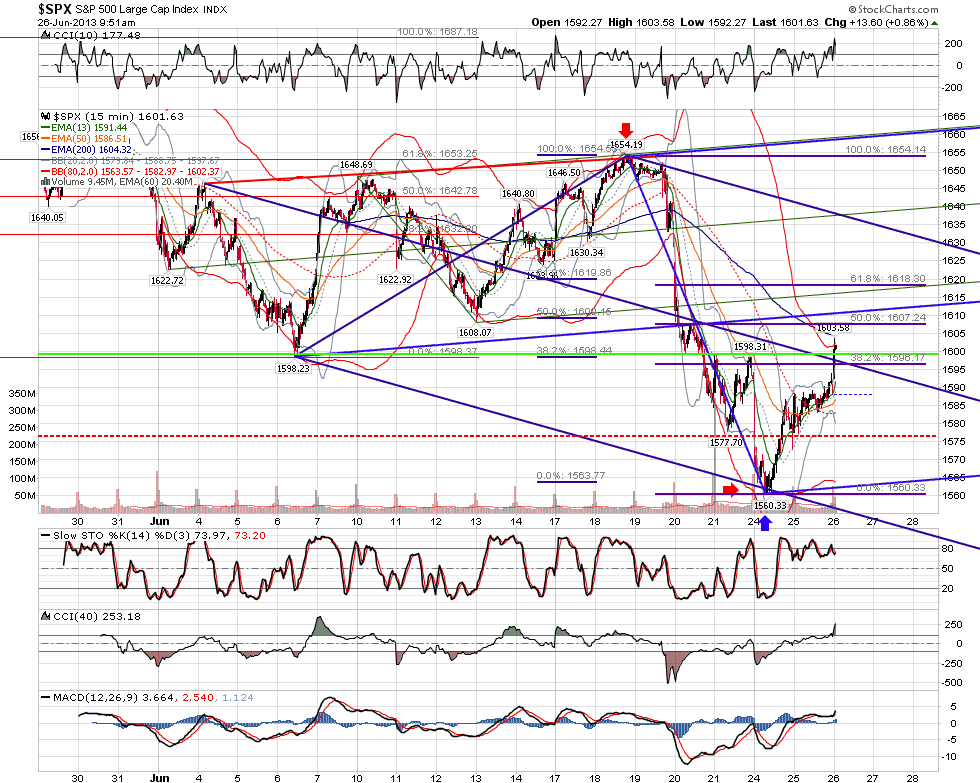
So, on this long play that is unfolding, I am watching say 1599.50-1601.00 and then around 1603-4, but it is really one higher timeframe layer over both those sub-levels from the lower timeframe. And we are just about there... Close enough to be ready, in case. If all this blows out, then near 1610 is the next level.
RO
roofer
Rep: 3,689
Posts: 3,574
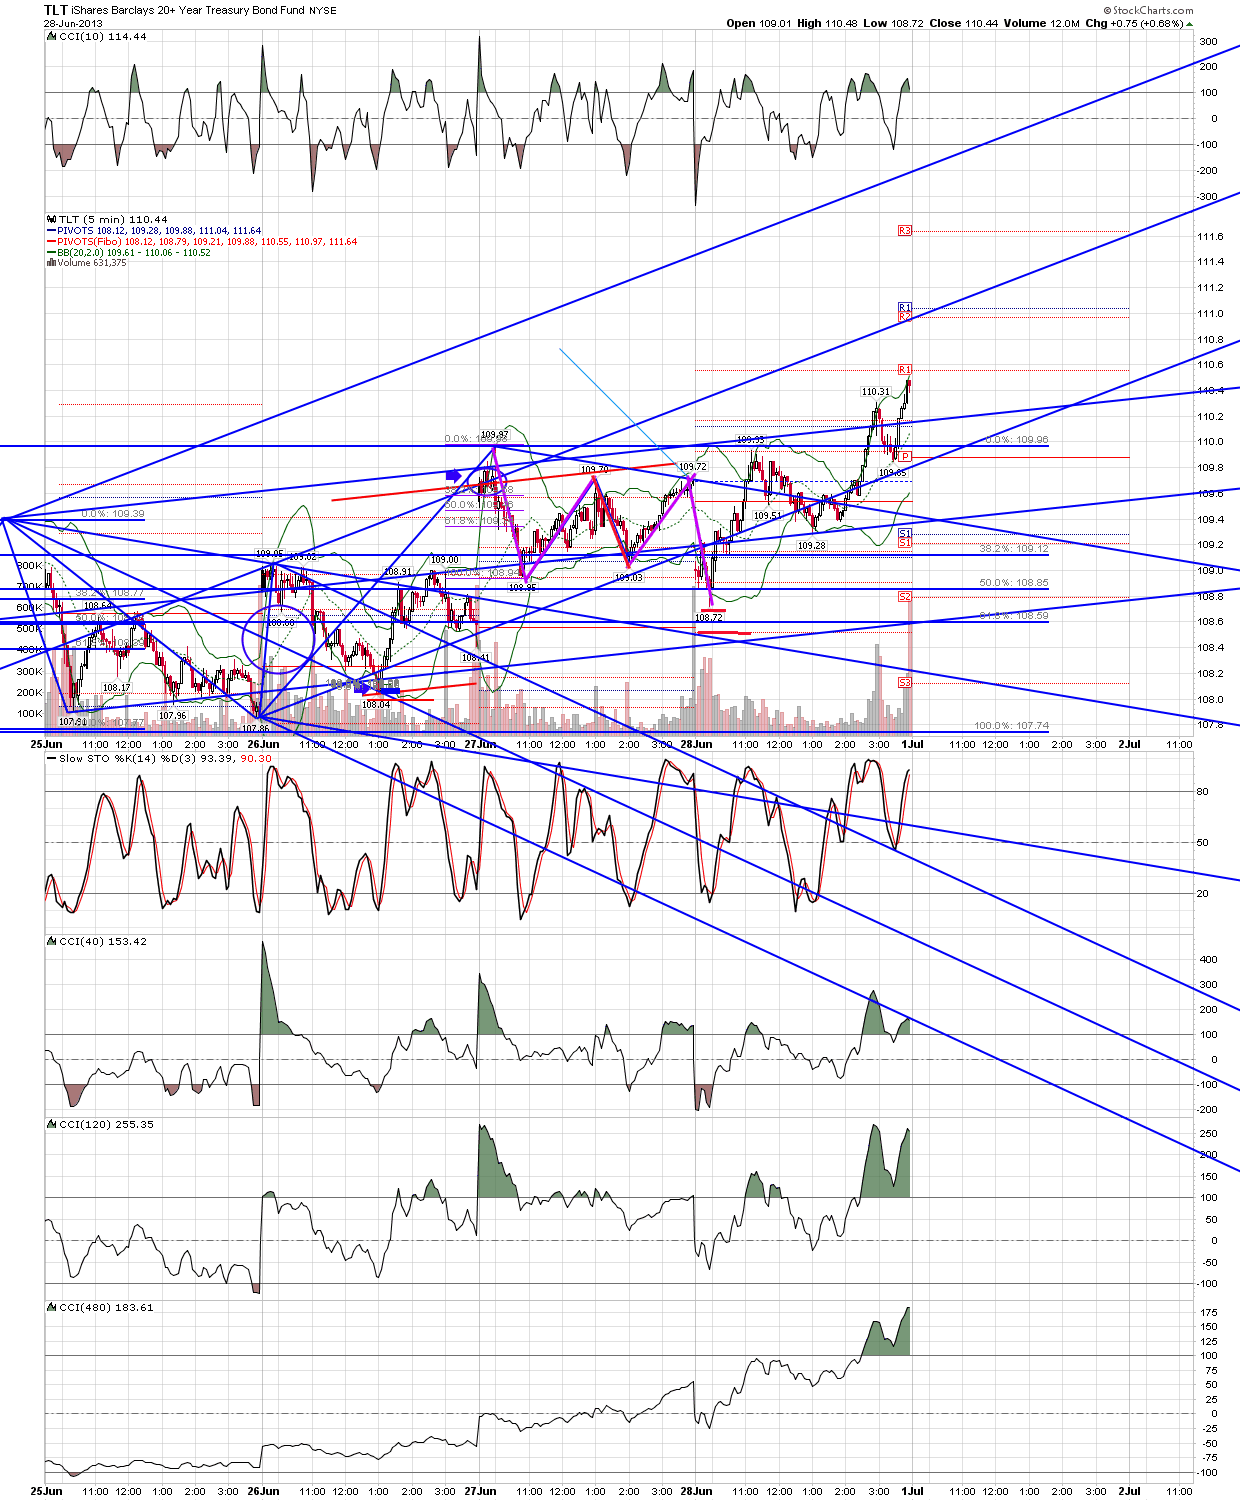
TLT update from previous... after taking half off on thursday morning as shown, the close on thursday left me with the same quandry we often get using the tools of this forum... price had thrust down, then done an abcd to line.. classic sell signal.. but given that our longer term charts suggest a larger low in bonds, the bullish scenario would have price completing abcd with equal legs with abcd as middle leg... so i marked an equal leg and placed stop twenty cents below... so far so good .. but time will tell...
Click image for original size