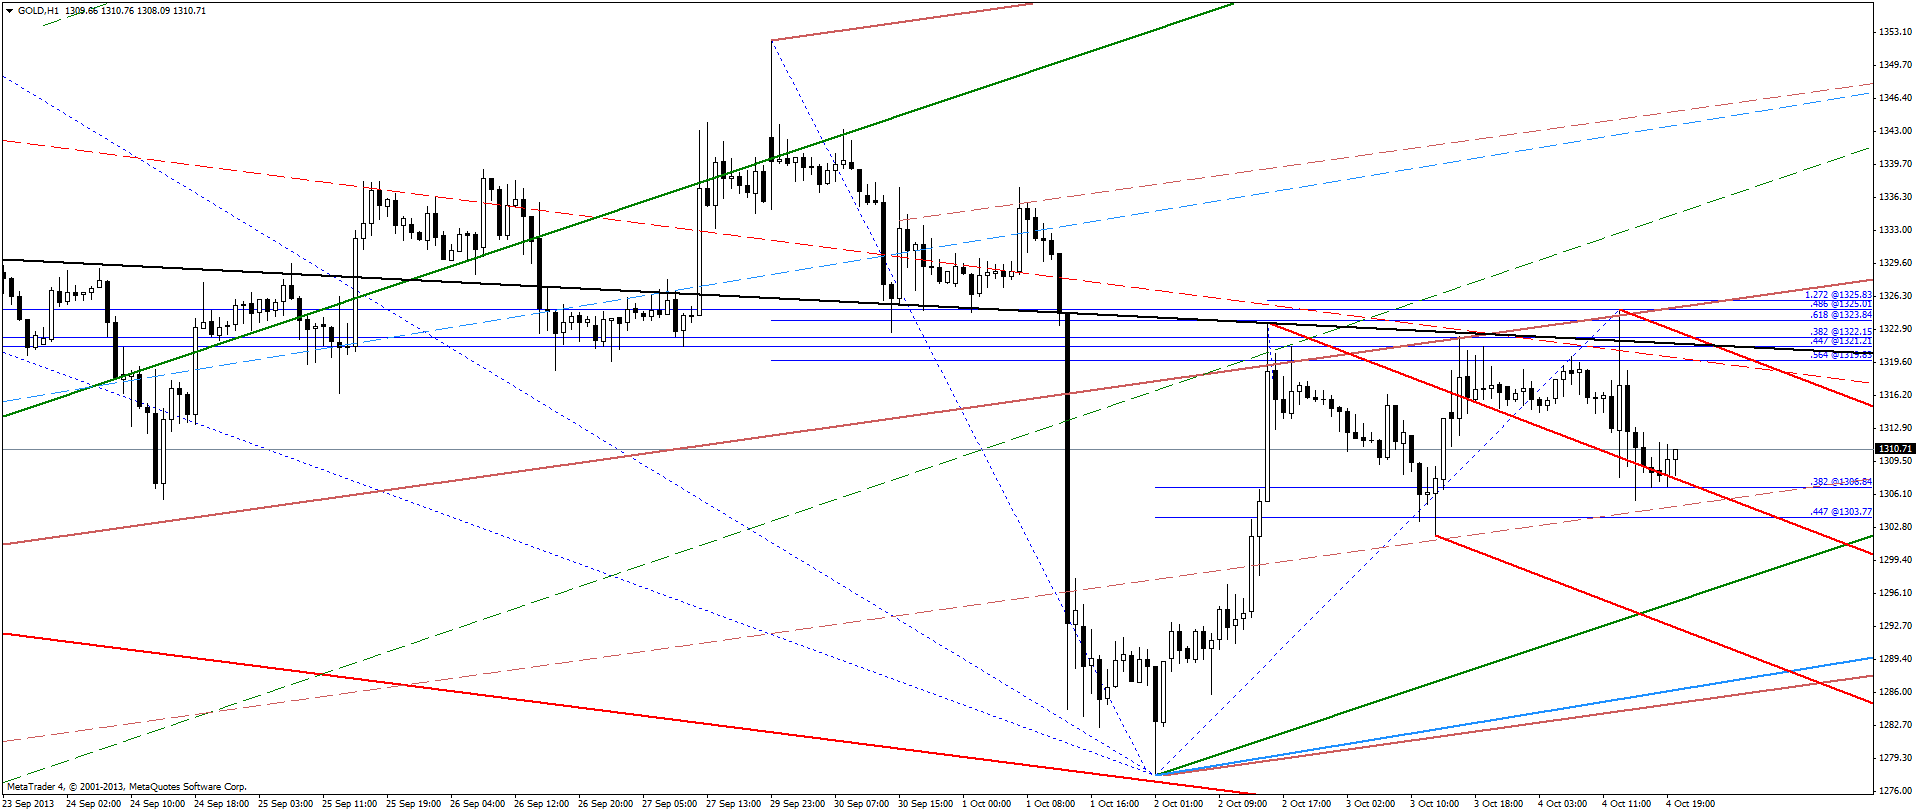
Gold made an ABCD against previously posted bearish area.
JI
jimkane
Rep: 3,058
Posts: 33,089
Are we really going to see new all-time highs in the next 1-2 trading days? Really?
JI
jimkane
Rep: 3,058
Posts: 33,089
Okay, I finally verified this was a parody, not serious. I was hoping it was serious, because it might finally get some people thinking. Darn.
Originally posted by jimkane
Are you F'in kidding me?
http://www.zerohedge.com/news/2013-10-10/fact-or-fiction-obama-administration-proposes-2300-page-new-constitution
JI
jimkane
Rep: 3,058
Posts: 33,089
And there goes the HOD. Unreal. I guess 47.75 points since yesterday isn't enough.
RA
rat89
Rep: 0
Posts: 7,015
with a set up like that at the low right in the gz? nope
Originally posted by jimkane
And there goes the HOD. Unreal. I guess 47.75 points since yesterday isn't enough.
JI
jimkane
Rep: 3,058
Posts: 33,089
Well, yes, the setup was fantastic. But you'd think it would be tired and need to rest a bit. Usually it chops after the close or burns time. Last night, none of that. So, on a huge move I'd think it would be resting a little. Two days in a row after the close and it's moving like it's the RTH. I just find that 'interesting'.
JI
jimkane
Rep: 3,058
Posts: 33,089
Here's Karl's go dark explanation. It will be up through the weekend. I think everyone should read it.
http://market-ticker.org/
MA
MarcinO
Rep: 67
Posts: 5,506
I'm not sure if this is what you meant, but INDU made 12 days of 300+ point since 2009 low measured as close/open difference. 300+ daily range happened 47 times during this period.
Originally posted by jimkane
Actually, I'm not so sure there haven't been 300+ up days since that 3/6/9 low (except the one right after). If someone has a current subscription to like TC2000, you can scroll the Dow bar by bar and look at the amount it was up or down, and see how many times this has happened. I'd be curious if anyone could do this and post the results.
JI
jimkane
Rep: 3,058
Posts: 33,089
Marcin, I need to know how much it finished the day up, so from one close to the next day's close. But based on what you said, I'm guessing there were quite a few, then. If so, then it doesn't mean much that we just had one.
MA
MarcinO
Rep: 67
Posts: 5,506
The number is still 12. I'm working on data exported from QCharts so I can check it fast.
JI
jimkane
Rep: 3,058
Posts: 33,089
Interesting article, but I'm mostly posting it as a reference for this one quote.
"Iceland went through a similar deflationary event to that risked in the US today when its banking system collapsed and the currency halved overnight."
Now, wait, during a deflation their currency got cut in half? No, hold up, wait, all I've ever heard is that during a deflation cash is king, it's super rare, and its buying power increases. Yeah, uh-huh, that's what really happens in the real world. My money gets me more stuff. Uh-huh. Deflation and less buying power. Makes sense.
http://www.zerohedge.com/news/2013-10-12/gold-debt-ceiling-and-fed