ES Monday 1-5-15
Here is how I see it.....traditionally a bullish day except the last few years haven't played it that way.....critical day I think today........"b" pattern on Friday....are the bears growing tired ? Will they go get the new highs or will further selling have us closing under the 50 day ma on the SPX today?.....
gonna add to this post in a minute
more babble and greenie analysis
gonna add to this post in a minute
more babble and greenie analysis
cool .. alook at that greenie from 12-12
Click image for original size
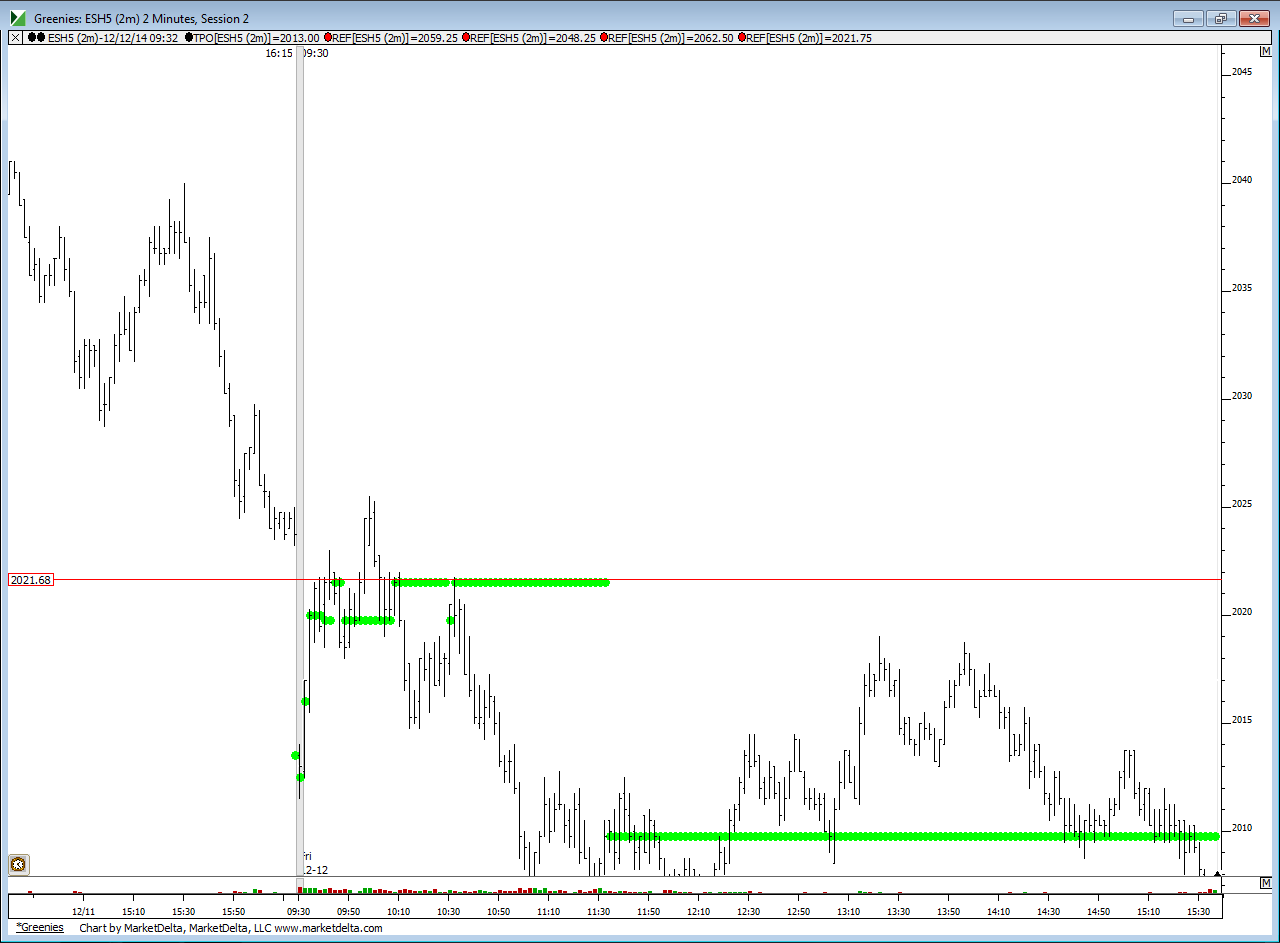
very nice Bruce. do you usually look for untested greenies?
29 is today's developing greenie
yes...I always watch them because my Ib data is telling me VOlume came in there...some use greenies as magnets...it works both ways ,
I am still unclear on what a greenie is?
newkid,
you have greenies set-up with a different feed... can you post a chart like the one Bruce posted... what the greenies you have from 12/12 look like?
you have greenies set-up with a different feed... can you post a chart like the one Bruce posted... what the greenies you have from 12/12 look like?
daddywolf,
Greenie is just the intraday developing Volume Point of control. it shifts and changes as more volume at price occurs at different price levels... the fascination with Bruce's 'greenies' is that they are fed by IB data and rarely match tick by tick volume data.
Greenie is just the intraday developing Volume Point of control. it shifts and changes as more volume at price occurs at different price levels... the fascination with Bruce's 'greenies' is that they are fed by IB data and rarely match tick by tick volume data.
i also expect more tpos' to print at 26.75 this week....so no selling for me down here...actually key numbers are 2017, 2011- 2012....( a biggie ) AND 2006.25 .I thought a difficult day ONLY because it did what I didn't really expect.. ...AND RUNNERS DIDN'T WORK VERY WELL....BUT was still able to take a few small slices out of the pie
Paul,
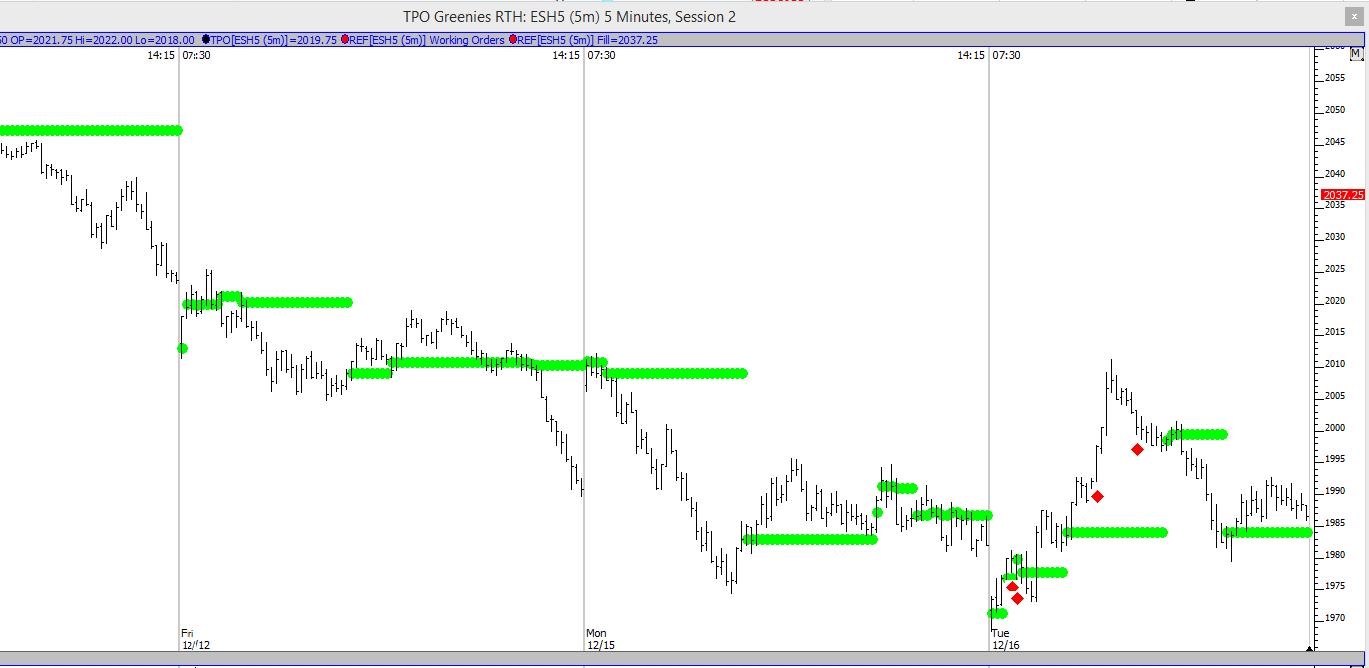
here is a picture. i have them at 20.25. 9.25 and 11
also i have not forgotten about you. i will try to get you the data soon
here is a picture. i have them at 20.25. 9.25 and 11
Click image for original size
also i have not forgotten about you. i will try to get you the data soon
Thanks, newkid,
now we can compare how different (or the same) tick by tick volume data is when compared to the IB volume data.
a friend told me that IB sends out data 10 second (or something like that), it is not every single tick but it would work fine for market profile... the hitch for volume (according to my friend) is that IB uses the following measure for volume on each of the sendouts (10 sendouts a second or whatever) total volume now (at the time of the transmission) minus total volume at the time of the last transmission, so whatever price happens to be at the sendout might capture all the volume (which still seems reasonable).
the big problem I see is that when I look at a day of IB intraday data using footprint cells for each tick in price, when there is a ZOOM, a breakout of a range, when price shoots through 3 or 4 or more ticks (price levels) in a hurry, IB does not report any volume, I get zeroes in those cells... if the algo IB uses "catches up" with total volume on subsequent transmissions, then the volume executed in those zero cells might be assigned to price levels that occurred AFTER the Breakout,
in other words, if the algo "makes up" for the missing volume by bringing the total volume up to the proper Total Volume level for the day by assigning that volume to whatever price was printed at the time of the new sendout... this might be why Bruce has levels that vary relative to a tick buy tick volume.
Think of a down vote as a trade that didn't work out and you lost a bit of money on it. Your up votes are your positive trades. Then look at your net balance. Bruce, 131k+ and NewKid 1,710 and you'll see that your commentary has been extremely profitable.
Emini Day Trading /
Daily Notes /
Forecast /
Economic Events /
Search /
Terms and Conditions /
Disclaimer /
Books /
Online Books /
Site Map /
Contact /
Privacy Policy /
Links /
About /
Day Trading Forum /
Investment Calculators /
Pivot Point Calculator /
Market Profile Generator /
Fibonacci Calculator /
Mailing List /
Advertise Here /
Articles /
Financial Terms /
Brokers /
Software /
Holidays /
Stock Split Calendar /
Mortgage Calculator /
Donate
Copyright © 2004-2023, MyPivots. All rights reserved.
Copyright © 2004-2023, MyPivots. All rights reserved.